Solana Falls Under Realized Price: Here’s What Happened Last Time

Source Newsbtc

On-chain data shows Solana (SOL) has seen its spot value drop under the Realized Price for the first time in three years following the recent bearish action.

Solana Has Just Seen A Breakdown Of The Realized Price

According to data from the on-chain analytics firm Glassnode, Solana has slipped around 8% below its Realized Price. The “Realized Price” is an indicator that basically tells us about the cost basis of the average investor or address on a given network.

When the spot price of the asset is trading above this metric, it means the holders as a whole are carrying a net unrealized profit. On the other hand, it being under the indicator suggests the average investor is underwater.

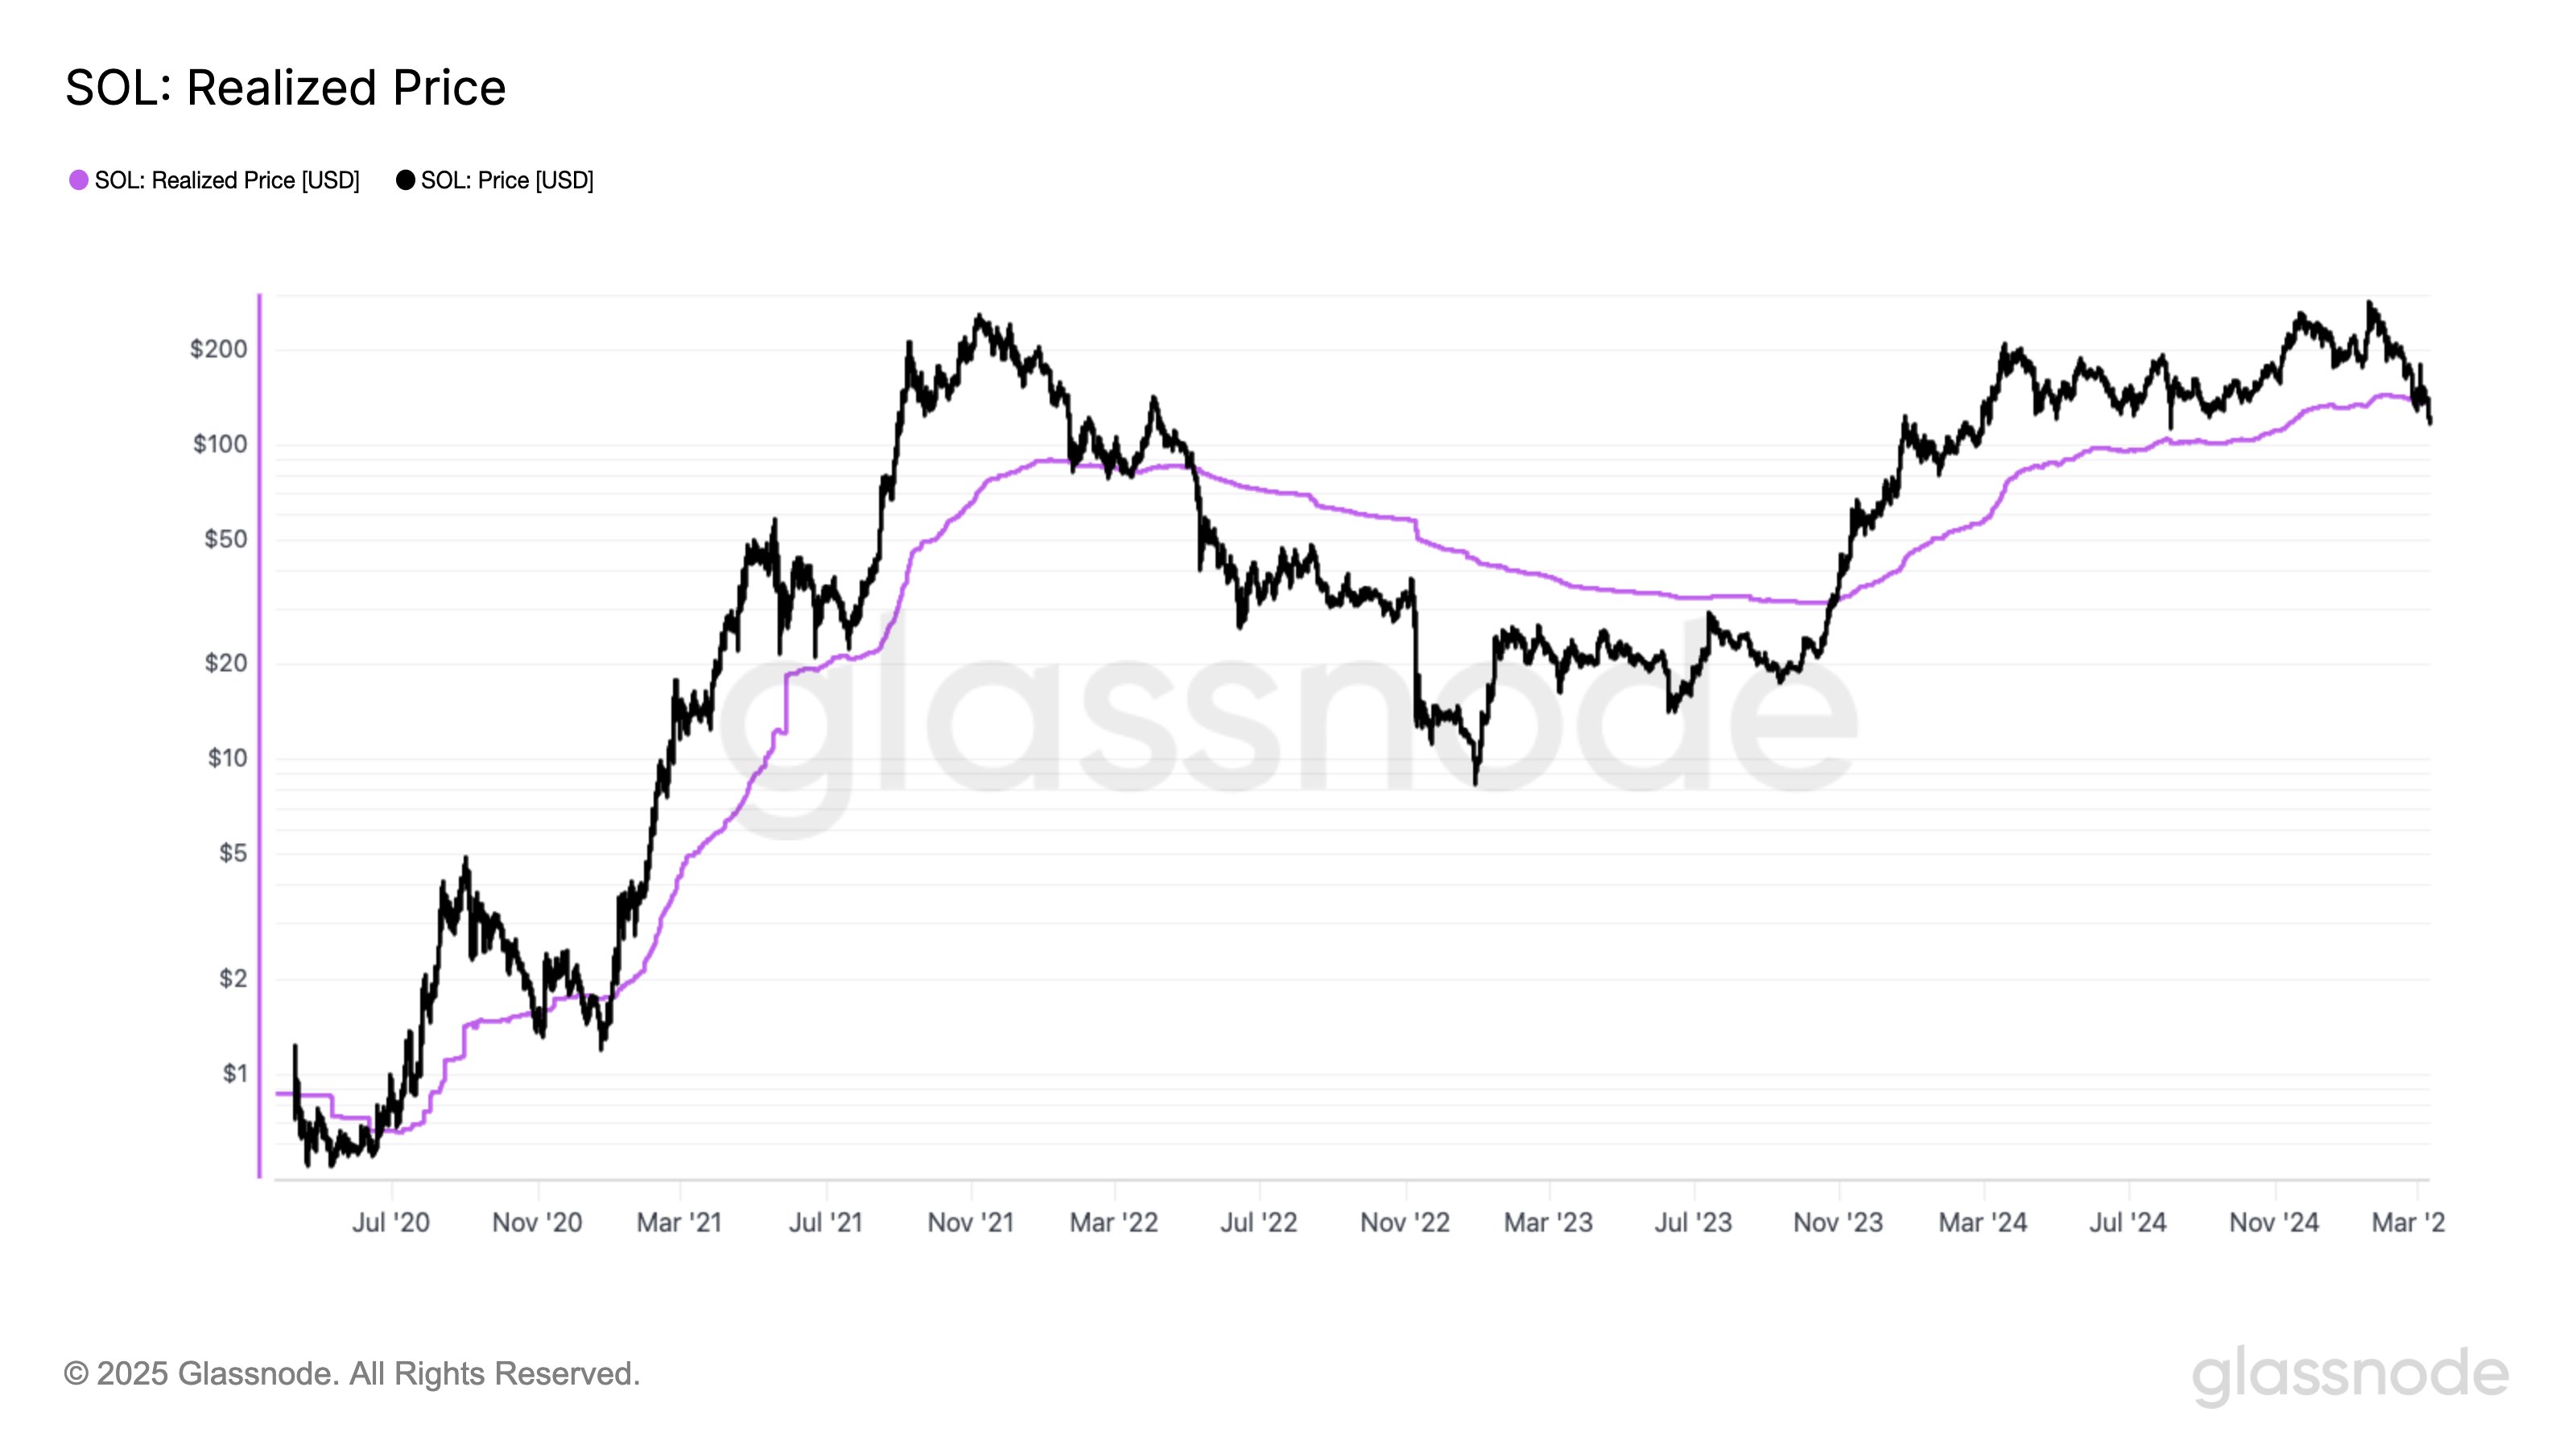
Now, here is the chart shared by the analytics firm that shows the trend in the Realized Price for Solana over the last few years:
Solana Realized Price

As is visible in the above graph, SOL broke above its Realized Price back in 2023, putting investors into the green. Throughout 2024 and the first couple of months of this year, the price remained above the line, but recently, it seems another crossover has finally occurred.

“Solana just plunged below its Realized Price for the first time in nearly 3 years,” notes Glassnode. At the current exchange rate, the price is around 8% below this metric, which means the average holder of the asset could be assumed to be 8% in the red.

From the chart, it’s apparent that the last time the cryptocurrency saw this type of crossover was back in 2022. Losing the level then meant the start of a bear market. Thus, it’s possible that the latest breakdown of the line could prove to be a bad sign for the coin this time as well.

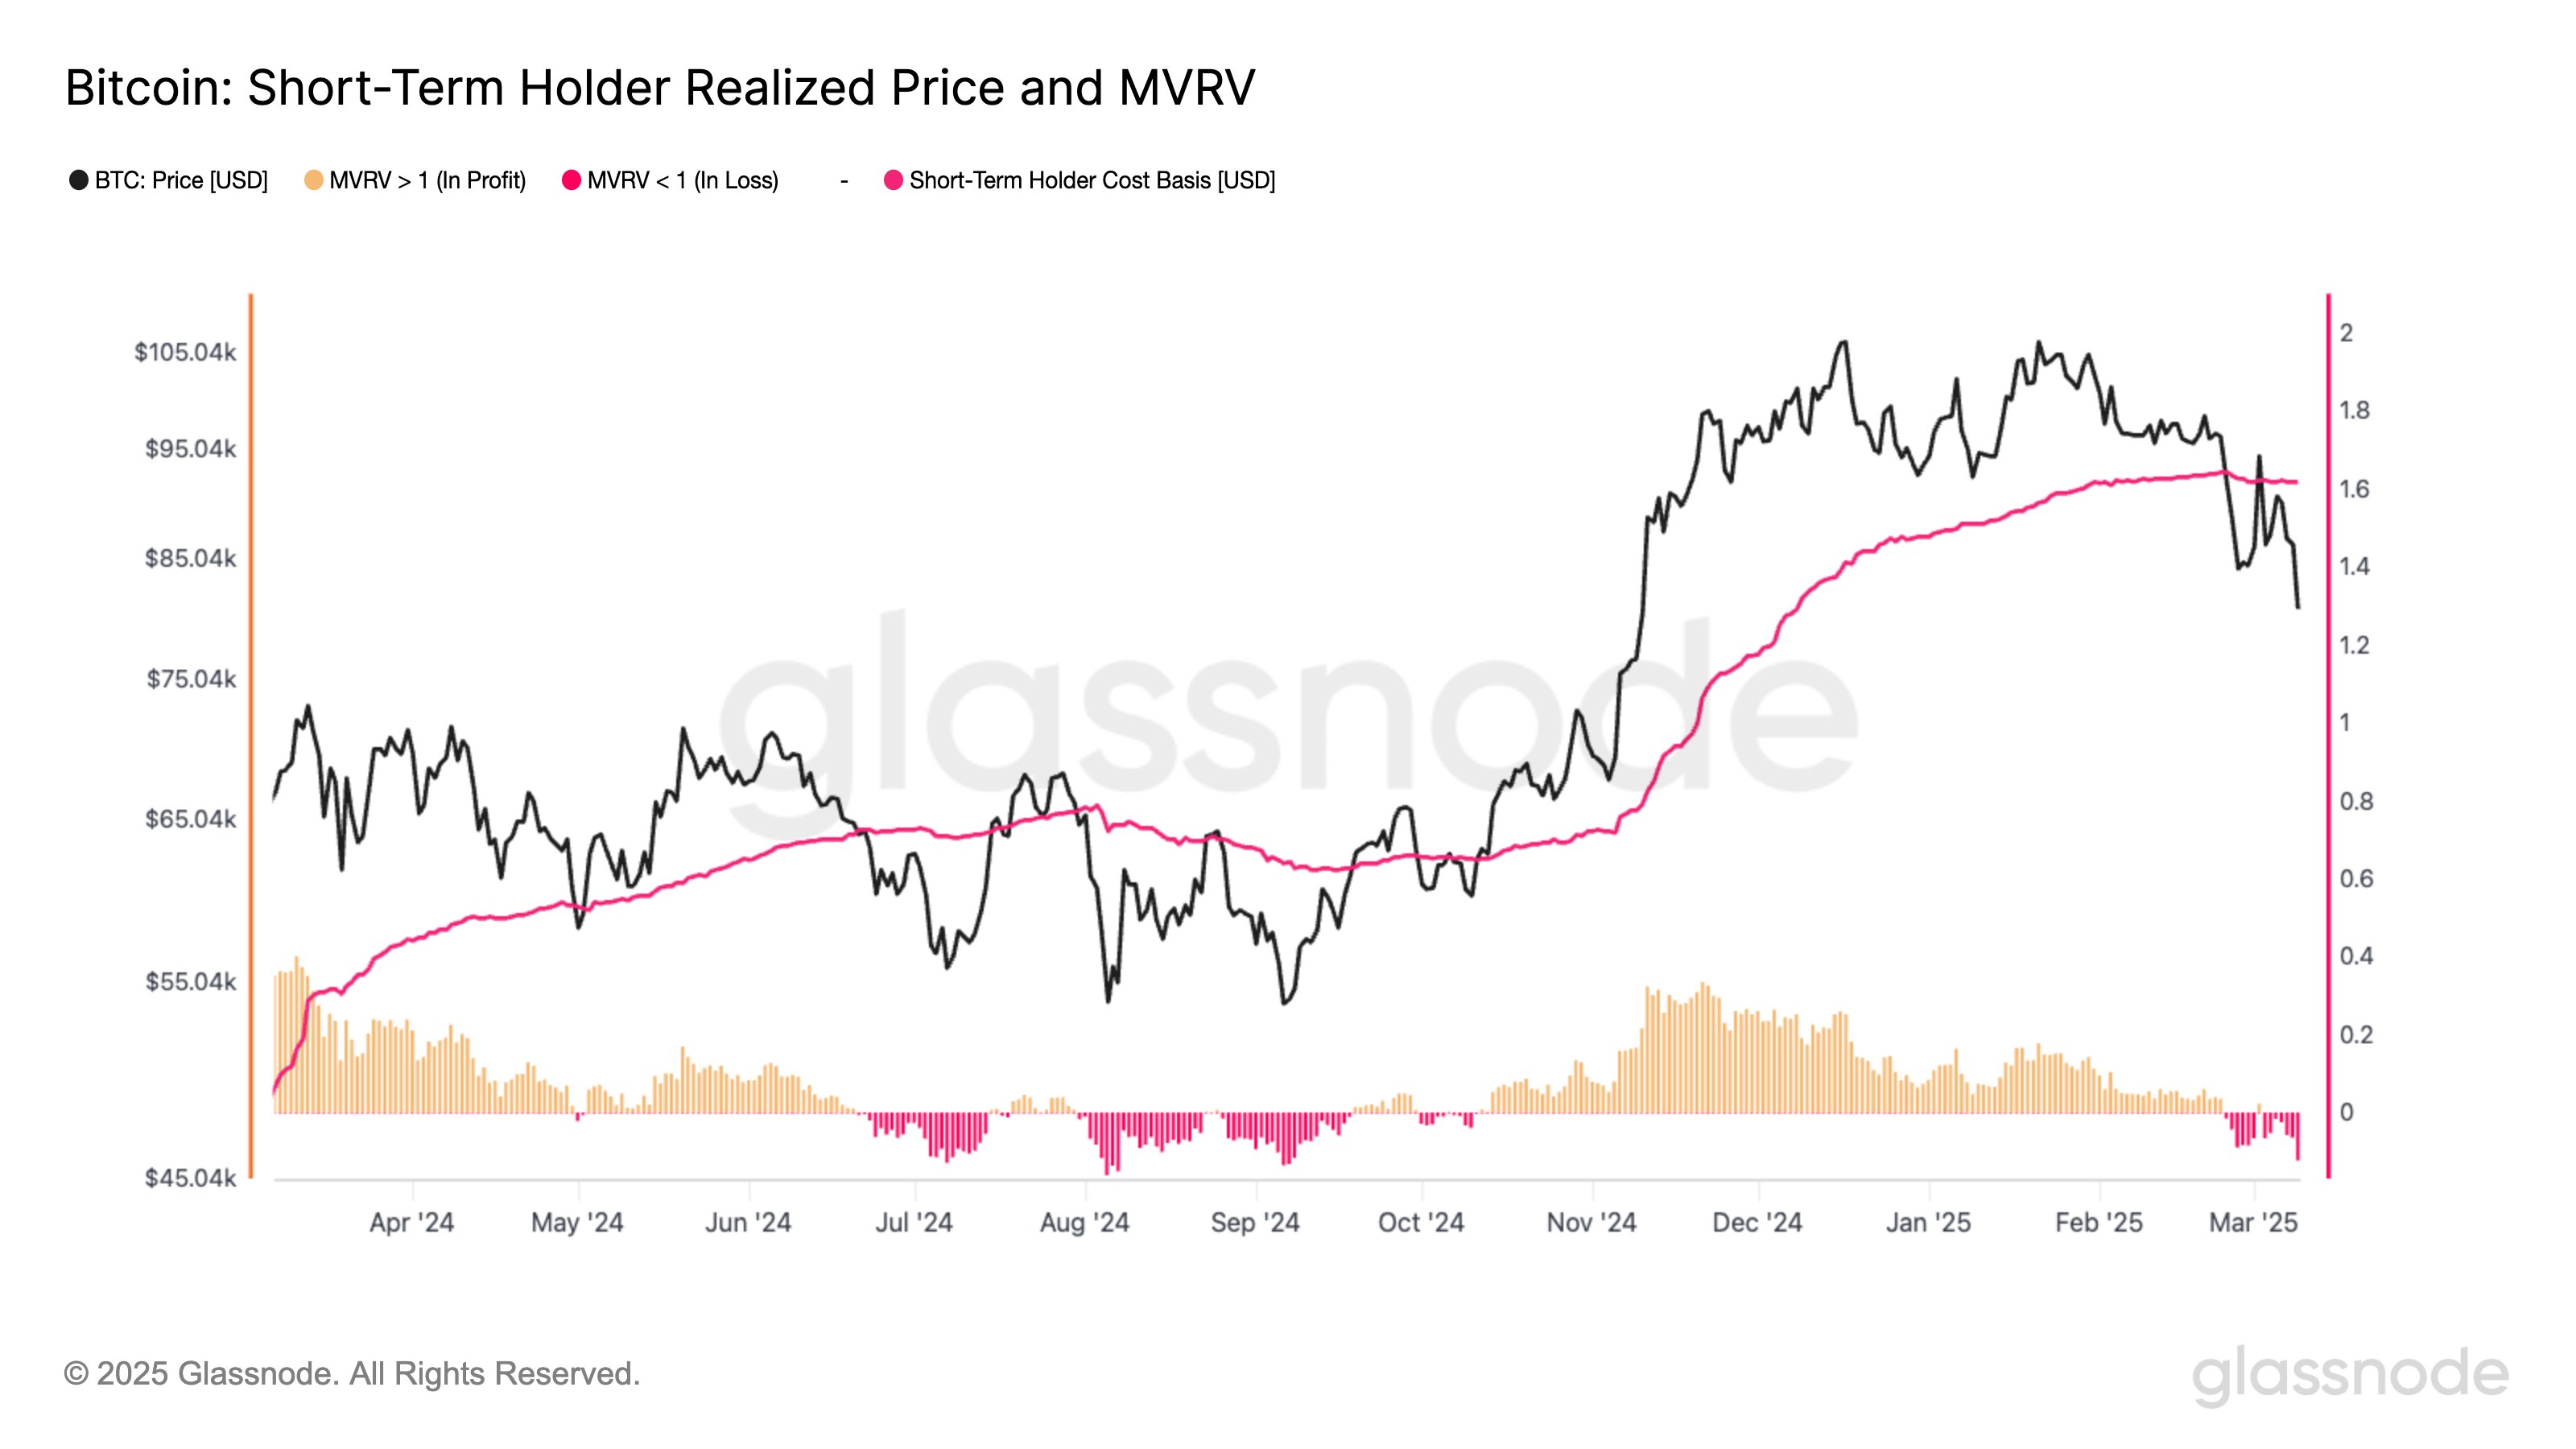
Historically, the Realized Price has played the role of a boundary between bear and bull trends for not just SOL, but also other digital assets. In another X post, Glassnode has shared the data for a version of the indicator for Bitcoin, the number one cryptocurrency.
Bitcoin STH Realized Price

The metric displayed in the chart is the Realized Price of the short-term holders, which only measures the average cost basis of the investors who purchased their coins within the past 155 days. Unlike the Realized Price of the entire network, this version of the indicator serves more like a boundary line for short-term momentum shifts.

After the recent bearish price action across the digital asset sector, Bitcoin has seen its short-term holders fall into the red, which could imply the asset may continue to suffer from a drawdown in the near future.

SOL Price

At the time of writing, Solana is trading around $124, down almost 9% in the last week.

Solana Price Chart
Disclaimer: For information purposes only. Past performance is not indicative of future results.
placeholder
Bitcoin To Face ‘One Last Speed Bump’ Before Rally To $140,000 – AnalystBitcoin (BTC) is attempting to reclaim a crucial level as support, which could propel its price to its local range high.
Author  NewsBTC
7 hours ago
Bitcoin (BTC) is attempting to reclaim a crucial level as support, which could propel its price to its local range high.
placeholder
Australia hands Tesla lifeline with May sales surge, struggles persist elsewhereAustralia just gave Tesla something it hasn’t had in a while—relief. The company said on Tuesday that it sold 3,897 electric vehicles in Australia in May 2025, its best monthly performance in nearly a year, according to data reported by CNBC.
Author  Cryptopolitan
7 hours ago
Australia just gave Tesla something it hasn’t had in a while—relief. The company said on Tuesday that it sold 3,897 electric vehicles in Australia in May 2025, its best monthly performance in nearly a year, according to data reported by CNBC.
placeholder
Bank of England Governor Bailey releases more aggressive monetary policy,Will the British pound continue to rise or turn around and fall?The latest International Monetary Fund (IMF) report, "World Economic Outlook," shows that the UK economy has demonstrated unexpected resilience, leading to an upward revision of the GDP growth forecast for 2025 from 1.1% to 1.2%.
Author  TradingKey
7 hours ago
The latest International Monetary Fund (IMF) report, "World Economic Outlook," shows that the UK economy has demonstrated unexpected resilience, leading to an upward revision of the GDP growth forecast for 2025 from 1.1% to 1.2%.
placeholder
GBP/JPY Price Forecast: Seems poised to build on momentum beyond 195.00 markThe GBP/JPY cross builds on the previous day's goodish rebound from the 192.75-192.70 area, or over a one-week low, and gains positive traction for the second straight day on Wednesday.
Author  FXStreet
7 hours ago
The GBP/JPY cross builds on the previous day's goodish rebound from the 192.75-192.70 area, or over a one-week low, and gains positive traction for the second straight day on Wednesday.
placeholder
USD/CAD Price Forecast: Tests initial support near 1.3950, followed by nine-day EMAThe USD/CAD pair is retracing its recent gains registered in the previous session, trading around 1.3710 during the European hours on Wednesday. The daily chart's technical analysis suggested a persistent bearish sentiment, as the pair consolidates within the descending channel pattern.
Author  FXStreet
7 hours ago
The USD/CAD pair is retracing its recent gains registered in the previous session, trading around 1.3710 during the European hours on Wednesday. The daily chart's technical analysis suggested a persistent bearish sentiment, as the pair consolidates within the descending channel pattern.
goTop
quote