TRON price rallies to yearly high following burn of over $12.6 million tokens

Source Fxstreet
  • TRON fee revenue reached an all-time high of $1.758 million on February 20. 
  • TRON network burned over 12.62 million tokens on Tuesday, likely catalyzing the altcoin’s gains. 
  • TRON price hit a 2024 peak of $0.14048 on Wednesday and the altcoin is likely to rally higher. 

Justin Sun’s TRON network recently burned large volumes of the token. TRON price rallied to a multi-year high of $0.14048 on Wednesday, with two catalysts as likely drivers of the asset’s gains: TRON’s roadmap to integrate ecosystem assets with the Bitcoin blockchain and the burn of the project’s tokens this week. 

Also read: TRON announces plans to venture into Ordinals and Bitcoin Layer 2 solutions

Catalysts support TRON’s recent gains

Data from TradingView shows that TRON price hit a multi-year high of $0.14048 on Wednesday. The next key level for the token is its May 2021 peak of $0.17. The network’s revenue reached an all-time high above $1.757 million on February 20, according to Tronscan data. 

TRON

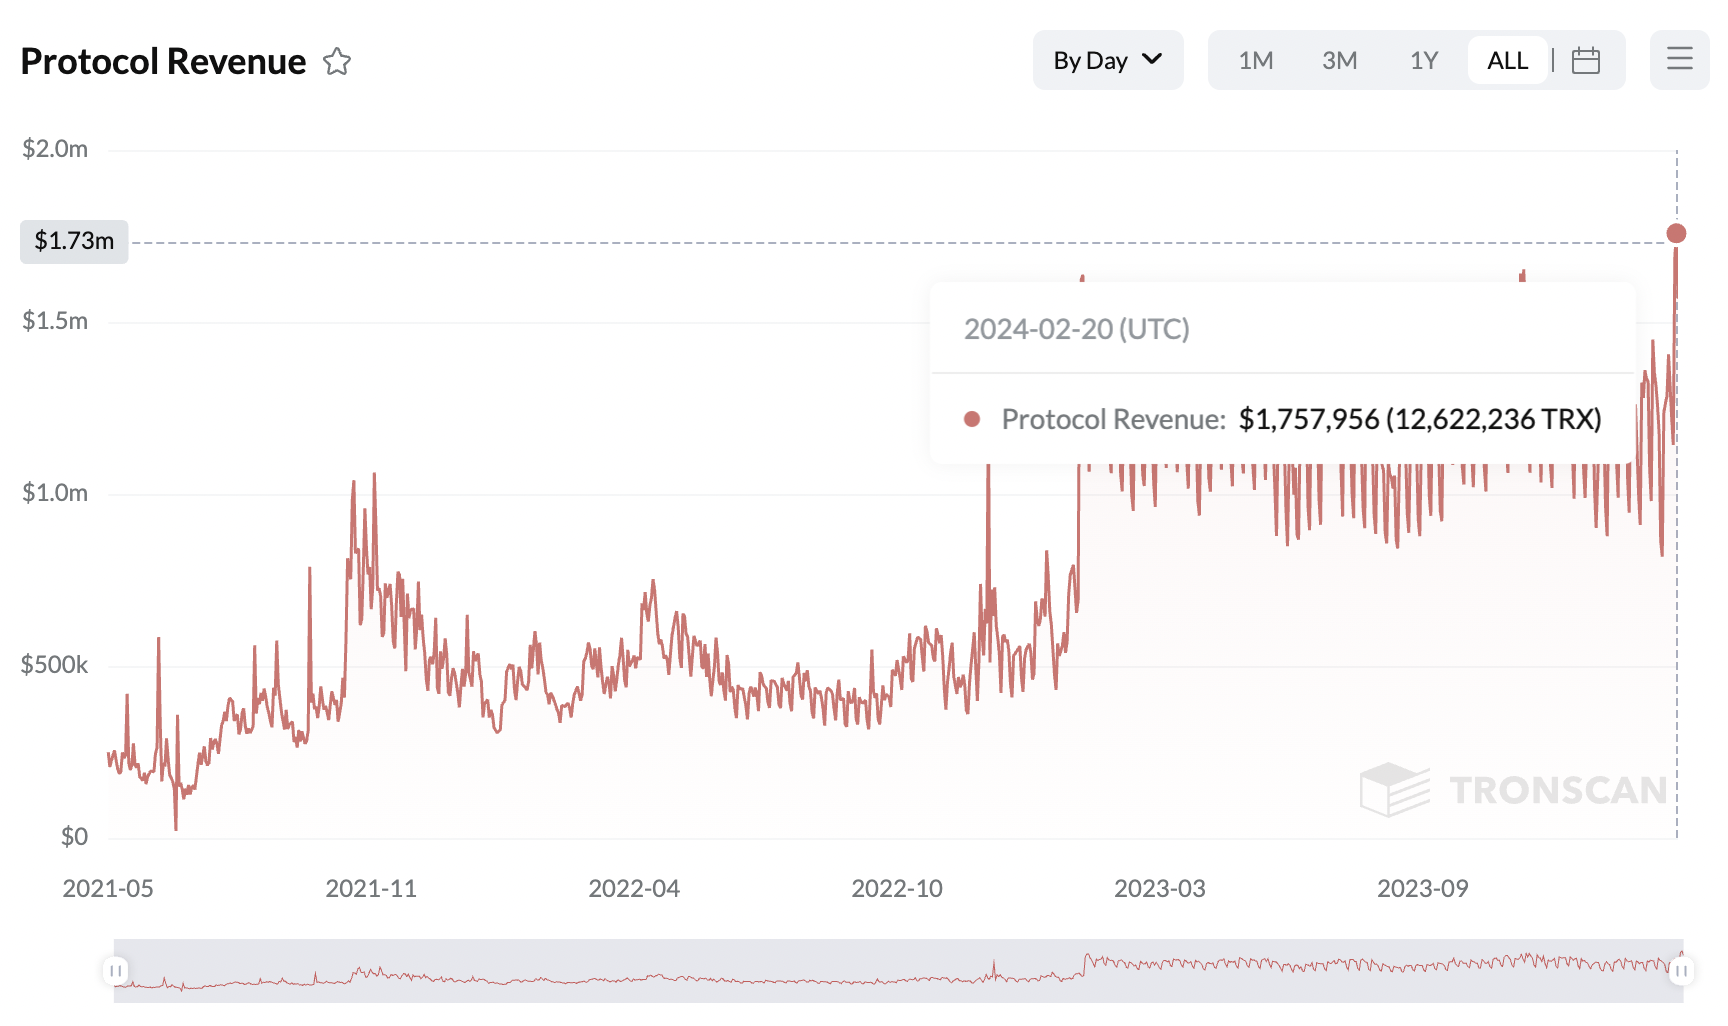
TRON Protocol Revenue. Source: Tronscan 

This marks an important milestone for TRON. The network burned a total of 12,622,236 TRX tokens on Tuesday as the protocol burns the fees charged on a daily basis. TRON price is $0.13998 at the time of writing. The token is close to its multi-year high on Thursday. 

Additionally, Justin Sun’s recent announcement of TRON’s roadmap supports the altcoin’s gains. Sun explained how TRON network assets will integrate with the Bitcoin blockchain and how the project will venture into Ordinals and Bitcoin Layer 2 solutions. 

These two catalysts support TRON price rally. 

TRON price could climb higher

TRON is currently in an uptrend. The altcoin’s target is the May 2021 peak of $0.17. In the event of a correction, TRON could find support at the 23.6%, 38.2% or 50% Fibonacci retracement of TRON’s climb to its 2024 peak, at $0.13124, $0.12552 or $0.12090 respectively. 

The green bars on the Moving Average Convergence Divergence (MACD) indicator suggest that there is positive momentum. TRON price could resume its rally post the brief correction on Thursday. 

TRON

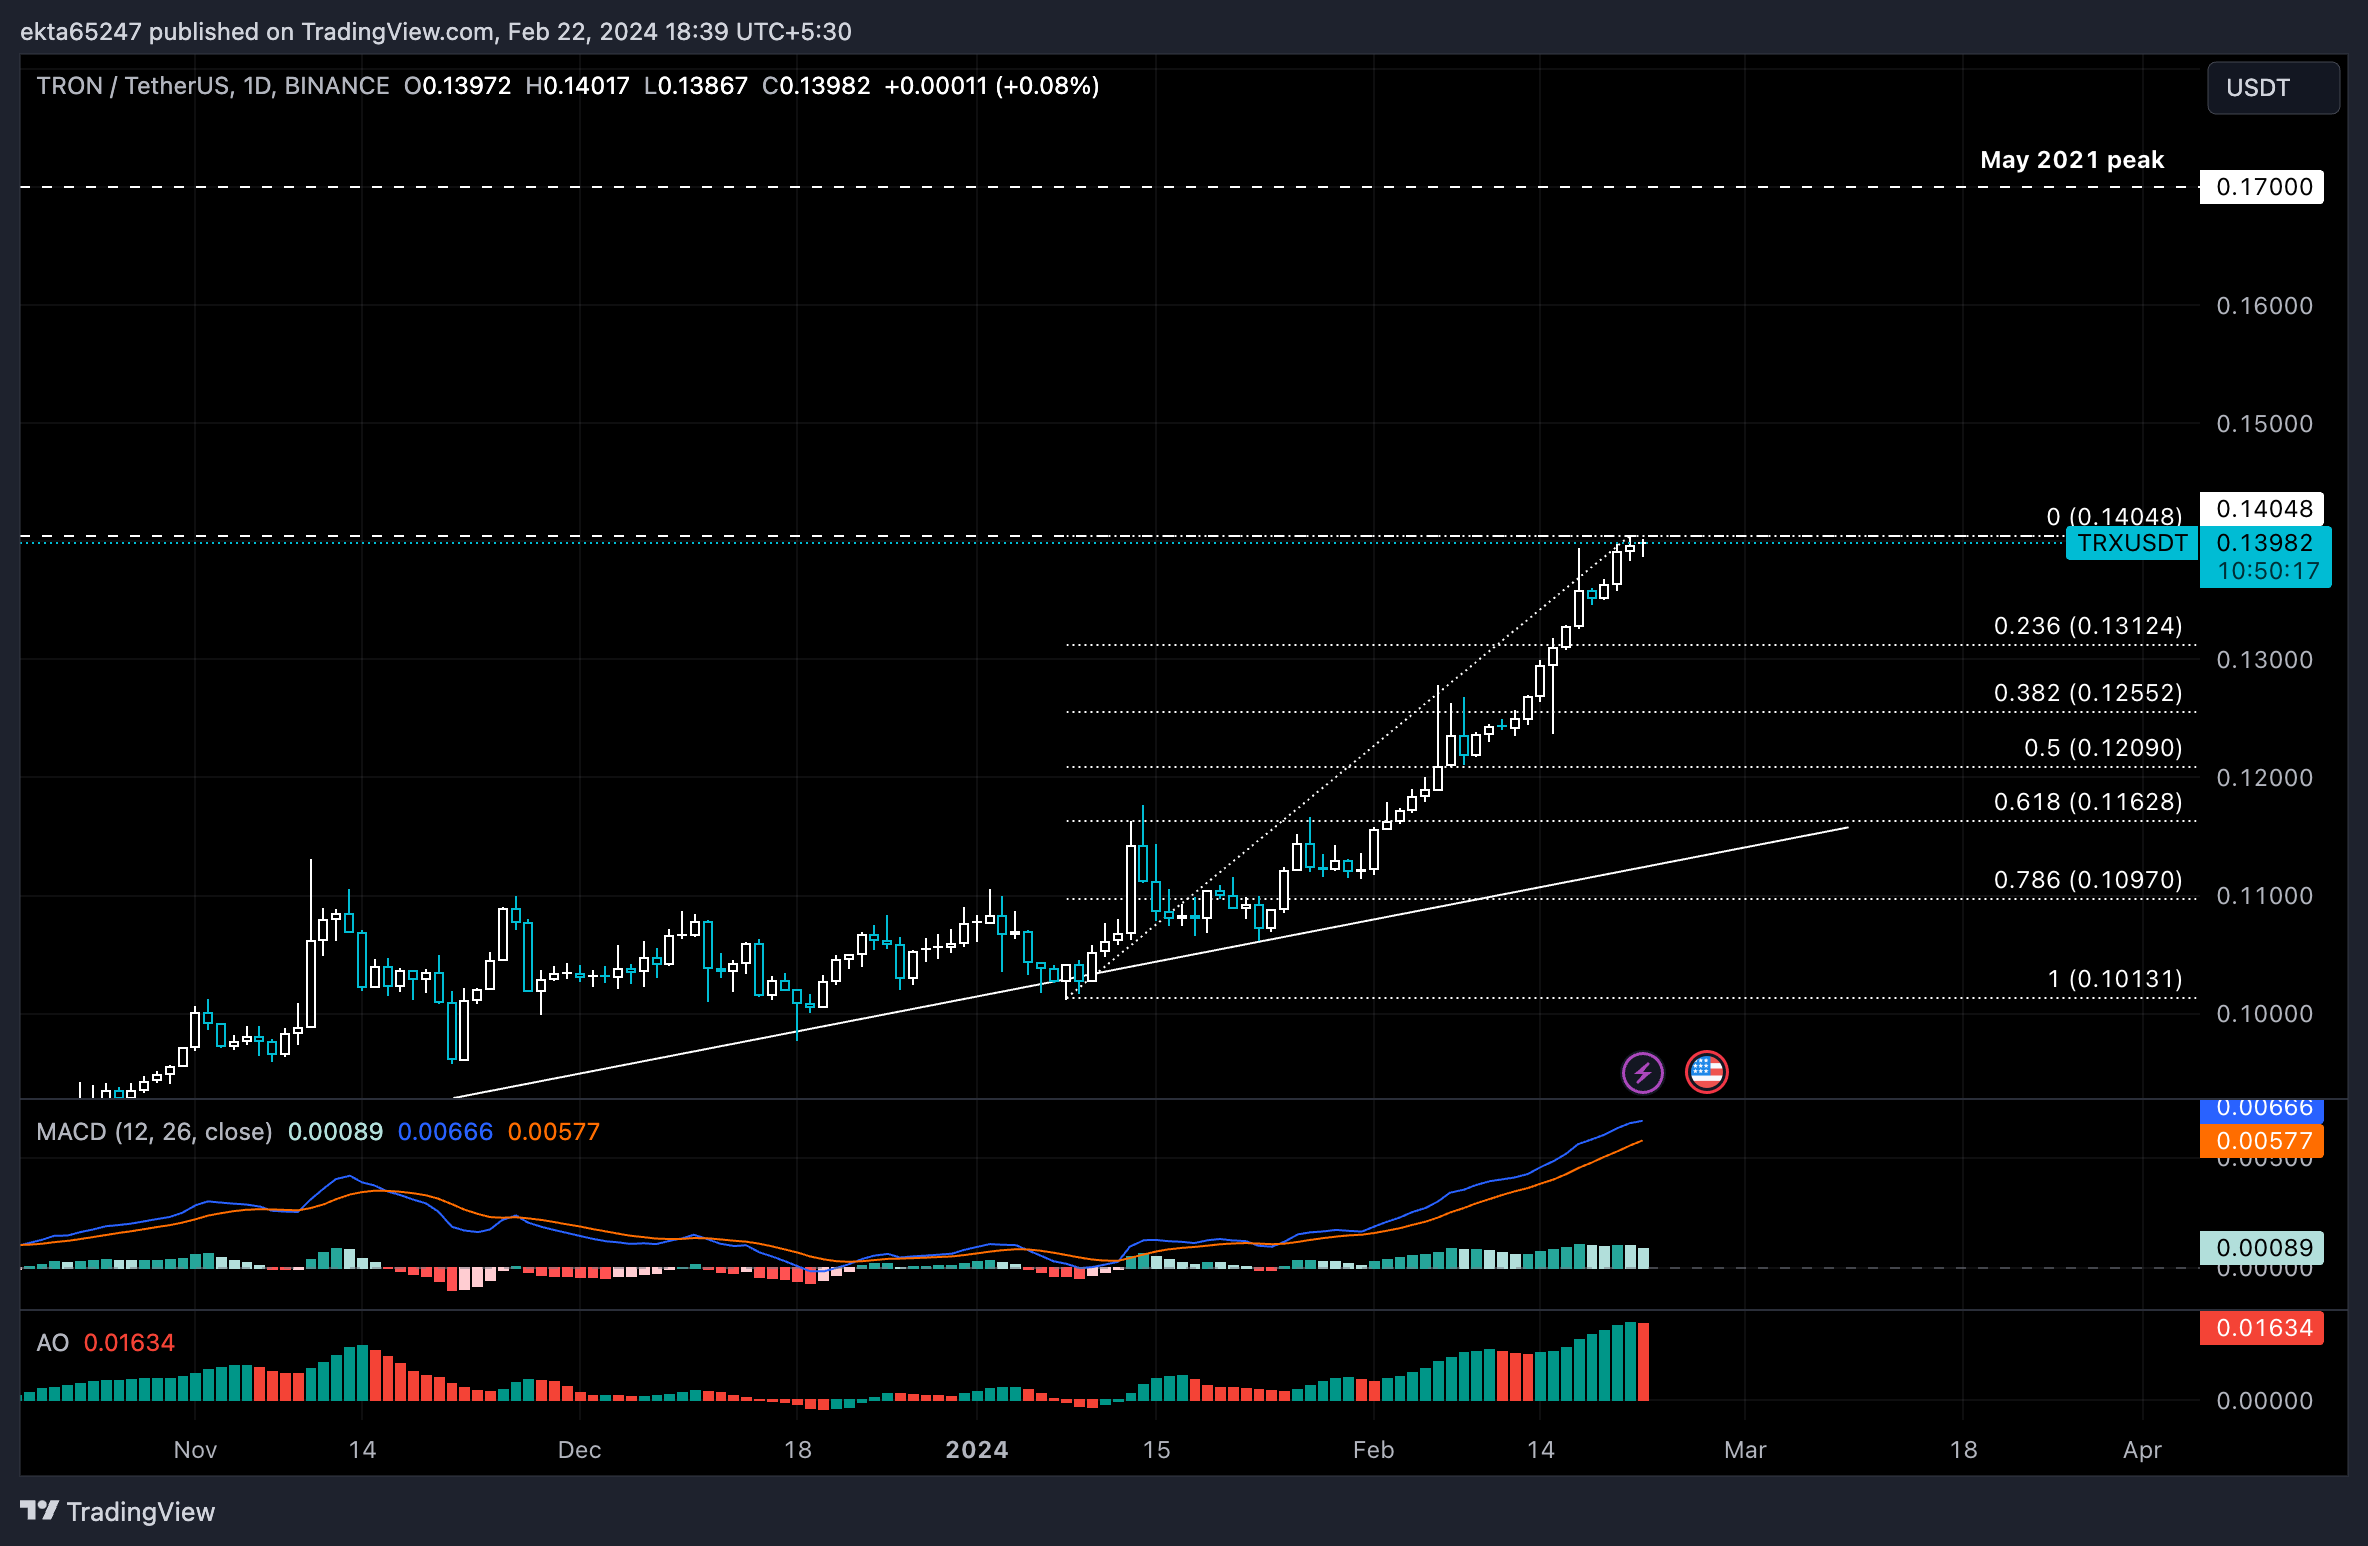
TRON/USDT 1-day chart 

A daily candlestick close below the 23.6% Fib retracement at $0.13124 could invalidate the bullish thesis. A correction could push TRON to its January low of $0.10131. 

Disclaimer: For information purposes only. Past performance is not indicative of future results.
placeholder
Natural Gas sinks to pivotal level as China’s demand slumpsNatural Gas price (XNG/USD) edges lower and sinks to $2.56 on Monday, extending its losing streak for the fifth day in a row. The move comes on the back of China cutting its Liquified Natural Gas (LNG) imports after prices rose above $3.0 in June. It
Author  FXStreet
Jul 01, 2024
Natural Gas price (XNG/USD) edges lower and sinks to $2.56 on Monday, extending its losing streak for the fifth day in a row. The move comes on the back of China cutting its Liquified Natural Gas (LNG) imports after prices rose above $3.0 in June. It
placeholder
The dollar weakened, equities dipped, and gold hit record highsThe dollar weakened, equities fell, and gold set new records on Wednesday as investors waited for a Fed rate cut later in the day.
Author  Cryptopolitan
Sep 17, 2025
The dollar weakened, equities fell, and gold set new records on Wednesday as investors waited for a Fed rate cut later in the day.
placeholder
ECB Policy Outlook for 2026: What It Could Mean for the Euro’s Next MoveWith the ECB likely holding rates steady at 2.15% and the Fed potentially extending cuts into 2026, EUR/USD may test 1.20 if Eurozone growth proves resilient, but weaker growth and an ECB pivot could pull the pair back toward 1.13 and potentially 1.10.
Author  Mitrade
Dec 26, 2025
With the ECB likely holding rates steady at 2.15% and the Fed potentially extending cuts into 2026, EUR/USD may test 1.20 if Eurozone growth proves resilient, but weaker growth and an ECB pivot could pull the pair back toward 1.13 and potentially 1.10.
placeholder
Gold falls below $4,850 as Fed holds rates steadyGold price (XAU/USD) faces some selling pressure near $4,830 during the early Asian session on Thursday.
Author  FXStreet
Mar 19, Thu
Gold price (XAU/USD) faces some selling pressure near $4,830 during the early Asian session on Thursday.
placeholder
Gold tumbles below $4,650 as inflation fears and liquidity squeeze weighGold price (XAU/USD) remains under selling pressure near $4,640 during the early Asian session on Friday. The precious metal extends the decline as soaring crude oil and energy prices, driven by the escalating US-Israeli war with Iran, reignite inflation fears.
Author  FXStreet
23 hours ago
Gold price (XAU/USD) remains under selling pressure near $4,640 during the early Asian session on Friday. The precious metal extends the decline as soaring crude oil and energy prices, driven by the escalating US-Israeli war with Iran, reignite inflation fears.
Related Instrument
goTop
quote