

Polygon inflation ends, MATIC price primed for explosive growth?

Source Fxstreet
  • Polygon’s vesting contract released 273 million MATIC tokens on Wednesday.
  • The unlock marks the end of inflation for holders, opening up unlimited upside potential for MATIC price. 
  • The lackluster performance of MATIC price thus far is likely to end, kick-starting an uptrend for Polygon.

Polygon’s Foundation contract shelled out the last remaining 273 million MATIC tokens on Wednesday, marking the end of the vesting period. This development means that there are no more tokens to unlock i.,e all of the MATIC tokens ever minted are now in circulation.

Also read: Polygon unveils AggLayer: A solution to long-standing Ethereum Layer 2 challenges

MATIC Unlock Ends Inflation Forever

According to Etherscan, Polygon’s vesting contract ended roughly 15 hours ago as it spits out the last 273 million MATIC tokens worth $253 million at the time of writing. 
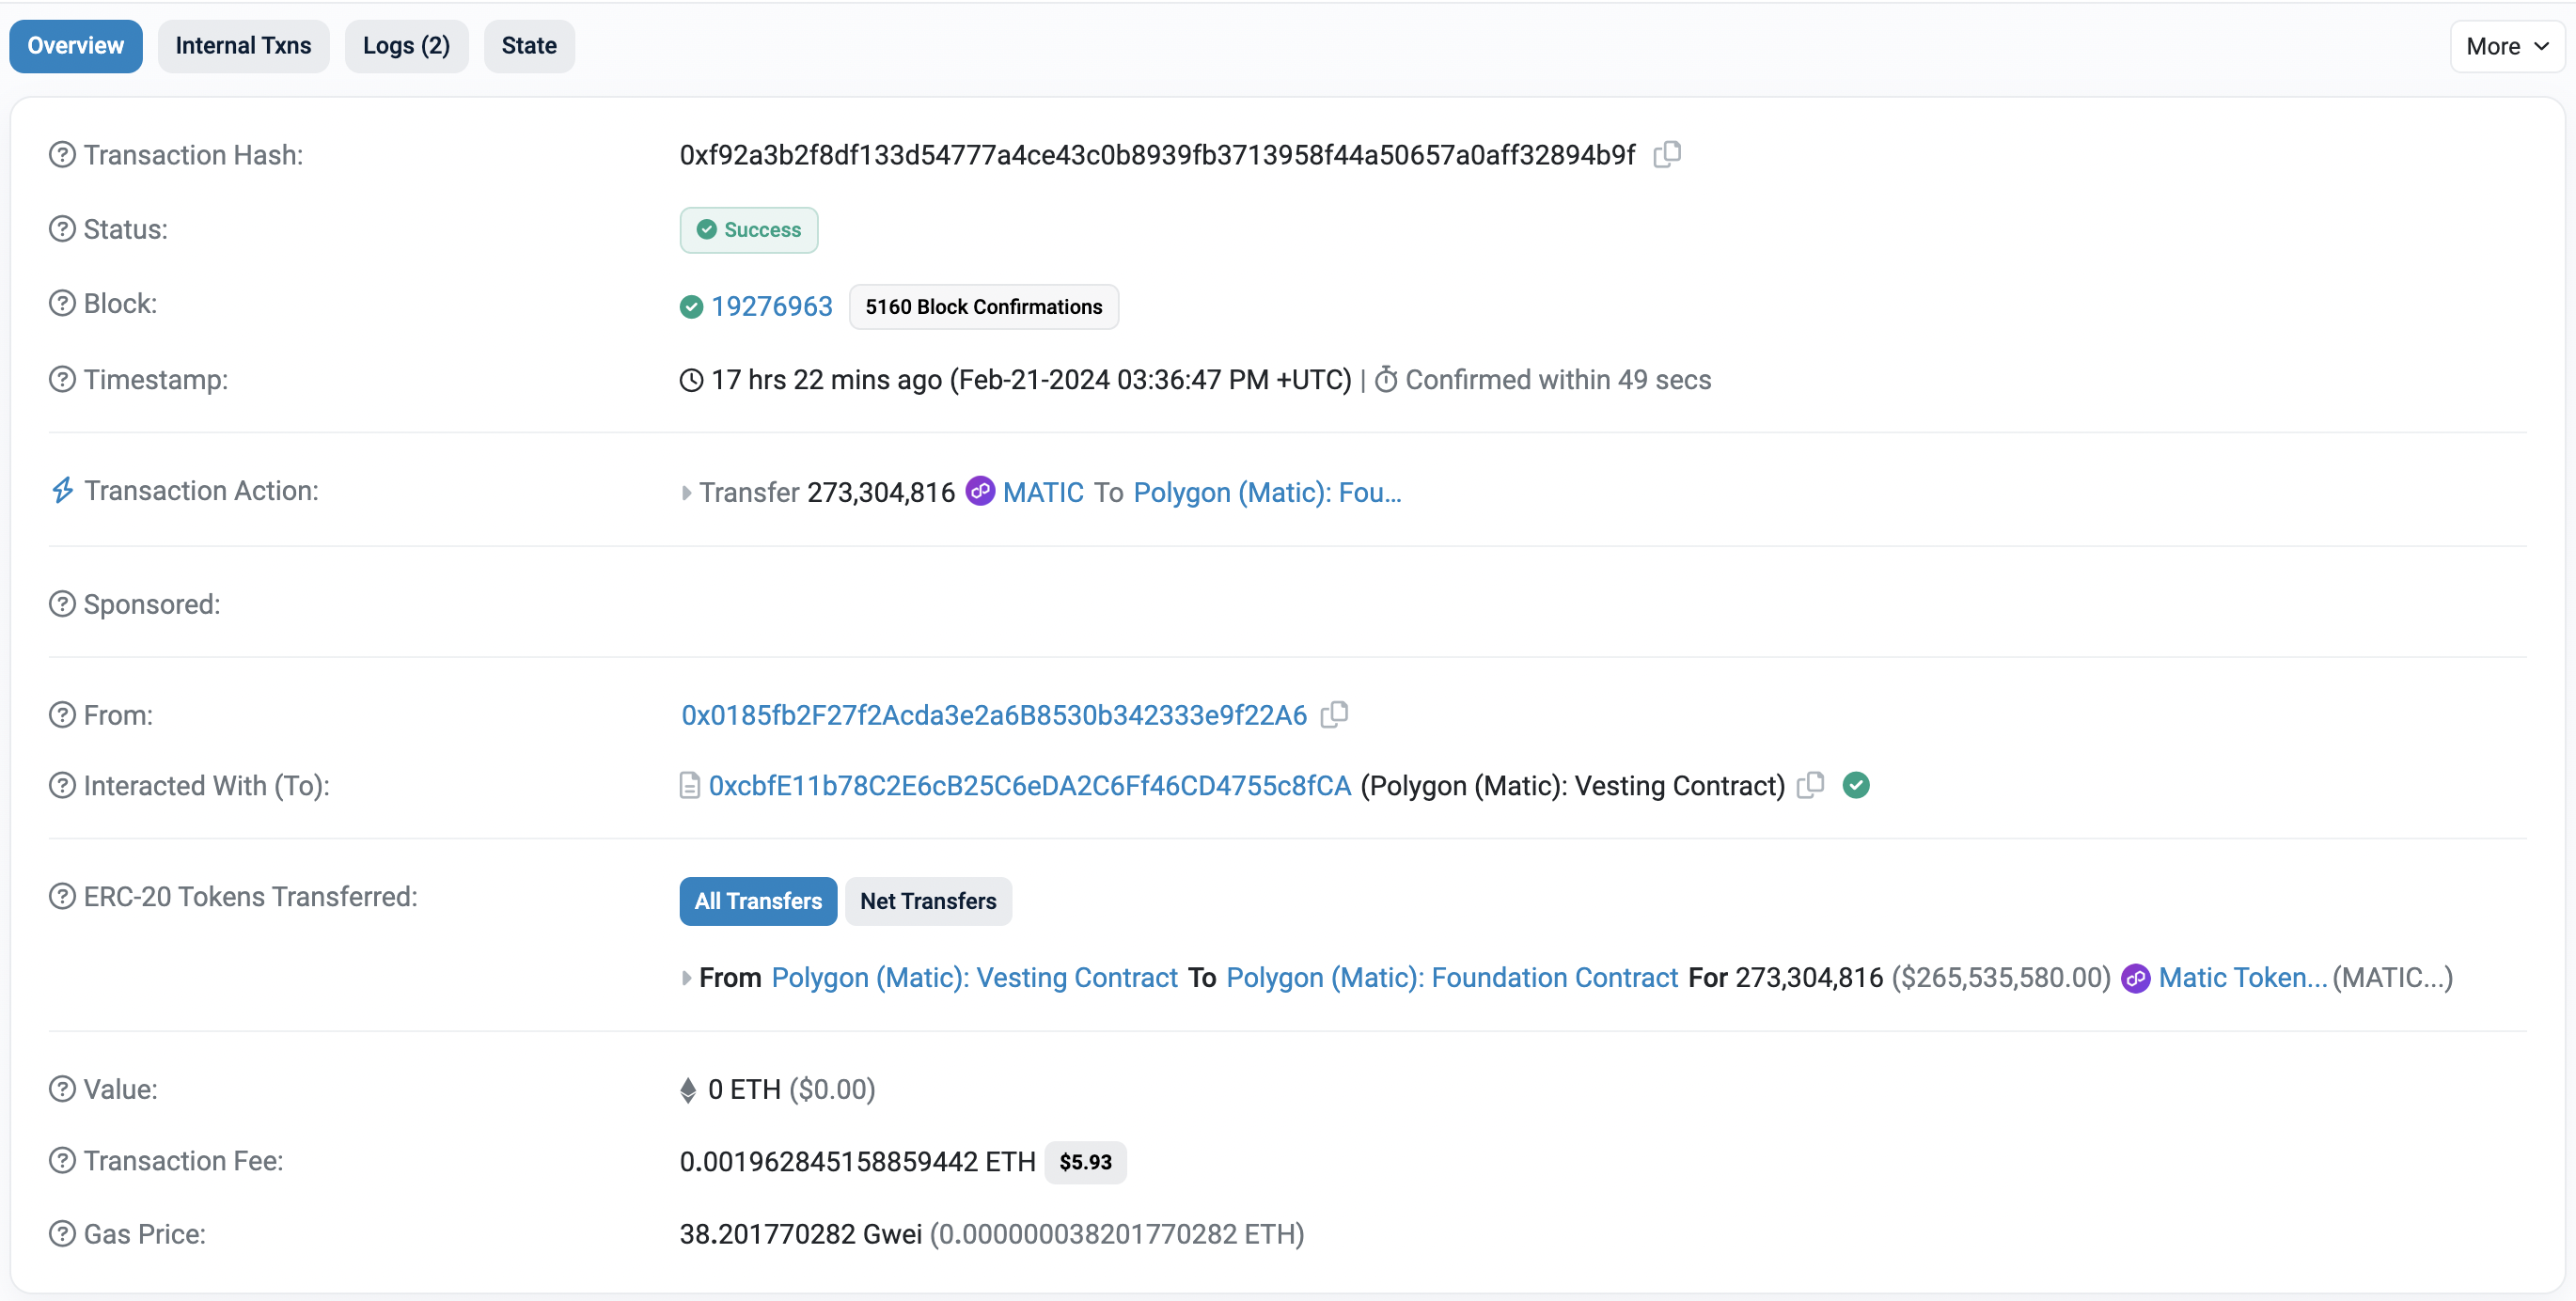
Etherscan: Polygon Vesting Contract Transaction Hash

Etherscan: Polygon Vesting Contract Transaction Hash

Based on Coingecko data, MATIC is the 15th largest cryptocurrency by market capitalization and has 9.28 billion in circulating supply. Polygon price currently trades around $0.947, just above the $0.942 weekly support level. A bounce off this barrier could see a massive upswing in the near future for MATIC.

Also read: MATIC price maintains positive outlook, Humanity Protocol launches on Polygon CDK

Polygon price eyes near-30% rally

Polygon price has set up two critical lower highs in the last 700 days, but the swing lows are stabilizing, indicating a potential bottom formation and squeezing. As MATIC bounced off the $0.782 weekly barrier, it produced a three-day and weekly close above the immediate resistance level at $0.942. This bullish development could extend into a full-blown rally for MATIC if the $0.942 level holds.

In such a case, Polygon price could see a near-30% rally that retests the declining trendline connecting the aforementioned lower highs and the horizontal daily resistance level at $1.22. 
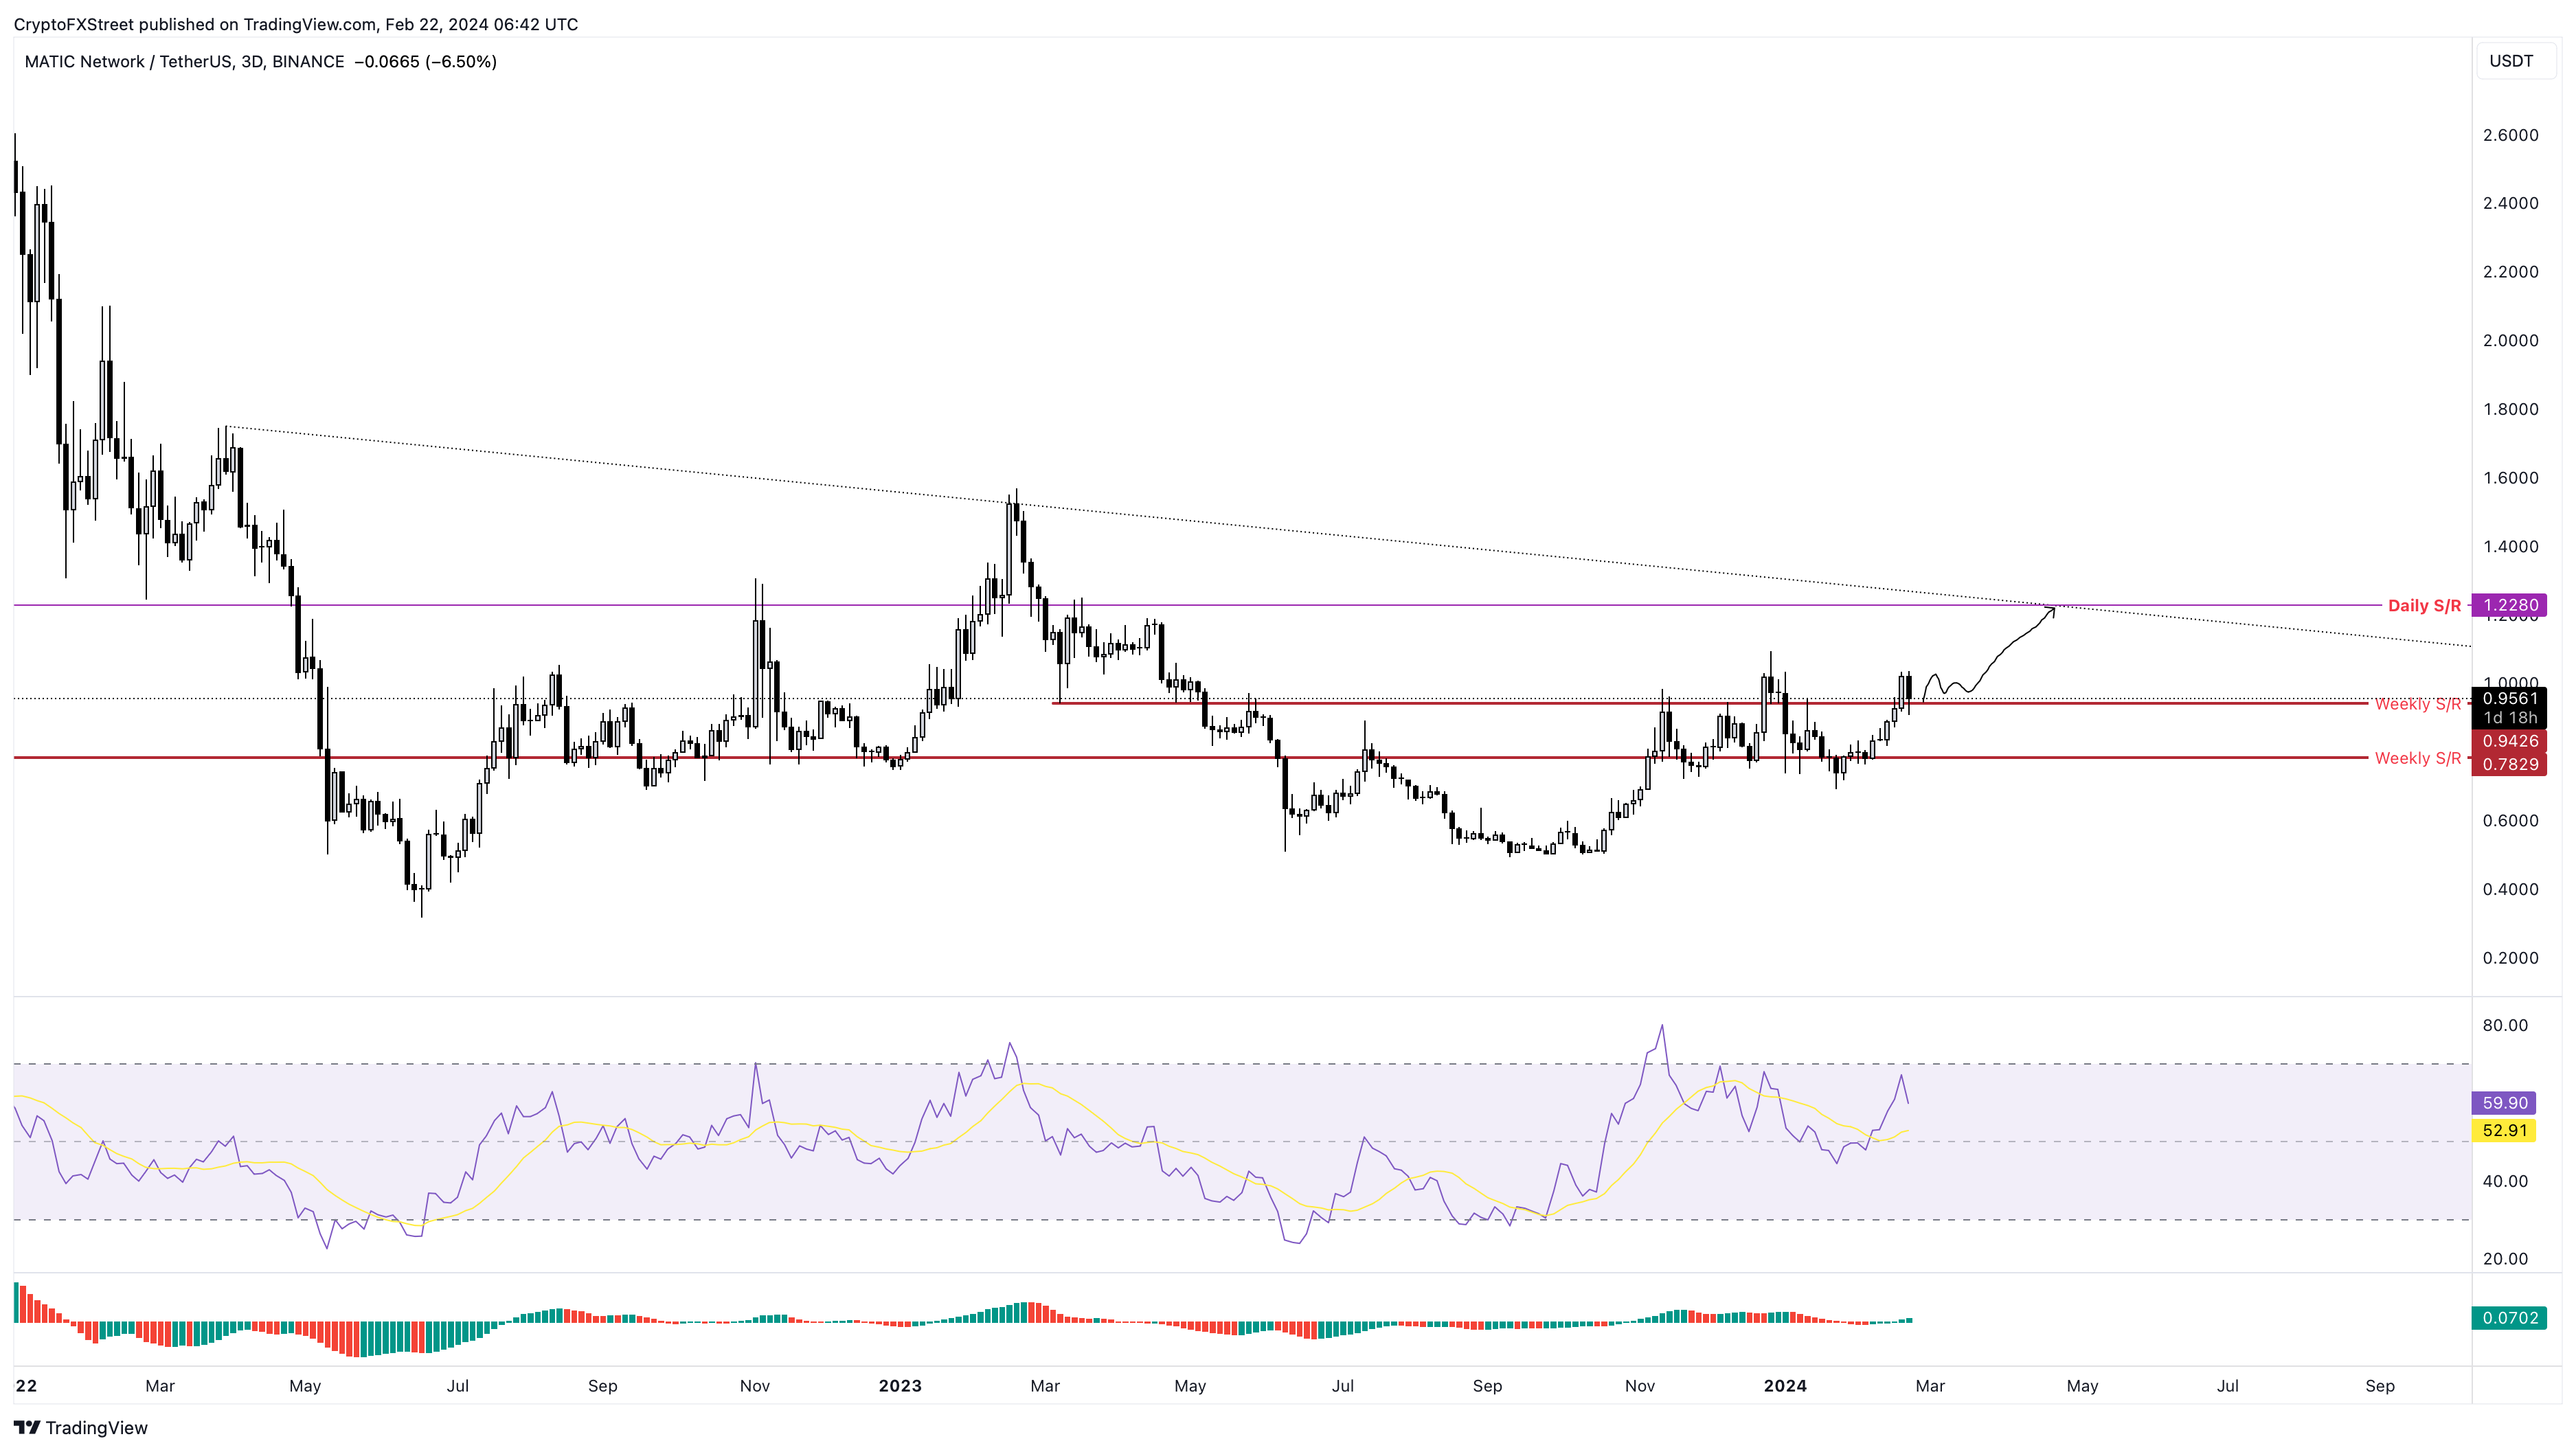
MATIC/USDT 3-day chart

MATIC/USDT 3-day chart

On the other hand, a breakdown of $0.942 could send MATIC price crashing by 15% to $0.782. A decisive flip of this level will invalidate the bullish thesis and potentially trigger a 11% crash to sweep the January 22 swing low at $0.691. 

Also read: Uniswap launches v2 on Arbitrum, Polygon, Optimism, Base, Binance Smart Chain and Avalanche

Disclaimer: For information purposes only. Past performance is not indicative of future results.
placeholder
The Fed will sit still on October 28 — but 100 of 100 economists now expect a December hikeA Reuters poll run October 16-20 found 94 of 100 economists expecting the Fed to hold at 3.75-4.00% on October 28 — and all 100 expecting a hike in December, against less than half a month earlier. The market is close to the same price, with CME FedWatch at roughly 17% for October and 82.8% for December. With the Fed in blackout since October 17, here are the five dates that decide the rest of the year, what each one is priced for, and the two directions each can take.
Author  Irene Q.
Oct 22, Thu
A Reuters poll run October 16-20 found 94 of 100 economists expecting the Fed to hold at 3.75-4.00% on October 28 — and all 100 expecting a hike in December, against less than half a month earlier. The market is close to the same price, with CME FedWatch at roughly 17% for October and 82.8% for December. With the Fed in blackout since October 17, here are the five dates that decide the rest of the year, what each one is priced for, and the two directions each can take.
placeholder
Nasdaq closes at 26,008.86 — 8.9 points above 26,000, and the credit market never blinkedThe Nasdaq Composite fell 2.60% to 26,008.86 on October 22, its worst session since June, as Meta sank 6.98% on 2026 capex guidance of $135–145 billion. But the equal-weight S&P 500 rose 0.73%, high-yield credit was flat and 10-year yields fell 20 basis points. This was an AI de-rating, not a risk-off event — here is the transmission chain, the 29,000 / 28,200 levels and what would prove it wrong.
Author  Irene Q.
Oct 23, Fri
The Nasdaq Composite fell 2.60% to 26,008.86 on October 22, its worst session since June, as Meta sank 6.98% on 2026 capex guidance of $135–145 billion. But the equal-weight S&P 500 rose 0.73%, high-yield credit was flat and 10-year yields fell 20 basis points. This was an AI de-rating, not a risk-off event — here is the transmission chain, the 29,000 / 28,200 levels and what would prove it wrong.
placeholder
Brent tops $113 on Saudi supply risk — but the diesel line in the EIA report is the tellBrent's December contract settled at $113.17 on October 22, up 4.00% and the highest close since May 4, after Saudi Arabia restricted refined-product shipments. The same session's EIA report showed crude stocks down 3.06 million barrels and gasoline down 2.95 million — but distillates built 1.68 million. That single line decides whether $113 holds: here are the data, the 108.8 / 114.0 / 119.3 levels and the two scenarios.
Author  Irene Q.
Oct 23, Fri
Brent's December contract settled at $113.17 on October 22, up 4.00% and the highest close since May 4, after Saudi Arabia restricted refined-product shipments. The same session's EIA report showed crude stocks down 3.06 million barrels and gasoline down 2.95 million — but distillates built 1.68 million. That single line decides whether $113 holds: here are the data, the 108.8 / 114.0 / 119.3 levels and the two scenarios.
placeholder
Gold Price Analysis Today | Forex Gold Analysis | XAU/USD Analysis - October 26, 2026Get the latest gold price analysis, forex gold insights, and XAU/USD analysis for October 26, 2026. Read on for the details.
Author  Mitrade
8 hours ago
Get the latest gold price analysis, forex gold insights, and XAU/USD analysis for October 26, 2026. Read on for the details.
placeholder
Gold breaks $4,000 as oil becomes the inflation problem — $3,943 is the line that mattersSpot gold closed at $3,995.6 on October 23, down about 4.1% for the week and at its lowest since mid-July, and traded near $3,988 on October 26 even as Brent crude settled at $116.72 and Middle East supply risk stayed elevated. The war premium stopped working because oil is now the inflation trade: December Fed hike odds are 68.9% and the 10-year yield is 4.988%. Here are the three numbers, the transmission chain, and the July low at $3,943 that decides whether this is a bottom or a bigger correction.
Author  Irene Q.
3 hours ago
Spot gold closed at $3,995.6 on October 23, down about 4.1% for the week and at its lowest since mid-July, and traded near $3,988 on October 26 even as Brent crude settled at $116.72 and Middle East supply risk stayed elevated. The war premium stopped working because oil is now the inflation trade: December Fed hike odds are 68.9% and the 10-year yield is 4.988%. Here are the three numbers, the transmission chain, and the July low at $3,943 that decides whether this is a bottom or a bigger correction.
goTop
quote