


Bitcoin (BTC) Price Consolidates Below $100,000 as Whales Await Clear Direction
Bitcoin (BTC) price has been trading below $100,000 for the past two weeks, with technical indicators showing a battle between bulls and bears. Despite attempts at recovery, BTC remains in a consolidation phase, with key resistance levels preventing a breakout.
Meanwhile, the number of Bitcoin whales has increased slightly, signaling some accumulation, but remains far below the peaks seen in December and January. Whether BTC can reclaim its bullish momentum or continue facing downward pressure will depend on how it reacts to crucial support and resistance levels in the coming days.
Bitcoin Ichimoku Cloud Shows a Consolidation Phase
The Ichimoku Cloud BTC chart reflects a period of consolidation, with price action moving inside the cloud. This suggests market indecision, as the cloud itself acts as a zone of equilibrium where neither bulls nor bears have full control.
The conversion line (blue) remains flat, indicating weak short-term momentum, while the baseline (red) is slightly above the price, reinforcing resistance.
The cloud ahead is thin and mixed, showing no clear trend dominance, which means volatility could increase once a breakout occurs.
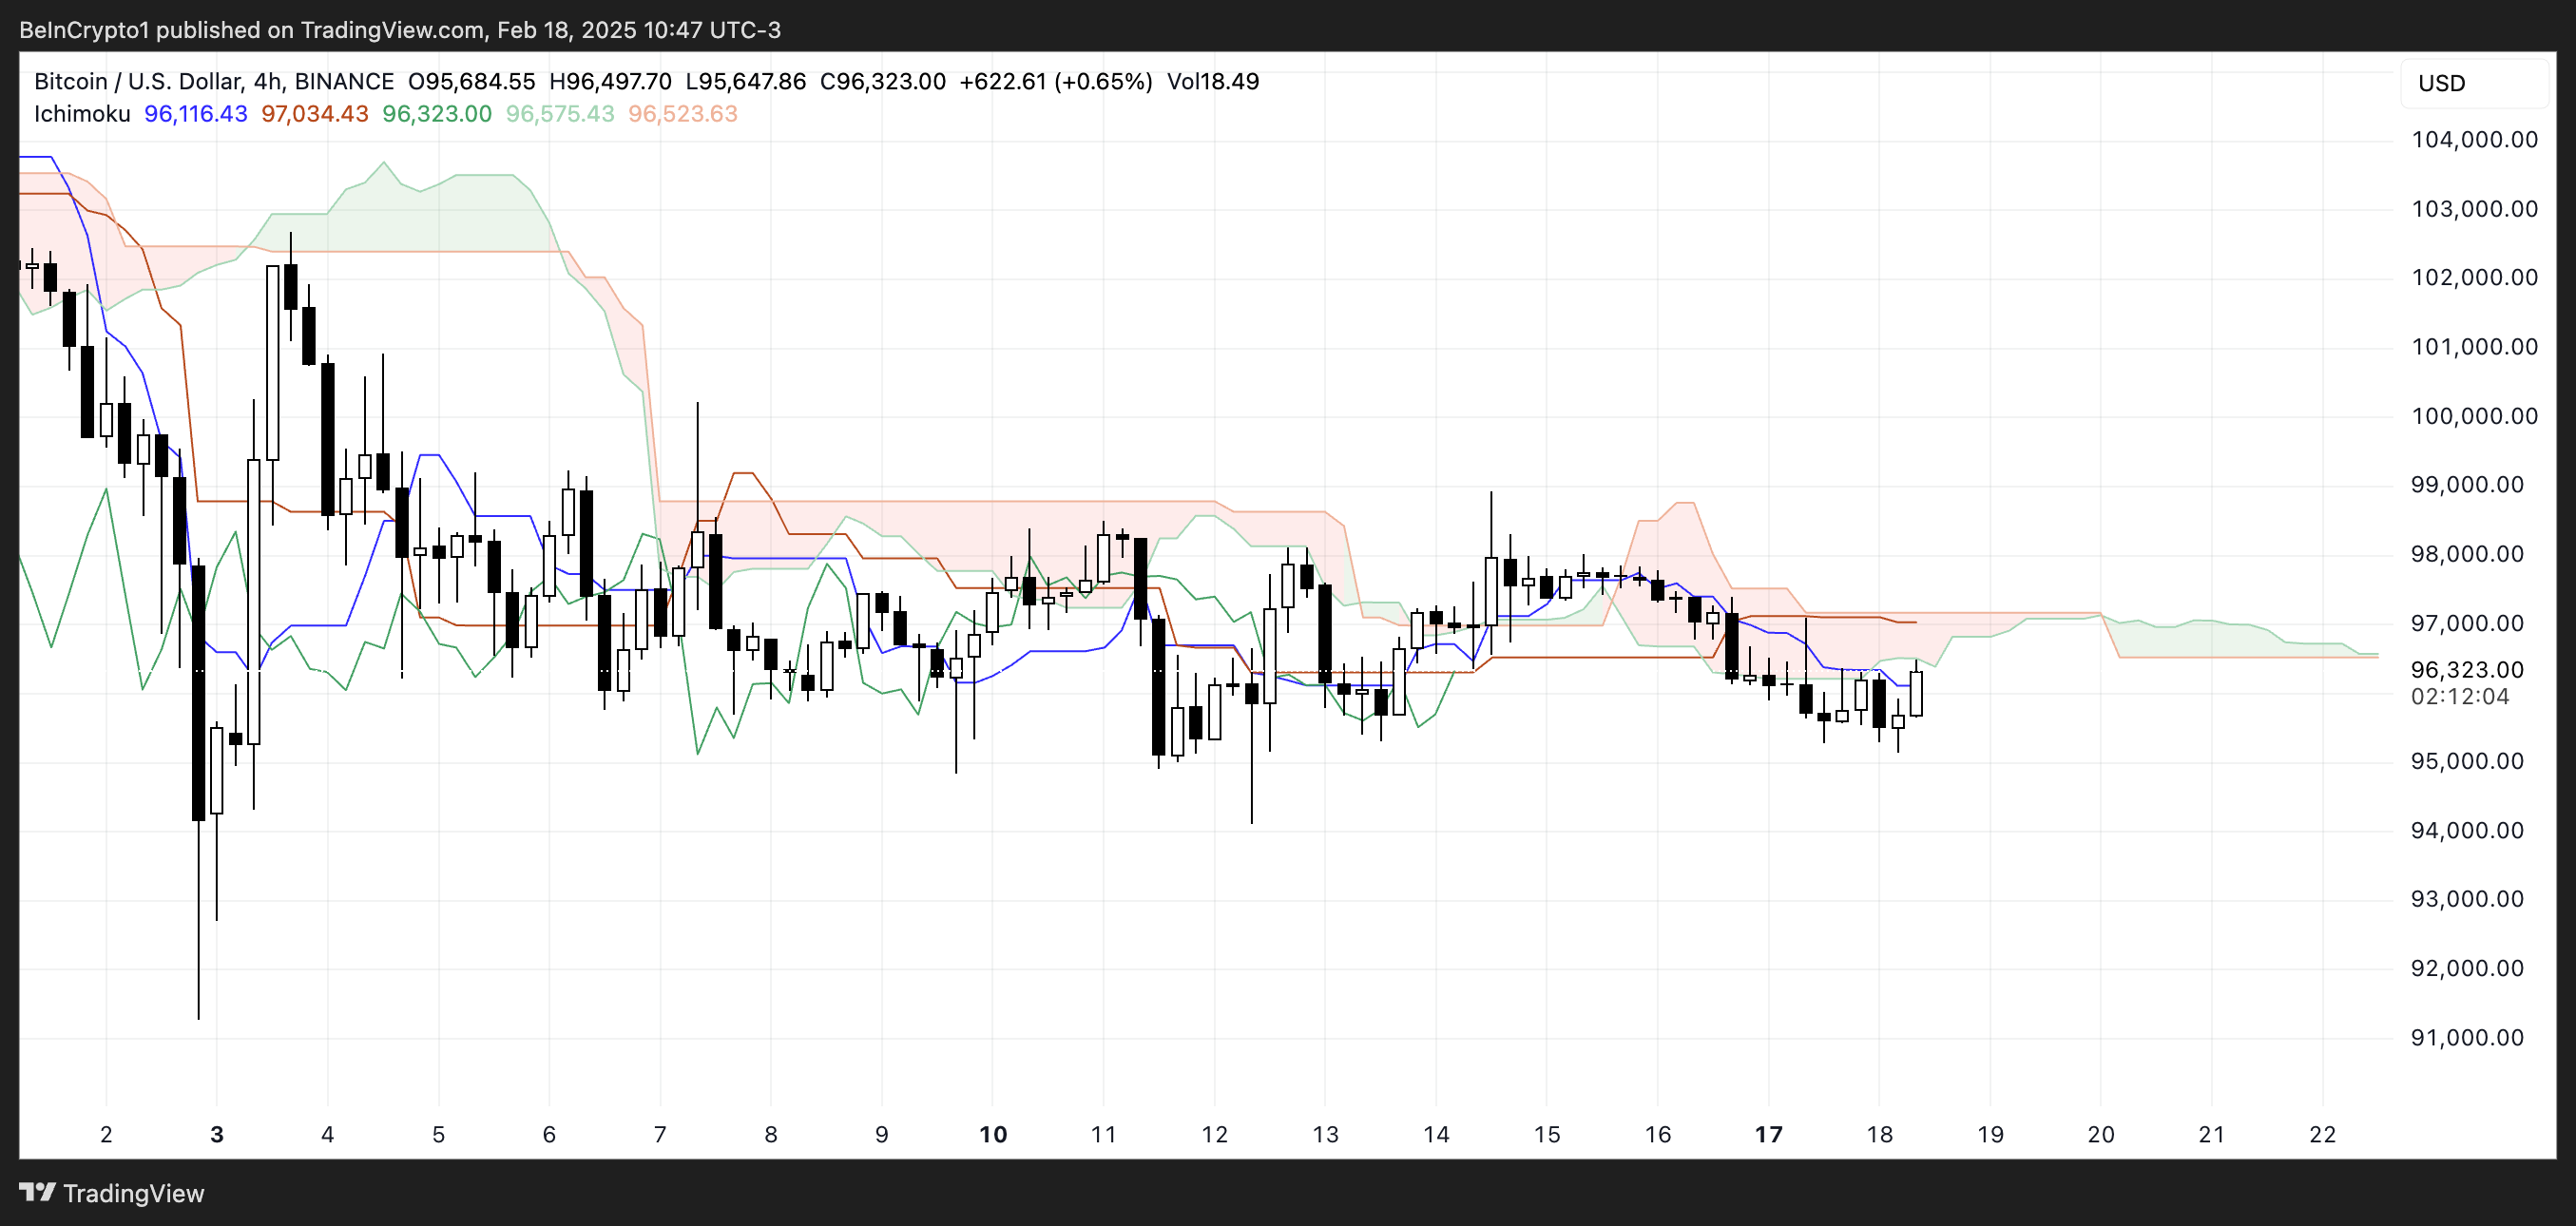 BTC Ichimoku Cloud. Source: TradingView.
The lagging span (green) is positioned near price action, further confirming the lack of strong momentum in either direction. The cloud’s future outlook remains uncertain, with no significant expansion or clear slope, signaling a potential continuation of the current range-bound movement.
If Bitcoin price decisively moves above or below the cloud, it could confirm the trend direction, but for now, the market remains in a neutral phase.
A thicker cloud in the future would indicate stronger resistance or support, but for now, the lack of a well-defined slope suggests that traders are waiting for confirmation before committing to a directional move.
BTC Whales Are Rising, But Still Way Below Previous Levels
The number of Bitcoin whales – addresses holding more than 1,000 BTC – has risen to 2,051, up from 2,037 ten days ago. Tracking these large holders is crucial because their accumulation or distribution can signal potential shifts in market sentiment.
When whale numbers increase, it often suggests confidence in BTC’s long-term value, as these large holders tend to buy during periods of perceived undervaluation.
On the other hand, a declining whale count can indicate distribution, which may lead to increased selling pressure and potential price weakness.
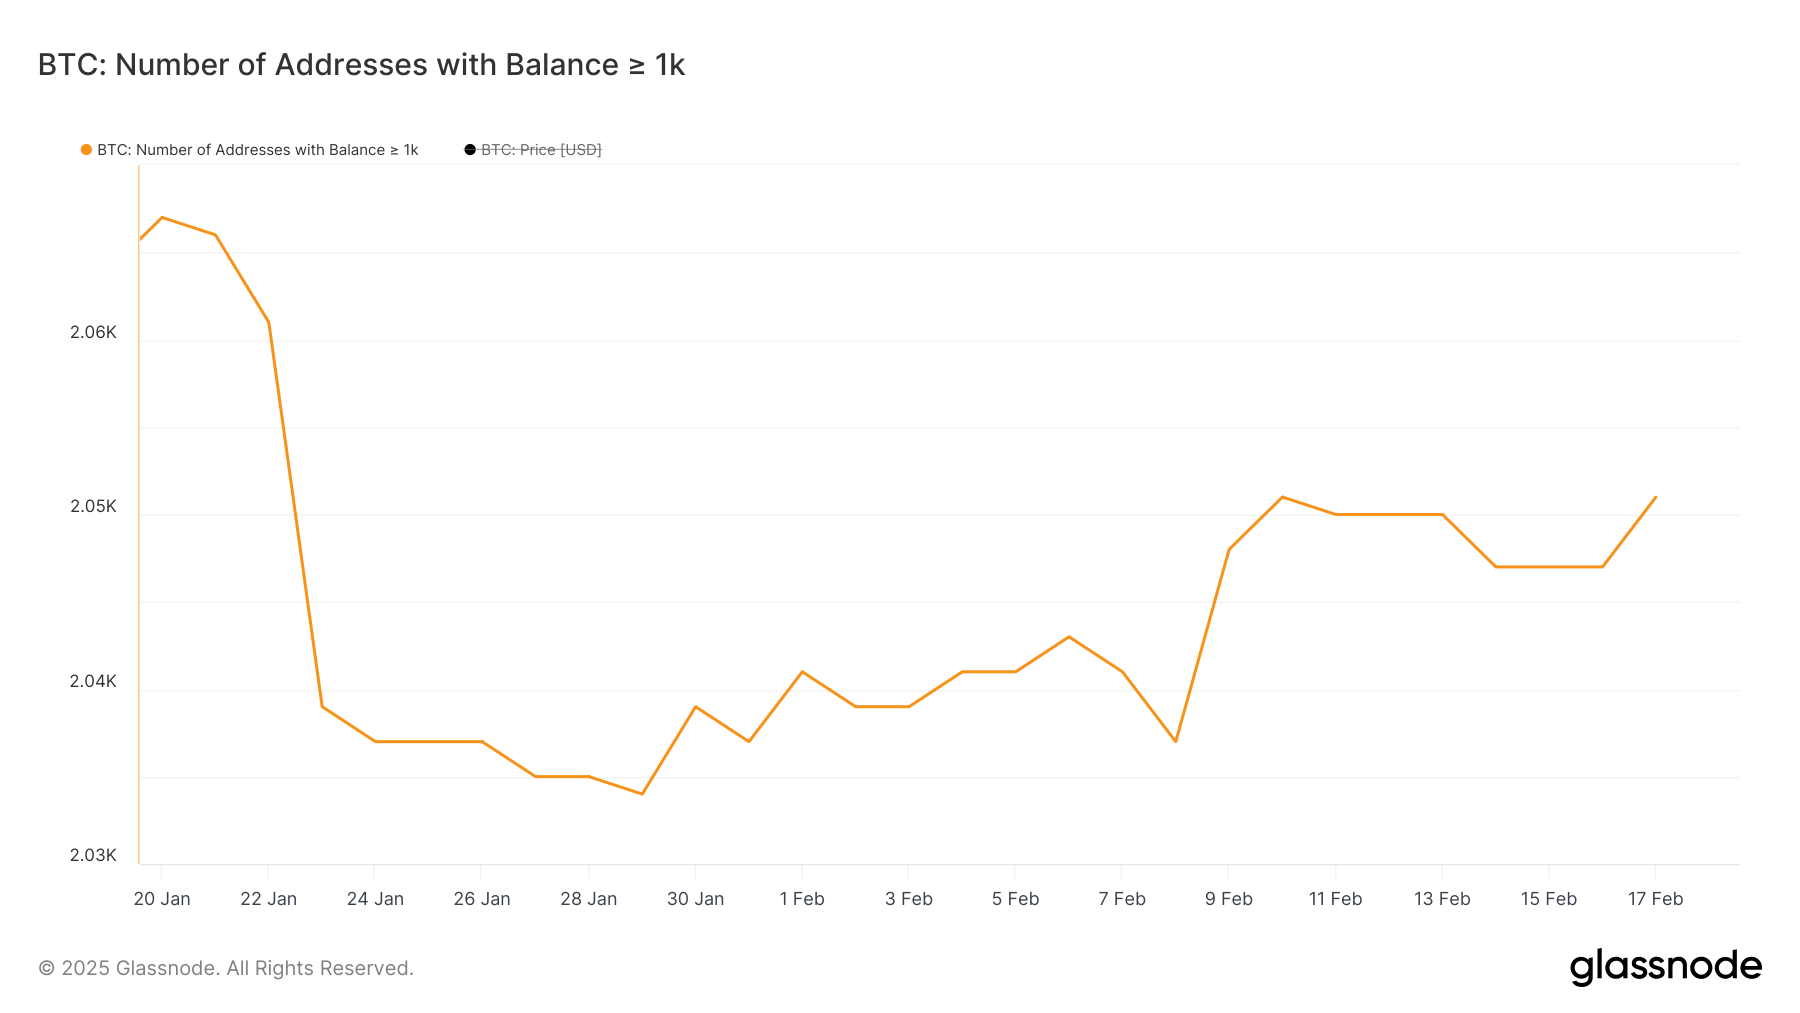 Number of addresses holding at least 1,000 BTC. Source: Glassnode.
Although the recent uptick in whale addresses shows some accumulation, the total remains significantly lower than the levels seen in December and January.
This suggests that while some large holders are returning, broader institutional or long-term investor confidence has not fully recovered.
If the number of whales continues rising, it could support a more sustained bullish trend, but if it stalls or declines again, it may indicate hesitation in the market.
BTC Price Prediction: Will Bitcoin Return To $100,000 Before March?
Bitcoin’s EMA lines show an ongoing bearish trend, with short-term moving averages positioned below long-term ones, reinforcing downward momentum. If Bitcoin price manages to reverse this trend, the first key resistance to watch is $98,481.
A successful breakout above this level could open the door for a move toward the psychological barrier of $100,000.
If Bitcoin regains the bullish momentum it had in December and January, further resistance at $102,681 could be tested. A break above that could push BTC price toward $106,313, marking its highest level since the end of January.
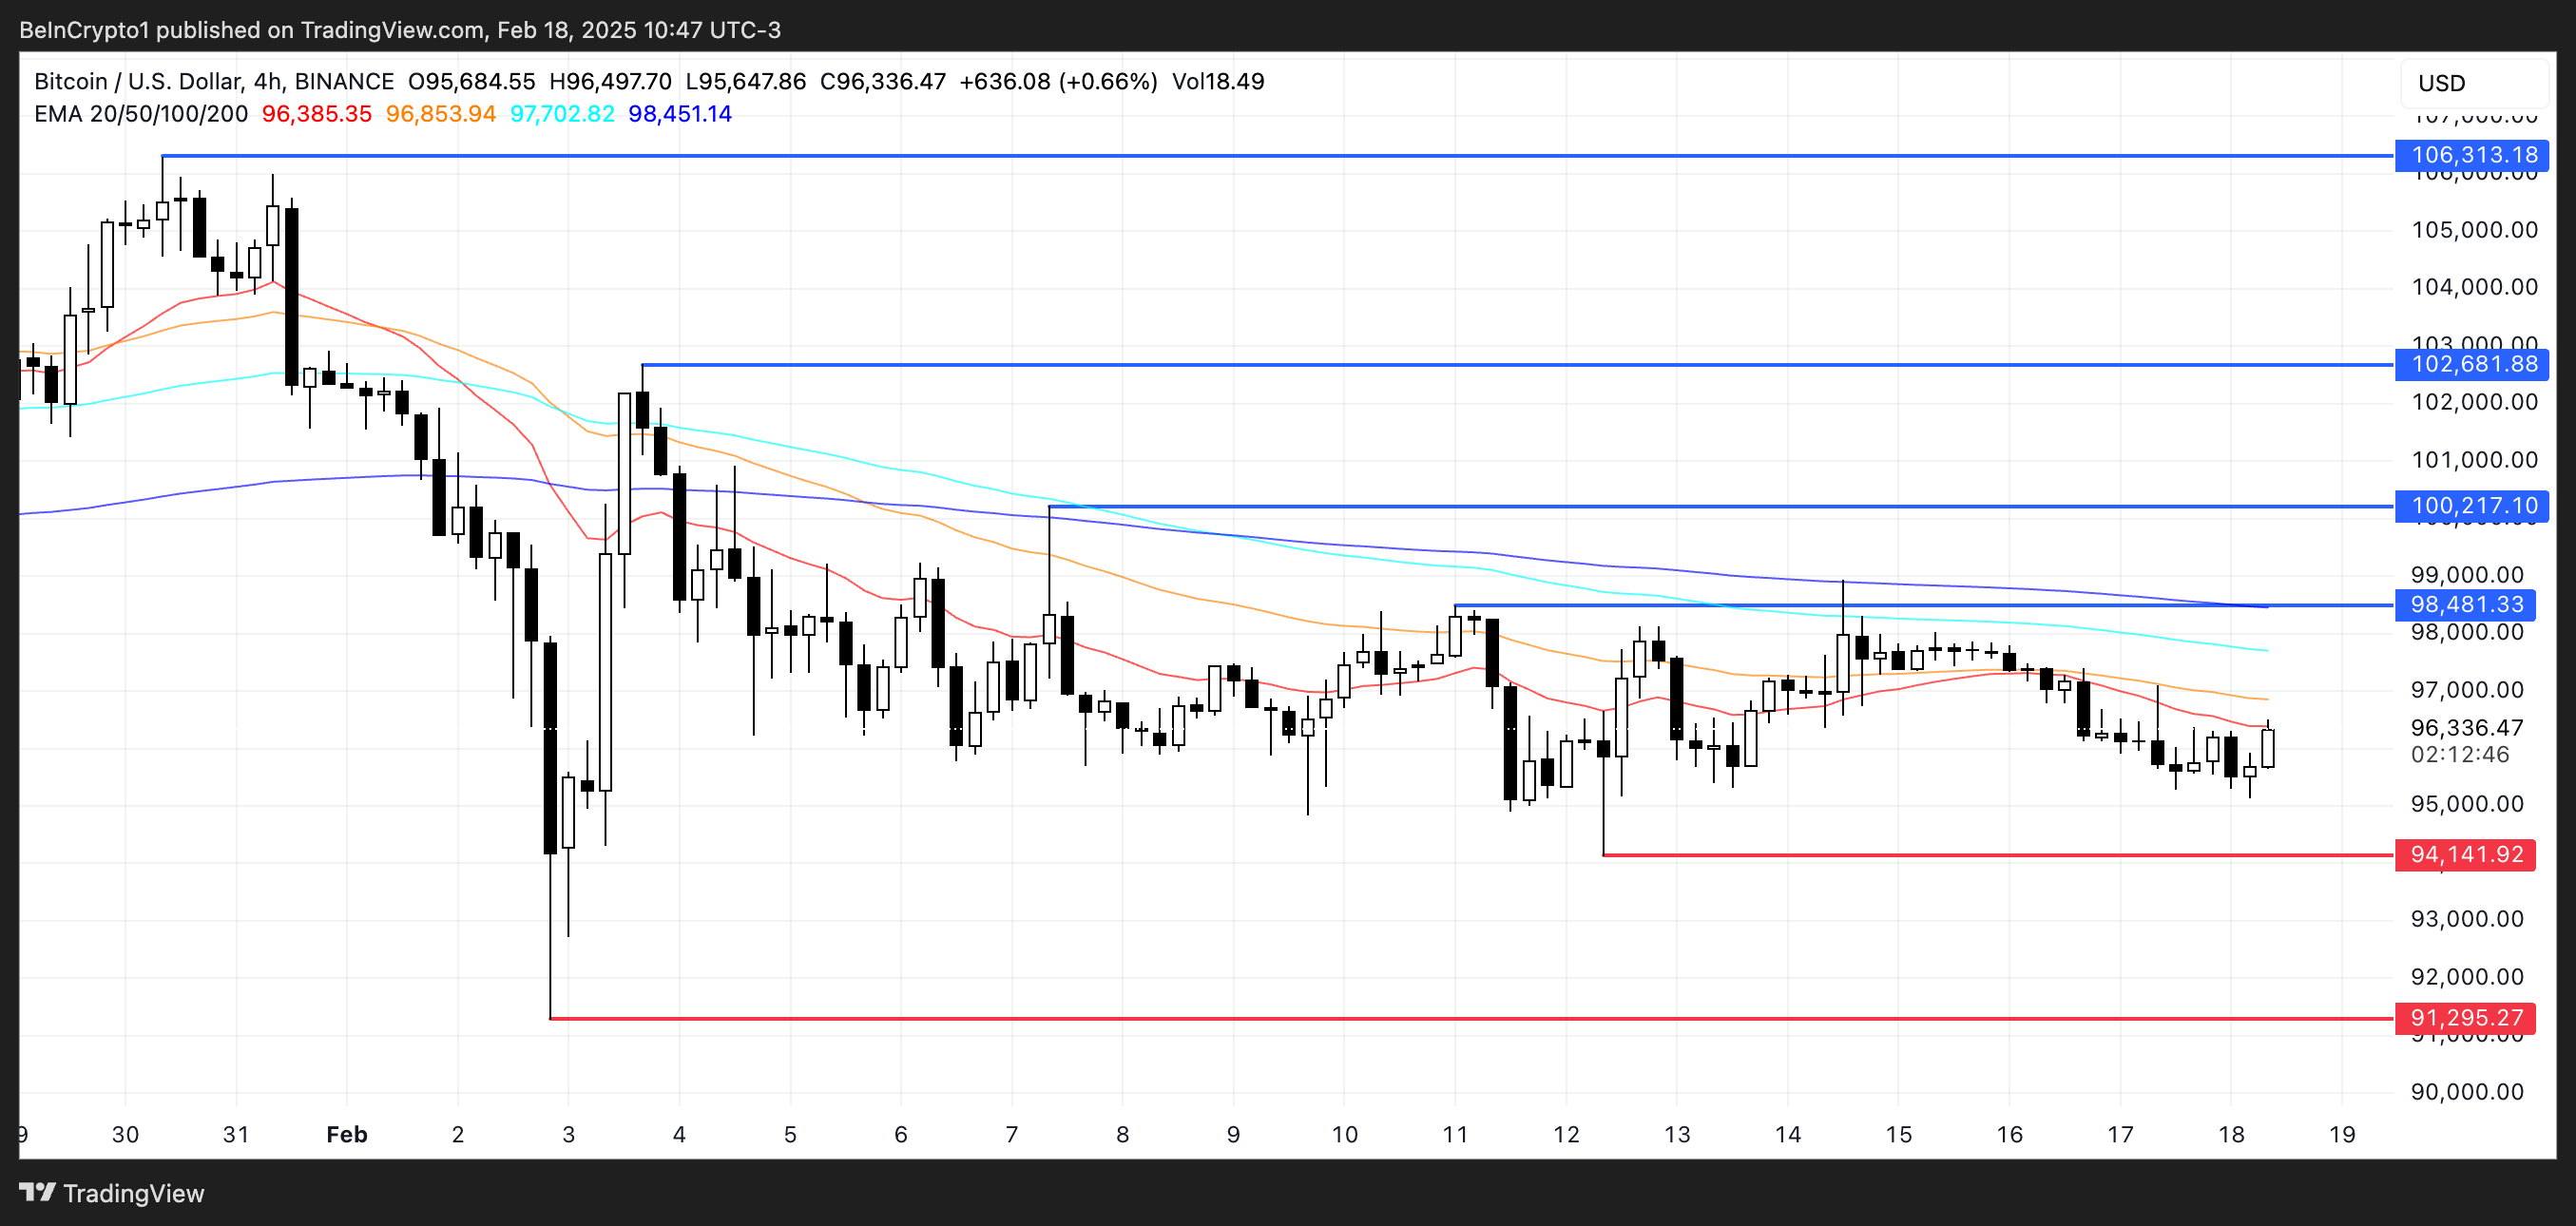 BTC Price Analysis. Source: TradingView.
On the other hand, if the downtrend persists and intensifies, BTC price could test critical support at $94,141.
A breakdown below this level would likely trigger further selling pressure, potentially sending the price as low as $91,295. Such a move would confirm the strength of the bearish trend and could delay any meaningful recovery.
For now, BTC remains in a key decision zone, with traders closely monitoring whether it can reclaim higher levels or if further downside is ahead.
Recommended Articles


