

Analyst Says SUI Price Could Fall To $1.6 — Here’s Why
The SUI price registered its best seven-day performance yet — in 2025 — over the past week. However, the altcoin has ended the week on the worst possible note, declining in value by almost 5% on Saturday, February 15th.
What’s more worrying is — the downward pressure appears not to be subsiding for the SUI token, with further losses seemingly on the way. According to popular crypto analyst Ali Martinez, the price of SUI could be on its way down to around $1.6.
Here’s Why SUI Could Shed Over 50%
In a Feb. 15 post on the X platform, Martinez shared an interesting analysis of the SUI price, shedding light on the altcoin’s current bearish setup. This downward prediction is based on the formation of a head-and-shoulders pattern on SUI’s 12-hour price chart.
The head-and-shoulders formation is a pattern in technical analysis marked by three distinct price crests (swing highs), including a higher “head” between two lower “shoulders.” This chart formation usually signals a possible bearish reversal — a shift from an upward price trend to a downtrend.
This trend reversal is only valid when the price successfully closes beneath the neckline, which is a trendline connecting the troughs (swing lows) between the head. Meanwhile, the price target is calculated by adding the difference between the swing low (either shoulder) and the swing high (the head) to the breakout point.
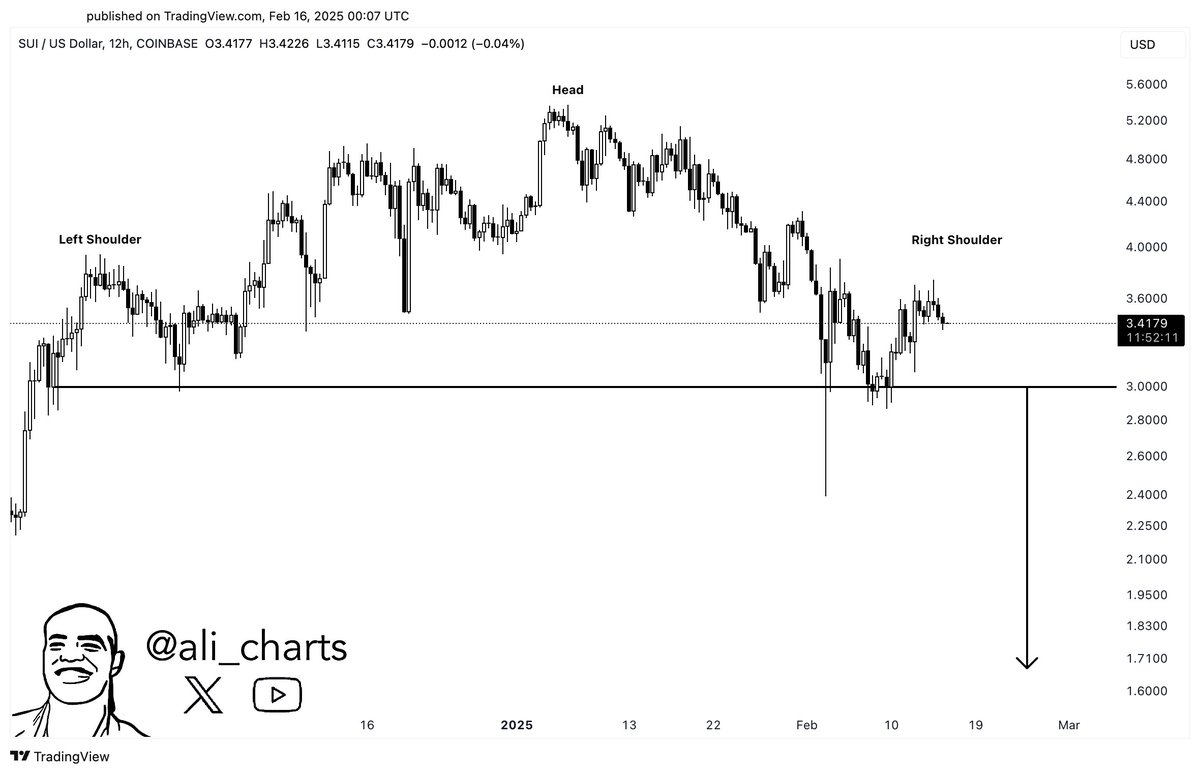
As highlighted in the chart above, the SUI price seems to be approaching the neckline around the $3 region. Martinez noted that if the price of SUI successfully breaches and closes beneath this level, the altcoin could witness a correction to as low as $1.6. This represents an over 50% decline from the current price point.
However, a successful price close above the right shoulder in the head-and-shoulders formation could invalidate the current bearish setup. Hence, investors could see the price of SUI resume its resurgence if it returns above the critical $3.7 level.
SUI Price Surges 10% In Past Week
After a blistering start to the new year, reaching a new all-time of $5.35 on January 4, 2025, the SUI token has since witnessed a severe market downturn. The top-20 cryptocurrency fell to a low of $2.73 in a market-wide correction triggered by new trade policies of US President Donald Trump.
As of this writing, the SUI price stands at around $3.4, reflecting a 5% decline in the past 24 hours. However, the altcoin’s value is up by nearly double-digits (10.6%) in the weekly timeframe, according to data from CoinGecko.
Featured image from Investopedia, chart from TradingView
Recommended Articles


