

Ethereum Price Forecast: ETH eyes $3,000 as Trump and Putin agrees to begin negotiations on ending Ukraine war
Ethereum price today: $2,670
- Ethereum is riding the positive market sentiment of Trump's agreement with Putin.
- The top altcoin bounced from an intraday decline sparked by the US higher-than-expected CPI data.
- Goldman Sachs upped its Ethereum holdings to $480 million in Q4.
- Ethereum needs to recover the $3,000 level to spark a short-term bullish momentum amid signs of a crossover in the Stochastic Oscillator.
Ethereum (ETH) saw a 3% gain on Wednesday following United States (US) President Donald Trump's agreement with Russian President Vladimir Putin to begin negotiations to end the Russian-Ukraine war. The agreement helped ETH and the wider crypto market recover from an inflation-induced decline.
Ethereum sees recovery following Trump's agreement with Putin
Ethereum is seeing a recovery alongside the general crypto market after experiencing a brief decline following the release of the US Consumer Price Index (CPI) data for January.
The Core CPI, which rose by 3.3% YoY against expectations of 3.1%, sparked a crypto market decline in the early American session, with Ethereum falling by 2%.
However, Ethereum rebounded quickly alongside Bitcoin after President Trump announced that he reached an agreement with Putin to begin negotiations to end the Russian-Ukraine war.
Trump wrote on his social media platform, Truth Social, that together with Putin, they "agreed to have our respective teams start negotiations immediately."
The agreement was positive for the crypto market as the lingering war was part of several events that triggered a crypto winter in 2022.
Meanwhile, investment bank Goldman Sachs revealed that it expanded its spot Ethereum exchange-traded fund (ETF) holdings to nearly $480 million by the end of Q4 '24 — about a 2000% increase from its initial investment of $22 million in November 2024.
The company's Ethereum ETF exposure is split nearly equally between BlackRock iShares Ethereum Trust (ETHA) and Fidelity Ethereum Fund (FETH), with a tiny holding of $6.3 million in Grayscale Ethereum Trust (ETHE), per a Tuesday filing with the Securities & Exchange Commission (SEC).
Goldman also increased its spot Bitcoin ETF holdings to $1.52 billion, with most of its holdings in the iShares Bitcoin Trust (IBIT).
Following Goldman's filing, Donald Trump's affiliated World Liberty Financial also upped its ETH holdings by purchasing $5 million worth of the top altcoin.
US spot Ethereum ETFs recorded $12.6 million in net inflows on Tuesday, per Coinglass data.
Ethereum Price Forecast: ETH eyes the $3,000 level as it aims to spark a short-term bullish momentum
Ethereum experienced $58.46 million in futures liquidations in the past 24 hours, per Coinglass data. The total amount of liquidated long and short positions accounted for $29.86 million and $28.60 million, respectively.
On the weekly chart, ETH is trading within a key rectangular channel that extends from January 2024.
The top altcoin remained within this channel all through 2024, holding the key support level near $2,200 and continually seeing a rejection near the $4,100 resistance. A firm weekly candlestick close outside the rectangle channel could determine ETH's next long-term trend.
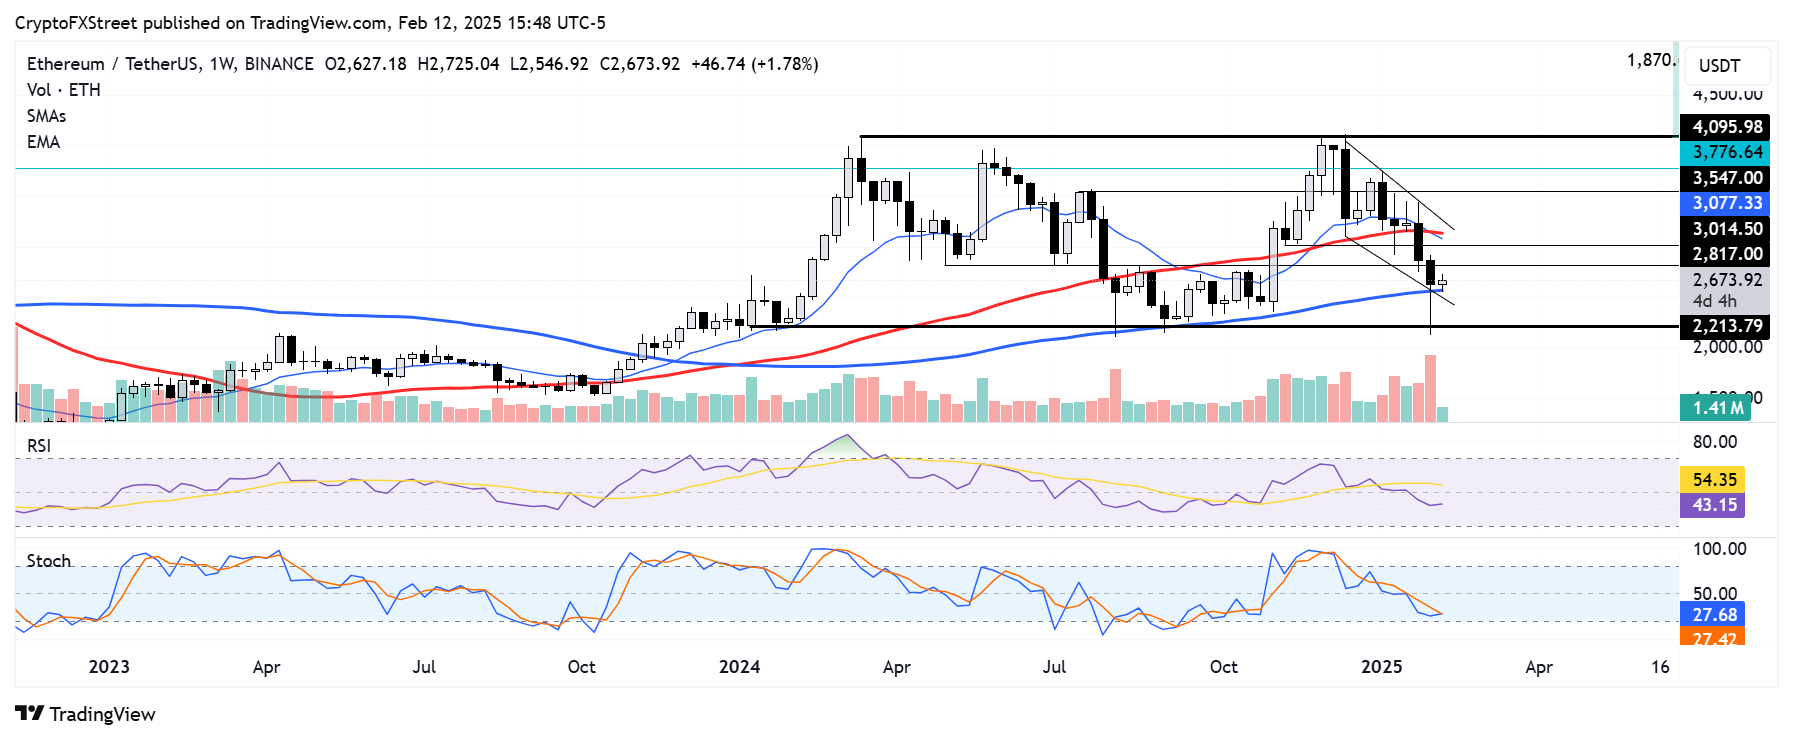
ETH/USDT weekly chart
In the short term, ETH found support near the lower boundary line of a descending channel, strengthened by the 100-day Simple Moving Average (SMA). ETH could flip to a short-term bullish trend if it recovers the support near $2,817 to $3,000.
If ETH pulls off such a move and fails to see a rejection near the 50-day SMA and 14-day Exponential Moving Average (EMA), it could rally to test the rectangular channel's upper boundary resistance near $4,100.
Meanwhile, the Relative Strength Index (RSI) and Stochastic Oscillator (Stoch) are below their neutral levels, indicating dominant bearish momentum. However, the Stoch's %D line is testing its moving average %K line. A crossover could signal a recovery and help strengthen the momentum of ETH bulls.
A firm weekly candlestick close below $2,200 will invalidate the thesis.
Ethereum FAQs
Ethereum is a decentralized open-source blockchain with smart contracts functionality. Its native currency Ether (ETH), is the second-largest cryptocurrency and number one altcoin by market capitalization. The Ethereum network is tailored for building crypto solutions like decentralized finance (DeFi), GameFi, non-fungible tokens (NFTs), decentralized autonomous organizations (DAOs), etc.
Ethereum is a public decentralized blockchain technology, where developers can build and deploy applications that function without the need for a central authority. To make this easier, the network leverages the Solidity programming language and Ethereum virtual machine which helps developers create and launch applications with smart contract functionality.
Smart contracts are publicly verifiable codes that automates agreements between two or more parties. Basically, these codes self-execute encoded actions when predetermined conditions are met.
Staking is a process of earning yield on your idle crypto assets by locking them in a crypto protocol for a specified duration as a means of contributing to its security. Ethereum transitioned from a Proof-of-Work (PoW) to a Proof-of-Stake (PoS) consensus mechanism on September 15, 2022, in an event christened “The Merge.” The Merge was a key part of Ethereum's roadmap to achieve high-level scalability, decentralization and security while remaining sustainable. Unlike PoW, which requires the use of expensive hardware, PoS reduces the barrier of entry for validators by leveraging the use of crypto tokens as the core foundation of its consensus process.
Gas is the unit for measuring transaction fees that users pay for conducting transactions on Ethereum. During periods of network congestion, gas can be extremely high, causing validators to prioritize transactions based on their fees.
Recommended Articles


