

Retail Investors Boost Bitcoin Accumulation By 72% Amid Intense Whale Selling – Details

Source Newsbtc

This trading week proved rather turbulent for Bitcoin as the premier cryptocurrency fell to as low as $91,000 on Monday amid concerns of a potential trade war between the US and Canada, Mexico, and China. Though Bitcoin soon made a sharp recovery rising briefly above $102,000, the flagship cryptocurrency currently trades above $96,000 in what appears to be a range-bound market. Meanwhile, blockchain analytics firm Glassnode has provided valuable insights on Bitcoin investor behavior in the last few months.

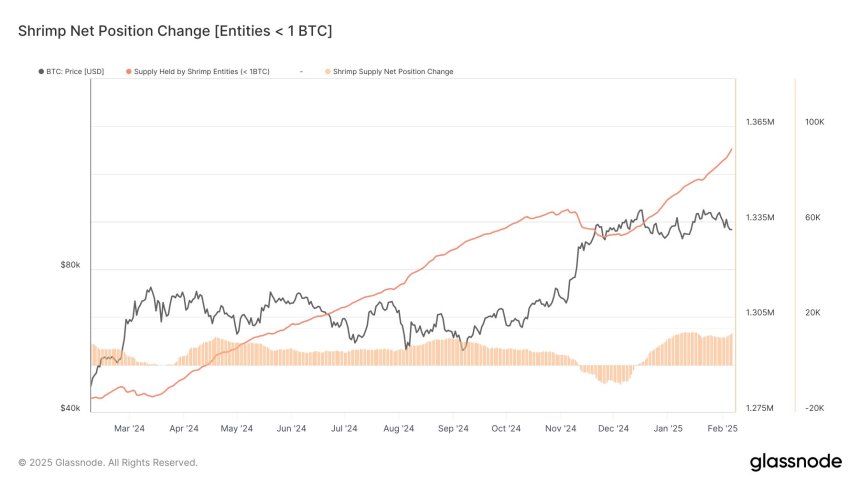
Bitcoin Retail Investors Stacking 10,627 BTC Daily 

In a new X post, Glassnode dived into the recent activity of Bitcoin holders stating that retail investors i.e. address holding ≤1 BTC, are presently on an accumulation spree stretching to mid-December. Notably, these small investors are purchasing Bitcoin at an accelerated average rate of 10,627 BTC per day, which represents a 72% surge compared to last year’s daily average of 6,177 BTC.

This aggressive buying by retail investors marks a stark contrast to their behavior in November where they opted to take profits as Bitcoin soared past $100,000.  However, their renewed accumulation despite Bitcoin’s woes since December suggests a strong confidence in the asset’s long-term profitability.
 

Bitcoin

On the other end, Bitcoin whales i.e. investors holding over 1000 BTC, are offloading their assets at a rather unprecedented rate.  Since November 24, these large investors have been moving Bitcoin to exchanges at an alarming average rate of 32,509 per day, suggesting a potential 9x increase in selling pressure compared to BTC’s yearly average.

Generally, a large sell-off by market whales is a bearish signal indicating uncertainty about an asset’s future price.  However, the Bitcoin community remains bullish as a significant portion of the offload by the market whales can be attributed to profit-taking rather than loss of confidence.

Furthermore, the recent accumulation surge by retail investors has served as a key absorber of supply, mitigating potential drastic price declines. Albeit, as Bitcoin struggles to find some stability, retail investors must maintain their current demand level which is crucial in sustaining the asset’s bullish structure.

BTC Price Overview 

At press time, Bitcoin trades at $96,679 after a 0.84% decline in the past day. This negative performance underlines the asset’s form in the past week in which prices dipped by a cumulative 5.71%. Despite the price decline, trading volume has surged by 17.22%, signaling increased market activity and interest. Bitcoin’s price action indicates consolidation within the $95,000–$100,000 range, setting the stage for a potential breakout. To confirm an uptrend, market bulls must drive a rally beyond the critical $105,000 resistance level.

Bitcoin
Disclaimer: For information purposes only. Past performance is not indicative of future results.
placeholder
Fed hike odds near 90% into Wednesday's decision — how to trade the dollar, gold and the S&P 500A 0.3% monthly core CPI print has lifted the market-implied probability of a 25bp Fed hike on 16 September to roughly 86.5% ~ 90%, which would be the first increase since July 2023. Here is the decision timeline, the pricing versus the forecasts, both scenarios, and the key levels for the dollar, gold and the S&P 500.
Author  Suzie
Sep 14, Mon
A 0.3% monthly core CPI print has lifted the market-implied probability of a 25bp Fed hike on 16 September to roughly 86.5% ~ 90%, which would be the first increase since July 2023. Here is the decision timeline, the pricing versus the forecasts, both scenarios, and the key levels for the dollar, gold and the S&P 500.
placeholder
【Daily Brief】10-year Treasury yield briefly tops 5%, S&P 500 slips to 7,602 and the dollar firms at 99.3 as the Fed's decision eve beginsThe 10-year Treasury yield touched 5.014% on Monday — its first print above 5% since October 2023 — while the S&P 500 closed 0.48% lower at 7,619.98 and the dollar index firmed to 99.3. Here is the full market wrap ahead of Wednesday's FOMC decision, the dot plot and the August retail sales report, plus today's CLARITY Act Senate vote.
Author  Irene Q.
Sep 15, Tue
The 10-year Treasury yield touched 5.014% on Monday — its first print above 5% since October 2023 — while the S&P 500 closed 0.48% lower at 7,619.98 and the dollar index firmed to 99.3. Here is the full market wrap ahead of Wednesday's FOMC decision, the dot plot and the August retail sales report, plus today's CLARITY Act Senate vote.
placeholder
Silver breaks $64 as precious metals rebound — can gold hold the $4,280 line into the Fed decision?Silver has climbed back above $64 an ounce for the first time this week, leading a broad rebound across precious metals hours before the Federal Reserve delivers what is expected to be its first rate hike since 2023. Spot silver was last at $64.64, up 1.49% on the day, while gold reclaimed $4,300 and platinum and palladium both advanced. The question now is whether the bounce is a genuine turn — or a pause before the Fed's dot plot decides the next move.
Author  Suzie
Yesterday 08: 40
Silver has climbed back above $64 an ounce for the first time this week, leading a broad rebound across precious metals hours before the Federal Reserve delivers what is expected to be its first rate hike since 2023. Spot silver was last at $64.64, up 1.49% on the day, while gold reclaimed $4,300 and platinum and palladium both advanced. The question now is whether the bounce is a genuine turn — or a pause before the Fed's dot plot decides the next move.
placeholder
Dow drops 631 points as the Fed hikes — but futures are rebounding: what's next for US stocks?The Dow fell 631 points and the S&P 500 closed below 7,600 after the Fed hiked rates for the first time since 2023, with the dot plot showing 16 of 18 officials expect more tightening. Asia-session futures are already recovering — here are the levels and analyst views that decide whether 7,500 holds.
Author  Irene Q.
8 hours ago
The Dow fell 631 points and the S&P 500 closed below 7,600 after the Fed hiked rates for the first time since 2023, with the dot plot showing 16 of 18 officials expect more tightening. Asia-session futures are already recovering — here are the levels and analyst views that decide whether 7,500 holds.
placeholder
Dollar index tops 100 for the first time since July as the Fed's hawkish dot plot sinks inThe U.S. dollar index broke back above 100 for the first time since 31 July after the Fed delivered its first rate hike since 2023, with the dot plot showing 16 of 18 officials expect at least one more increase this year. Here are the levels that matter for DXY, the currencies feeling it most, and what to watch next.
Author  Irene Q.
8 hours ago
The U.S. dollar index broke back above 100 for the first time since 31 July after the Fed delivered its first rate hike since 2023, with the dot plot showing 16 of 18 officials expect at least one more increase this year. Here are the levels that matter for DXY, the currencies feeling it most, and what to watch next.
goTop
quote