


Ethereum Price Forecast: ETH reclaims $3,300, defies market decline ahead of historically positive February
Ethereum price today: $3,310
- Ethereum could be set for a positive February as bullish sentiment rises due to its historical positive returns in the month.
- World Liberty Financial continues its ETH buying spree by swapping 10 million USDT for 2,971 ETH.
- Ethereum ETFs flip to net inflows following SEC approval of Bitwise combined Bitcoin and Ethereum ETF.
- Ethereum bulls and bears are battling near the upper boundary resistance of a falling wedge.
Ethereum (ETH) trades above $3,300, up 2% on Friday following bullish sentiments ahead of a historically positive February. Several ecosystem updates, including the upcoming Pectra upgrade, rising inflows into investment products and President Donald Trump-linked World Liberty Financial (WLF) ETH buying spree, are fueling the positive momentum.
Ethereum sees bullish updates ahead of February
With February approaching, Ethereum's bullish sentiment is rising due to its historical positive returns in the month. Investors are anticipating a similar performance to 2024, where ETH rose over 46% in the month.
This expectation is visible in ETH's defiance of the decline in the wider crypto market. Ethereum is up over 2%, while the general crypto market capitalization plunged by 3.5% in the past 24 hours.
Recent updates surrounding the top altcoin also suggest the new month could be positive for Ethereum:
- Donald Trump-linked World Liberty Financial continued its Ethereum buying spree on Friday, swapping 10 million USDT for 2,971 ETH through Cow Protocol. The recent purchase has seen WLF's total ETH holdings — aside its staked ETH — rise to 59,288 ETH.
- On Thursday, the Securities & Exchange Commission (SEC) approved NYSE Arca's Bitwise combined Bitcoin and Ethereum exchange-traded fund (ETF) filing. The ETF would allow investors who prefer to hold both assets to gain exposure to their combined price performance.
- Ethereum ETFs recorded a net inflow of $67.80 million on Thursday. BlackRock's ETHA and Fidelity's FETH dominated the flows with $79.90 million and $15.40 million inflows, respectively. Grayscale's ETHE continued posting outflows with an exodus of $40.30 million.
- Meanwhile, in its Thursday All Core Developers (ACD) call, Ethereum Foundation (EF) Protocol Support Lead Tim Beiko reiterated the tentative timeline for the Pectra upgrade. Developers plan for Pectra to go live on testnets Holesky and Sepolia on or around February 19 and 26, respectively, with a mainnet upgrade in mid-March.
The official Ethereum X handle covers more Ethereum ecosystem updates in this thread.
Ethereum Price Forecast: Bulls and bears battle near falling wedge resistance
Ethereum experienced $62.89 million in futures liquidations in the past 24 hours, per Coinglass data. The total amount of long and short liquidations accounted for $23.79 million and $39.10 million, respectively.
Ethereum surged above the upper boundary resistance of a falling wedge pattern on Friday before seeing a rejection near the 50-day Simple Moving Average (SMA).
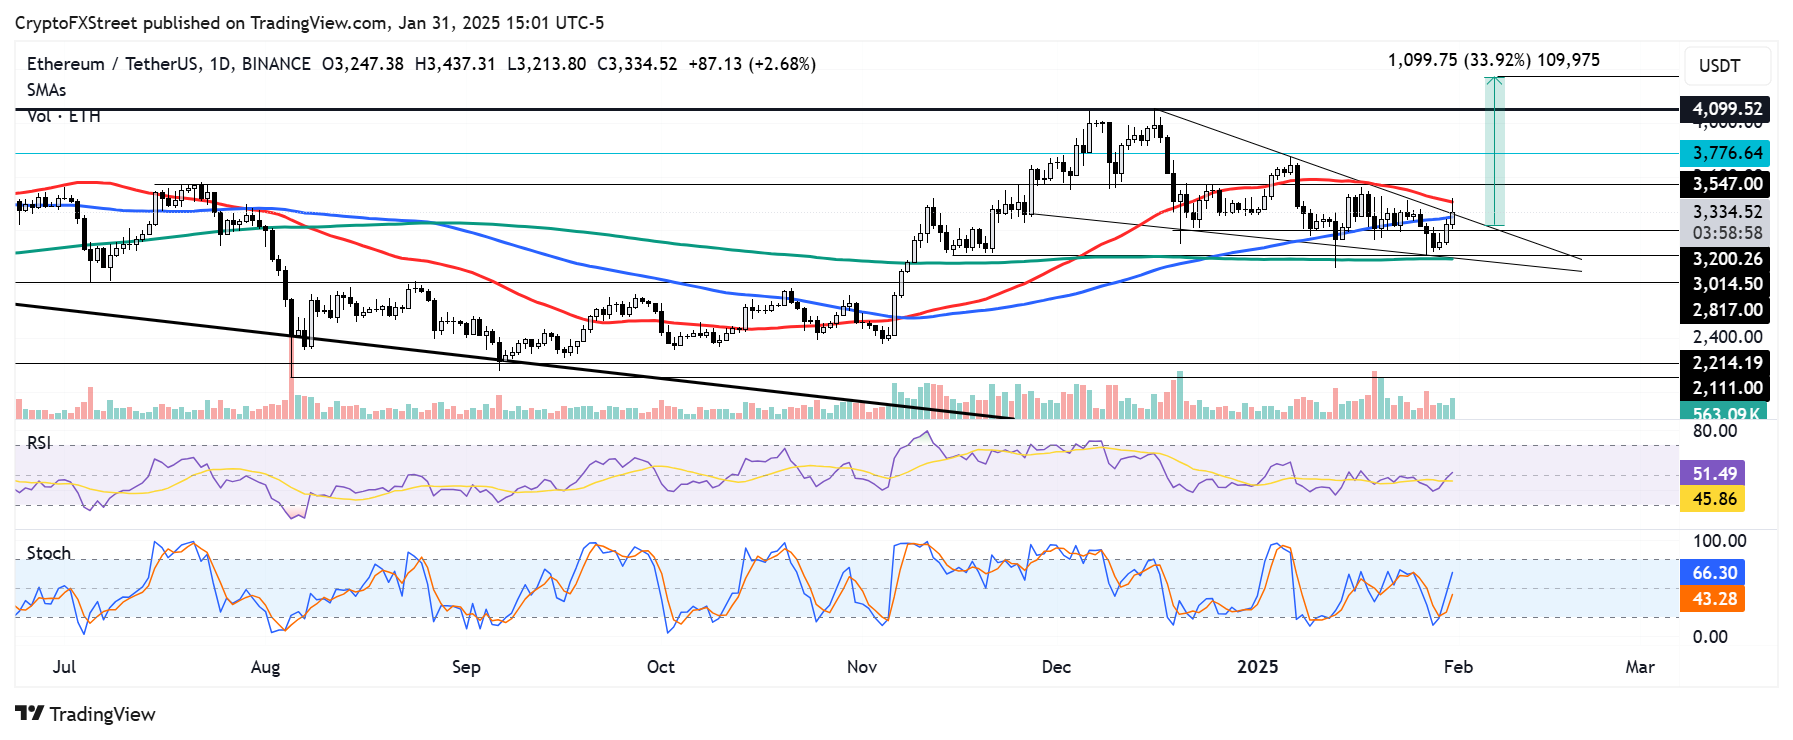
ETH/USDT daily chart
Bulls are pushing for ETH to maintain a move above the falling wedge. If bulls hold the wedge's upper boundary line as a support and clears the 50-day and 200-day SMA, ETH could rally over 30% above $4,300. The 30% target is obtained by measuring the distance between the highest and lowest point of the falling wedge.
However, if bears prevail, ETH could find support at the wedge's lower boundary line near $3,000.
The Relative Strength Index (RSI) and Stochastic Oscillator (Stoch) crossed above their neutral levels, indicating increased bullish momentum. This could fuel the rally.
ETH could face resistance near the $3,550, $3,770 and $4,100 key levels on the way up.
A daily candlestick close below the falling wedge lower boundary support line will invalidate the thesis.
Ethereum FAQs
Ethereum is a decentralized open-source blockchain with smart contracts functionality. Its native currency Ether (ETH), is the second-largest cryptocurrency and number one altcoin by market capitalization. The Ethereum network is tailored for building crypto solutions like decentralized finance (DeFi), GameFi, non-fungible tokens (NFTs), decentralized autonomous organizations (DAOs), etc.
Ethereum is a public decentralized blockchain technology, where developers can build and deploy applications that function without the need for a central authority. To make this easier, the network leverages the Solidity programming language and Ethereum virtual machine which helps developers create and launch applications with smart contract functionality.
Smart contracts are publicly verifiable codes that automates agreements between two or more parties. Basically, these codes self-execute encoded actions when predetermined conditions are met.
Staking is a process of earning yield on your idle crypto assets by locking them in a crypto protocol for a specified duration as a means of contributing to its security. Ethereum transitioned from a Proof-of-Work (PoW) to a Proof-of-Stake (PoS) consensus mechanism on September 15, 2022, in an event christened “The Merge.” The Merge was a key part of Ethereum's roadmap to achieve high-level scalability, decentralization and security while remaining sustainable. Unlike PoW, which requires the use of expensive hardware, PoS reduces the barrier of entry for validators by leveraging the use of crypto tokens as the core foundation of its consensus process.
Gas is the unit for measuring transaction fees that users pay for conducting transactions on Ethereum. During periods of network congestion, gas can be extremely high, causing validators to prioritize transactions based on their fees.
Recommended Articles


