

Litecoin, Bitcoin Cash (BCH), Monero (XMR) profit as LTC ETF speculations lift PoW sector
- Litecoin price hit a 14-day peak of $135 on Friday amid spot LTC ETF approval speculations.
- The Proof-of-Work sector valuation rose 1% in the last 24 hours, crossing the $2.1 trillion milestone.
- Bitcoin and Dogecoin trended downwards as PoW investors spread out capital towards Litecoin, Bitcoin Cash and Monero.
Speculations around Litecoin spot ETF approval propelled coins within the Proof-of-Work sector. Technical indicators highlight how LTC, BCH and XMR prices could move in the days ahead.
LTC, BCH and XMR traders in profit as PoW sector valuation crosses $2.1 trillion
Litecoin (LTC) surged to a 14-day peak of $135 on Friday, fueled by growing speculation over a potential spot Litecoin ETF approval.
The broader Proof-of-Work (PoW) sector capitalized on the bullish momentum, pushing its total market valuation past the $2.1 trillion mark with a 1% gain in the last 24 hours.
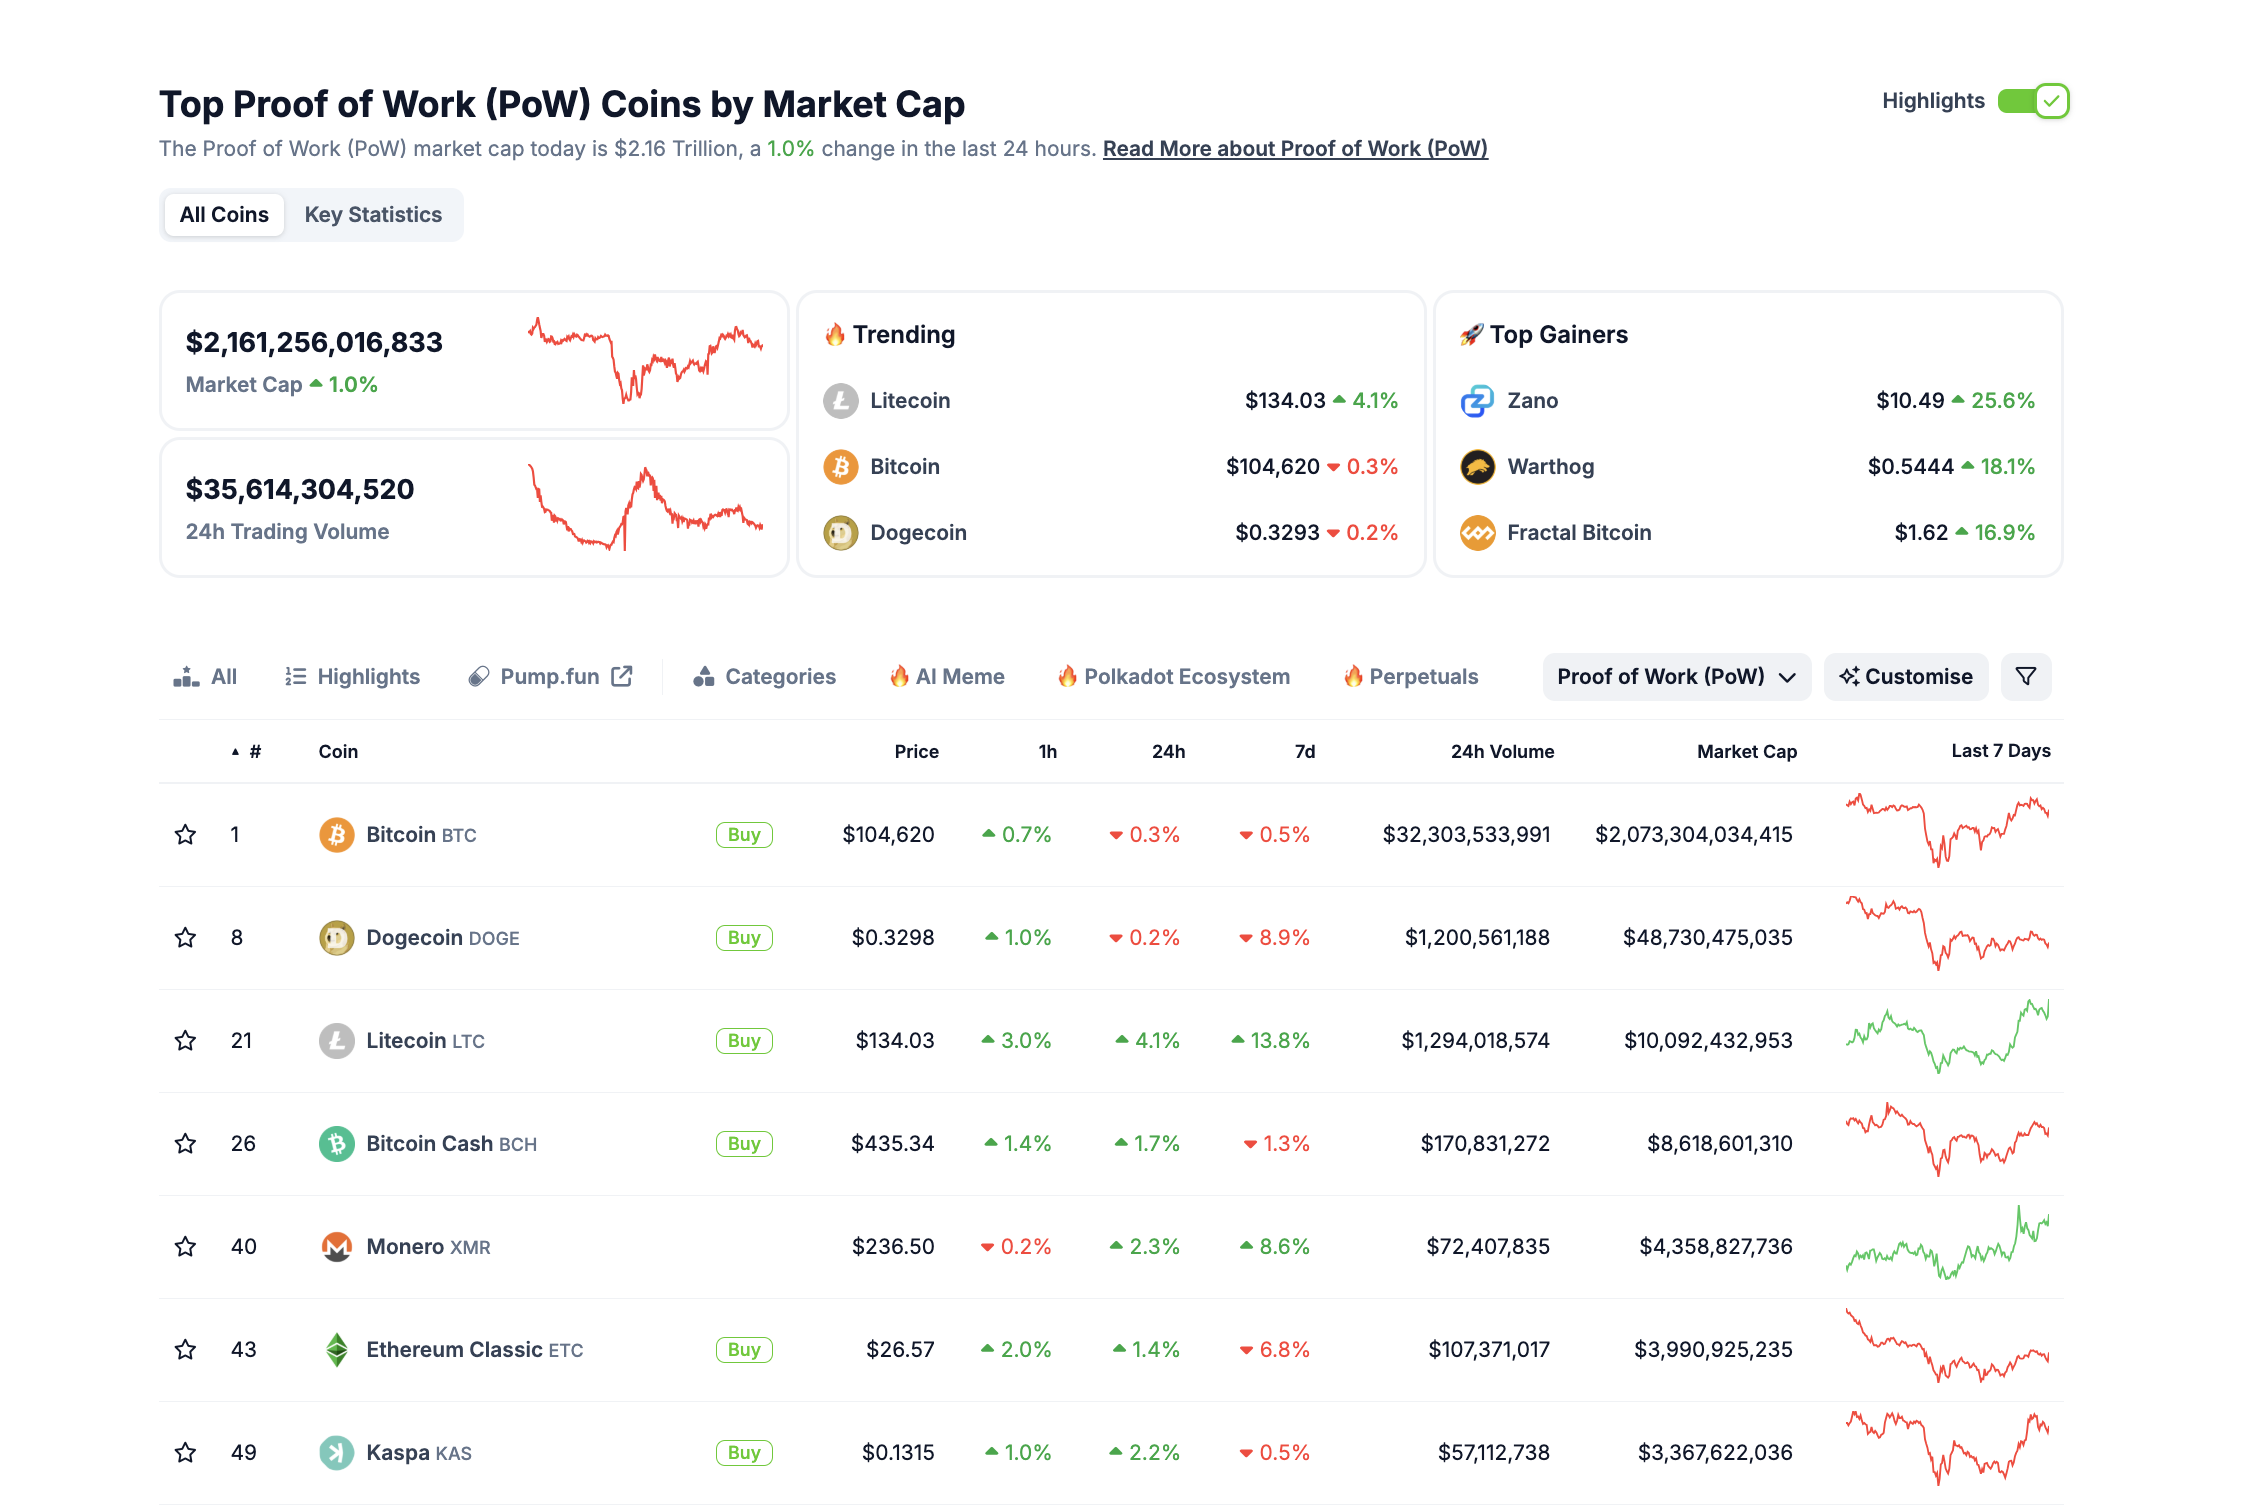 Proof of Work Sector Performance | January 31, 2025 | Source: Coingecko
Unlike Bitcoin (BTC) and Dogecoin (DOGE), which faced slight declines as capital rotated, PoW investors appeared to diversify into alternative assets like Litecoin, Bitcoin Cash (BCH) and Monero (XMR). Litecoin recorded a 13.8% weekly gain, while BCH and XMR posted respective 1.3% and 8.6% increases over the same period.
“News but expected. Even Gensler’s SEC would approve these. That said, they approved in 45 days vs waiting 240 days. I really want to interpret this as a sign the new SEC will be faster but no way to know really. Litecoin on deck, know more soon”
- Bloomberg Chief ETF Analyst, Eric Balchunas, January 30, 2025.
If LTC ETF speculation continues to drive institutional interest, Litecoin could maintain its bullish trend, with resistance at $140 being the next key level to watch. Meanwhile, PoW investors will closely monitor broader market dynamics and Bitcoin’s price action, which often dictates liquidity flows in the sector.
Litecoin Price Forecast: A $130 close could validate a $150 target
Litecoin’s recent price action reflects growing investor confidence, with LTC surging 19.66% over two days to reclaim $131.35. The price now hovers above the VWAP at $130.80, a key pivot level signaling potential continuation if bulls sustain momentum.
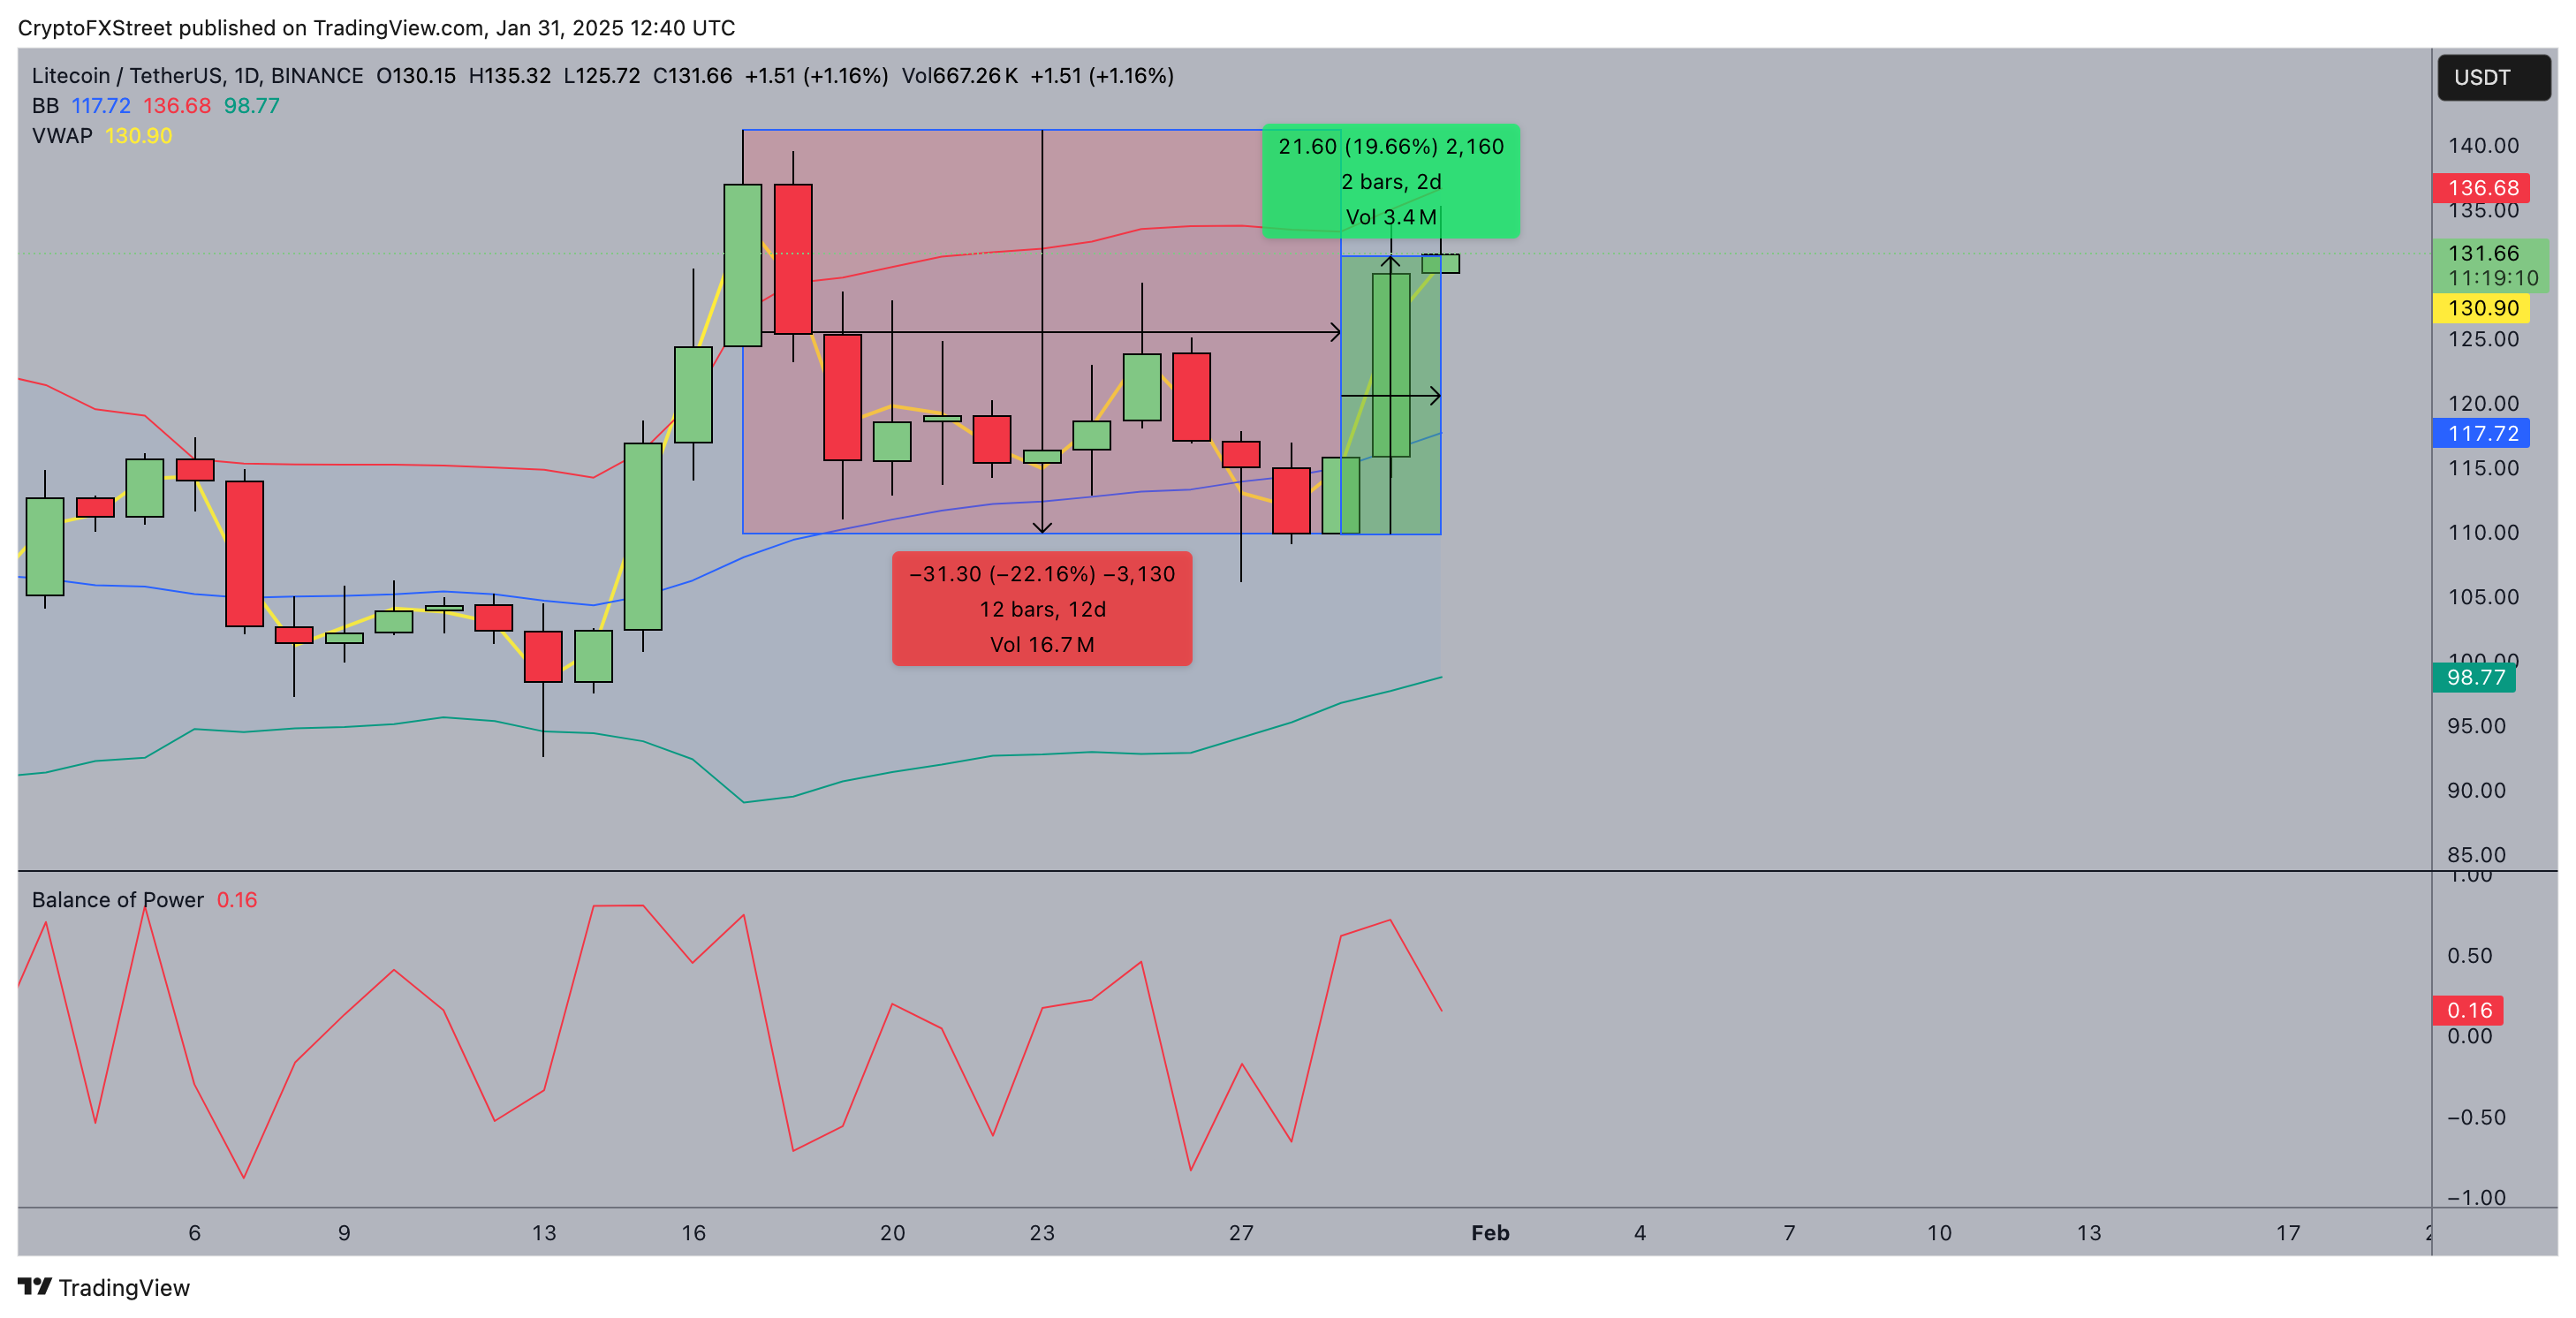 Litecoin Price Forecast | LTCUSDT
The upper Bollinger Band at $136.62 marks the next resistance, and a decisive close above it could unlock the psychological $150 target. The rebound from the lower Bollinger Band at $98.80 signals renewed accumulation after an extended downtrend, where LTC shed 22% over 12 days before reversing sharply.
Despite the bullish breakout, traders must monitor the Balance of Power indicator, currently at a neutral 0.12. This suggests demand remains steady but not yet at extreme levels, leaving room for volatility. A rejection at $135 could trigger a retest of $125 or even the VWAP support at $120, where dip buyers could re-enter. However, if momentum holds and volume sustains, Litecoin appears poised to extend gains, with ETF speculation providing an additional catalyst
Bitcoin Cash Price Forecast: $500 target in focus
Bitcoin Cash has rebounded sharply, gaining 7.59% over the past two days to reclaim $435.00. The move comes after an 11-day 17.41% decline that saw BCH find support near $400 before staging a recovery. Price is now trading just below the VWAP at $433.40, a key level that, if flipped into support, could accelerate the rally toward the psychological $500 mark.
The Parabolic SAR dots remain well above the price of $483.60, indicating that the broader downtrend is not yet fully invalidated. However, the recent bullish breakout suggests growing momentum and a sustained close above $440 could trigger a trend shift. The Balanced BBP indicator at -1.0 shows that bearish pressure has eased but is not fully reversed, leaving room for potential volatility.
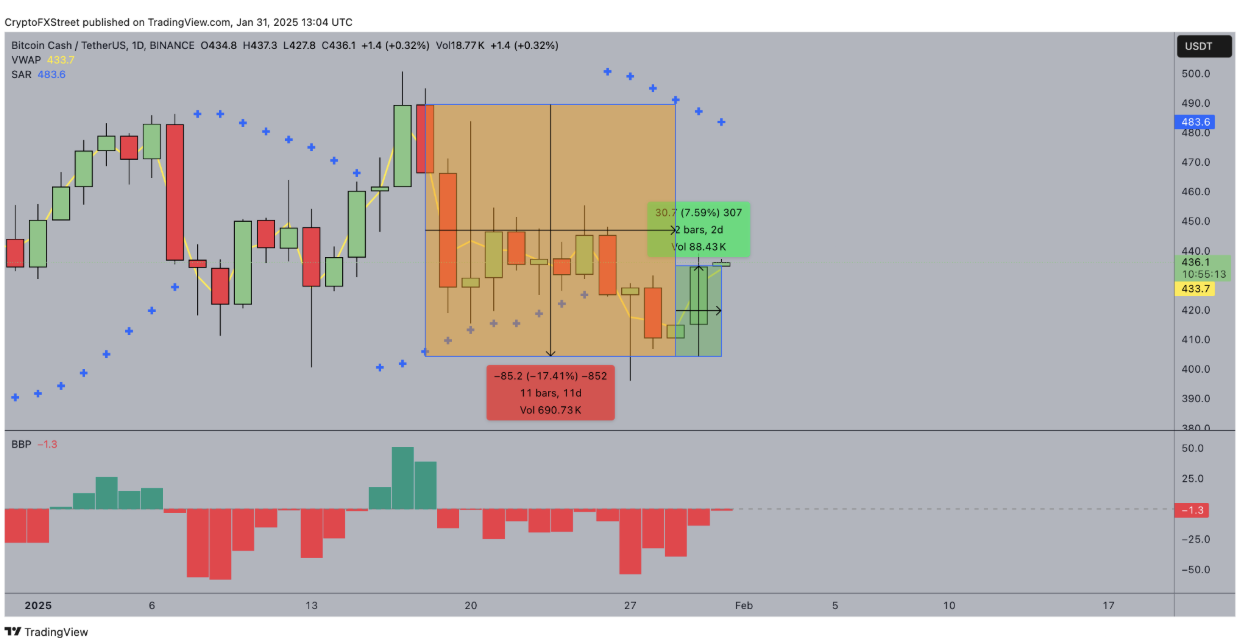
Bitcoin Cash Price Forecast (BCHUSDT)
If buyers hold the current range and push above $450, the next resistance stands at $480, where SAR alignment could confirm a trend shift.
However, failure to break above VWAP may invite sellers to test $420 or even $400 again. With increasing volume backing the rally, the bias remains cautiously bullish, with $500 becoming a viable target upon further confirmation.
Monero on the move: Can bulls maintain control above $230?
Litecoin ETF speculation and the reversal of Tornado Cash sanctions have fueled renewed optimism in the privacy coin sector, creating a dual bullish catalyst for Monero (XMR).
This narrative shift has propelled XMR into an upward trajectory, evidenced by its recent 9.5% price uptick, with a longer upward wick hinting at strong demand at higher levels.

Monero (XMR) Price Forecast
On the daily chart, XMR has broken out of a consolidation phase, with a series of higher highs and higher lows confirming bullish momentum.
The price currently trades near $234.37, slightly below the VWAP at $234.64, indicating that the market is testing short-term equilibrium. The Parabolic SAR remains firmly in an uptrend at $207.60, reinforcing the bullish outlook.
Despite these positive signals, resistance near $238.85—the session high—could trigger profit-taking, potentially leading to a retracement toward $225.
However, sustained volume expansion and continued strength in BBP at 27.25 suggest dip-buying interest. If bulls reclaim $240, XMR could accelerate towards $250. A failure to hold above $230, however, may invite selling pressure back toward the $215 region
Recommended Articles


