Ripple (XRP) News: Researcher claims XRP could reach $1,000 if Trump makes this $34 Trillion move

Source Fxstreet
  • XRP price perched above the $3.15 mark on Friday, up 13% since Trump’s inauguration. 
  • Prominent Researcher, Dr Horace Drew has speculated that President Trump could mitigate the $34 trillion federal debt by choosing XRP over Bitcoin for the US Strategic Reserve.
  • Drew also speculated that as XRP’s value skyrocketed from its current $3.15 level to as much as $1,000
     

XRP price prodded above the $3.15 mark on Friday, up 13% since Trump’s inauguration. Speculations around US adoption of cryptocurrency for strategic reserve has sparked optimistic predictions among market watchers. 

XRP price holds firm above $3 as Trump catalysts kick-in

Having run a crypto-friendly manifesto, President Donald Trump’s administration has been a major talking point among digital asset traders over the last three months.

This is especially true among Ripple (XRP) investors and a handful of privacy-focused tokens that came under intense scrutiny during the Biden administration.

In the days leading up to the inauguration, Ripple Co-founder Brad Garlinghouse confirmed his attendance at a Mar-a-Lago dinner with President Trump, heightening market speculations of the firm's positive links to the administration.

As expected, XRP's price reacted positively as President Trump leaned aggressively towards the crypto sector, launching memes, pardoning Ross Ulbricht, and appointing key figures like Paul Atkins as SEC Chair and David Sacks as Crypto Czar.

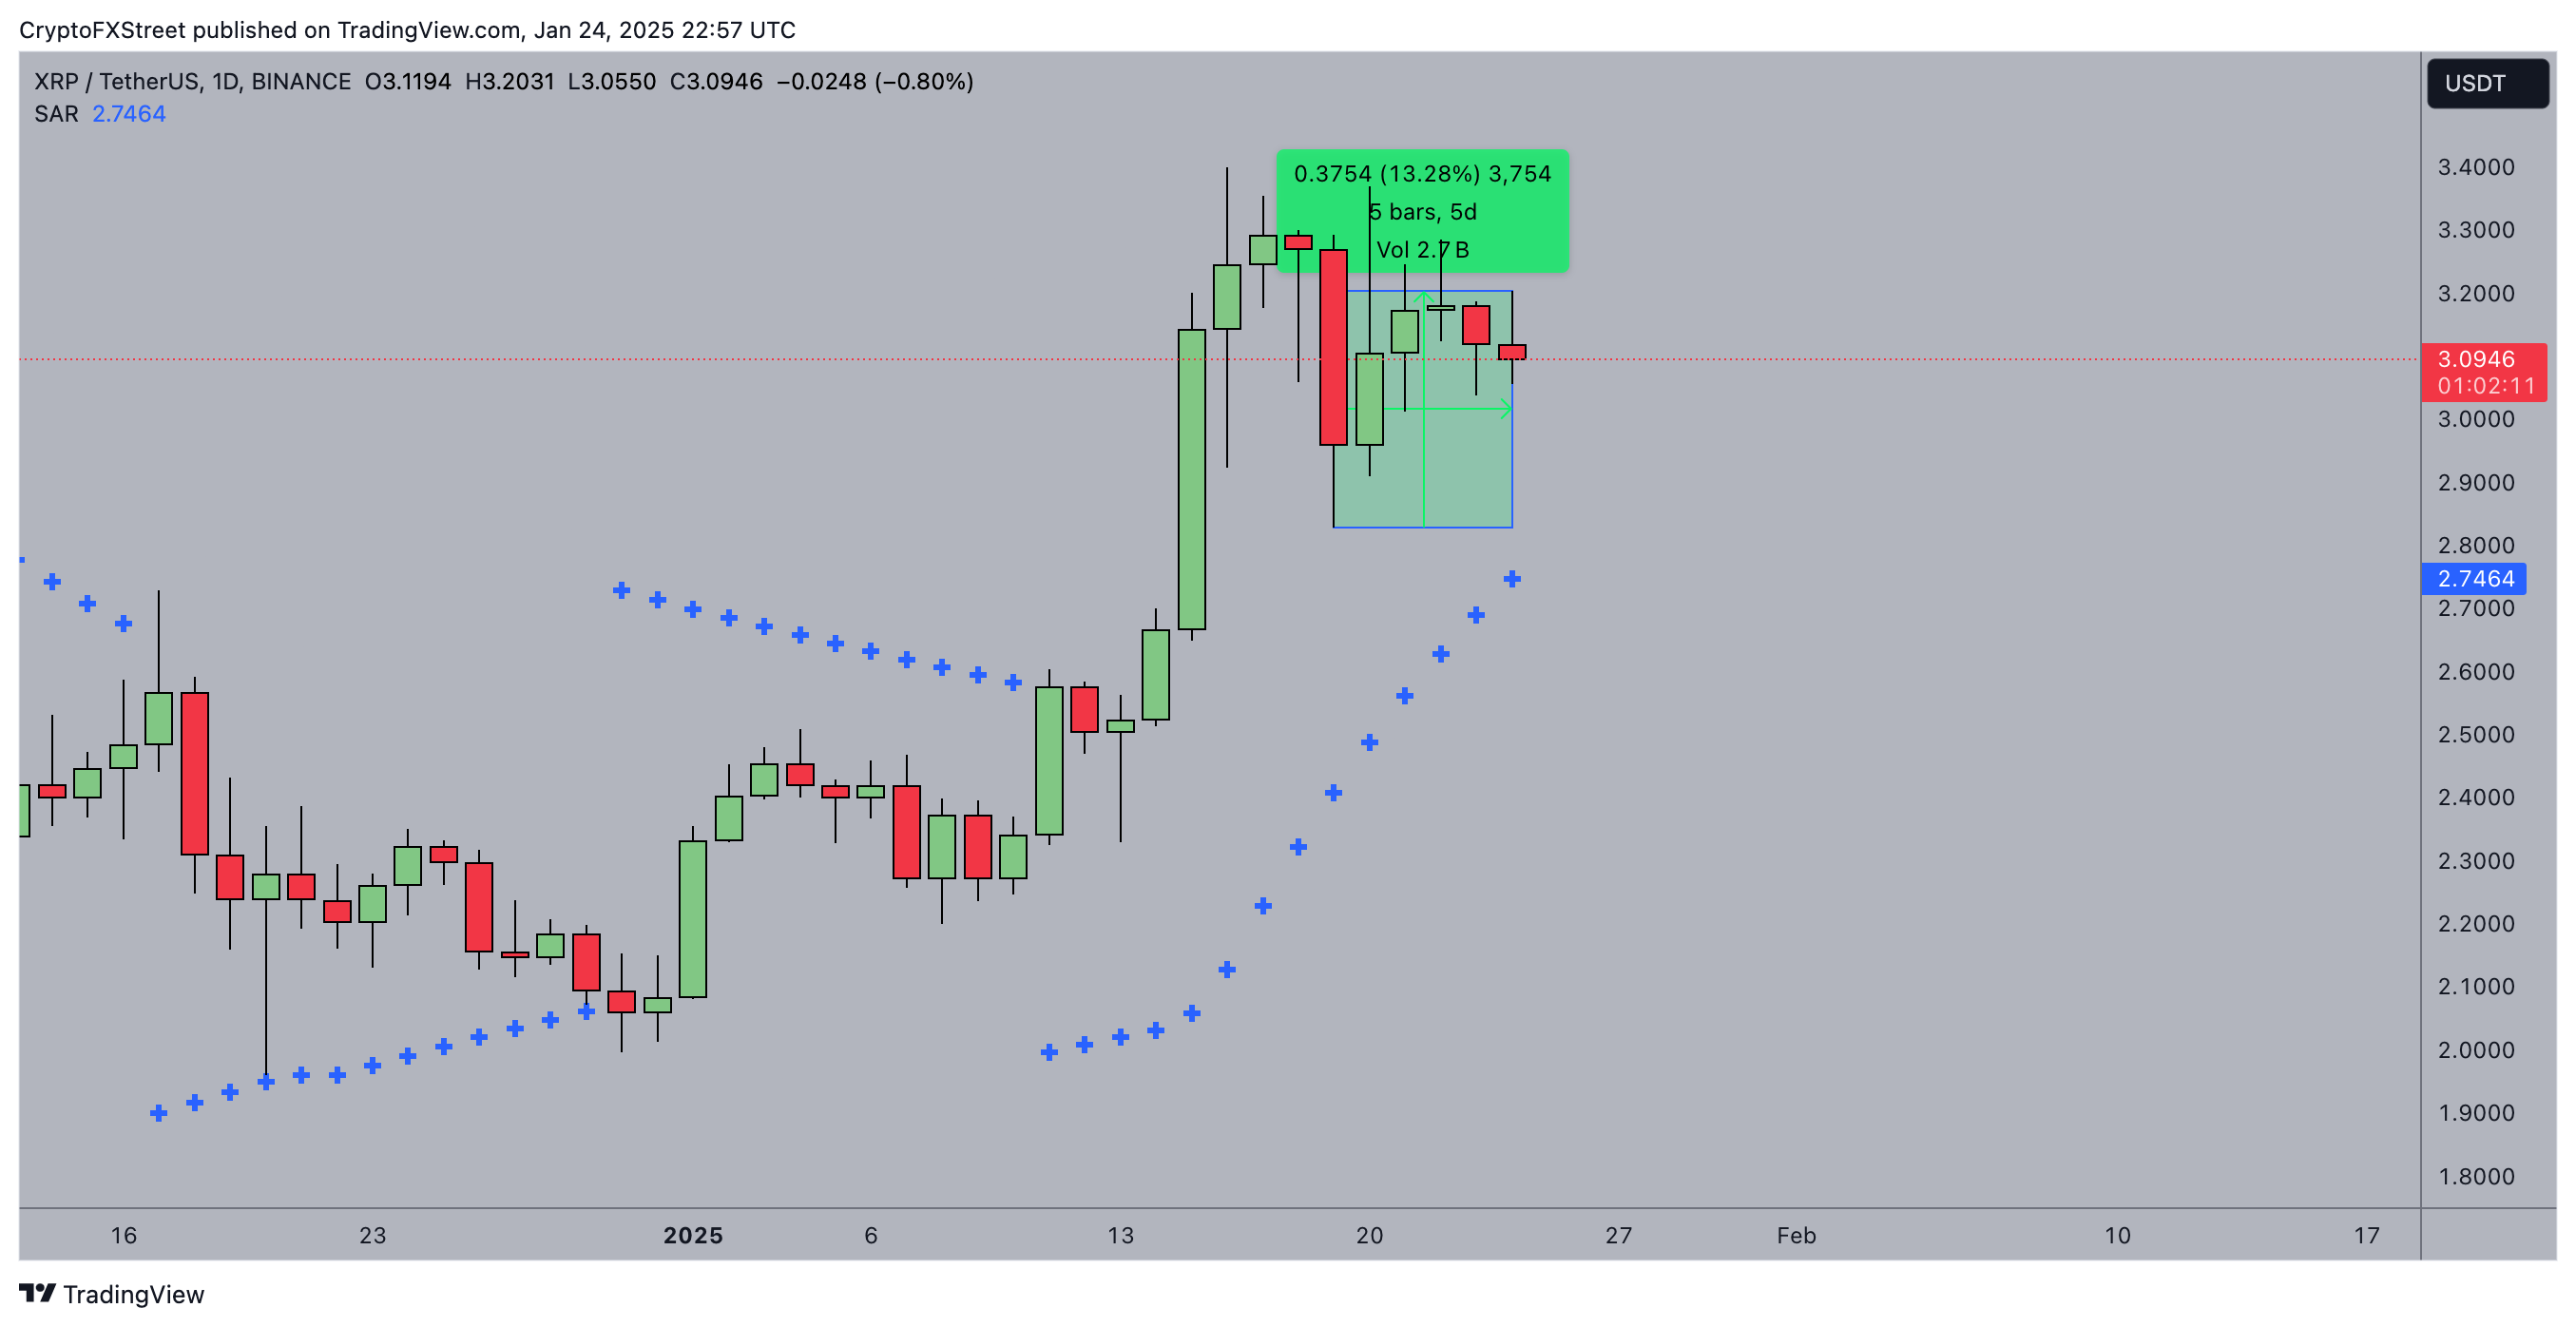
Ripple (XRP) Price Action, January 24, 2025 | Source: TradingView 

The chart above shows XRP's price moving up 13% since the inauguration, rising from $2.80 on Monday to hit $3.20 at press time on Friday.

These developments have evidently boosted investor confidence in XRP, as the Trump administration's pro-crypto stance suggests potential favorable regulatory frameworks ahead. 

DNA Scientist, Dr Horace issues $1,000 prediction if Trump replaces Bitcoin with XRP for US strategic reserve. 

Market watchers are optimistic that continued support from the highest levels of government could further propel XRP's value in the coming months.

However, those speculations heightened on Friday as  Dr Horace Drew, an Australian DNA Scientist, and recognized figure within the global XRP community issued bold price prediction targets for the Ripple-backed coin under Trump’s Presidency. 

The speculative narrative surrounding Ripple’s XRP surged to new heights as Dr. Horace Drew, an Australian DNA scientist widely recognized in the global XRP community, issued a provocative $1,000 price forecast.

Known online by his pseudonym “Red Collie,” Drew is no stranger to bold predictions, and his latest theory ties XRP’s meteoric rise to President

Trump’s potential crypto policy maneuvers.

In a series of viral tweets, Dr. Drew suggested that Trump may opt to use XRP, instead of Bitcoin, for the U.S. Strategic Reserve. His reasoning?

Bitcoin’s purchase would increase the $34 trillion federal debt, whereas utilizing Ripple’s escrowed XRP holdings—currently held by the SEC under litigation—could effectively bypass that financial burden. 

Drew speculated that as XRP’s value skyrocketed from its current $3.15 level to as much as $1,000, the U.S. could cancel its federal debt entirely while generating surplus funds for other initiatives.

“Trump is cunning like a fox,” Drew remarked, pointing to multiple “tells” that suggest Ripple’s deeper involvement in government-level strategies.

Among his claims:

  • Ripple Board Member Rosie Rios, whose signature graces U.S. $100 bills, reportedly intends to work closely with Trump.
  • Donald Trump Jr. 's crypto investments deliberately avoid XRP to prevent conflicts of interest.
  • The SEC’s legal battle with Ripple, which includes escrowed XRP as a potential penalty, hints at future government use.

Drew also cited Trump’s promises to eliminate the federal debt “right away” and cryptic posts from Ripple-affiliated communities referencing the $34 trillion figure.

However, market watchers remain cautious of the legal complexities and geopolitical risks associated with XRP’s adoption at such a scale.

While Dr. Drew’s projections are largely speculative, Nonetheless, Drew’s prediction underscores growing optimism within the “Ripple Army” as Trump’s administration kicks off. 
 

Disclaimer: For information purposes only. Past performance is not indicative of future results.
placeholder
U.S. November Nonfarm Payrolls: What Does the Rare "Weak Jobs, Strong Economy" Mix Mean for U.S. Equities?1. IntroductionAfter retreating from the late-October highs, U.S. equities embarked on a bottoming rebound in mid-to-late November, a trend driven by the interplay of multiple factors. That said, it i
Author  TradingKey
7 hours ago
1. IntroductionAfter retreating from the late-October highs, U.S. equities embarked on a bottoming rebound in mid-to-late November, a trend driven by the interplay of multiple factors. That said, it i
placeholder
Senate Delays Crypto Market Structure Hearings to Early 2026The Senate Banking Committee has postponed cryptocurrency market structure hearings until 2026, citing ongoing bipartisan negotiations.
Author  Mitrade
11 hours ago
The Senate Banking Committee has postponed cryptocurrency market structure hearings until 2026, citing ongoing bipartisan negotiations.
placeholder
Bitcoin Slides 5% as Sellers Lean In — Can BTC Reclaim $88,000?Bitcoin has dropped back below $88,000 after rolling over from $90,500, with price still trading under the 100-hour Simple Moving Average. The sell-off found a floor at $85,151, and BTC is now consolidating near that base, but rebounds are facing pressure from a bearish trend line around $89,000. Bulls need to retake $88,000–$89,000 to ease downside risk; failure to do so keeps $85,500–$85,000 and then $83,500 in play, with $80,000 as the deeper “line in the sand.” Bitcoin (BTC) is back in damage-control mode after a sharp pullback wiped out recent gains. The price failed to reclaim the $90,000–$90,500 band, rolled over, and slid through $88,500 before briefly dipping under $87,000. Buyers did show up around $85,000, but the rebound so far looks more like stabilization than a clear trend reversal. Bitcoin dips hard, finds a bid near $85,000(h3) BTC’s latest move lower began when it couldn’t build follow-through above $90,000 and $90,500. Once that upside stalled, sellers took control and pushed price down through $88,500. The slide accelerated enough to spike below $87,000, but the market didn’t free-fall. Bulls defended the $85,000 zone, printing a low at $85,151. Since then, Bitcoin has been consolidating below the 23.6% Fibonacci retracement of the drop from the $93,560 swing high to the $85,151 low — a clue that the bounce is still shallow and that sellers haven’t fully backed off yet. Structurally, BTC is still on the back foot: It’s trading below $88,000, and It remains below the 100-hour Simple Moving Average, keeping short-term trend pressure pointed downward. Resistance is layered, and $89,000 is the problem area(h3) If bulls try to turn this into a recovery, they’ll have to climb through multiple ceilings in quick succession. First, BTC faces resistance around $87,150, followed by a more meaningful barrier near $87,500. From there, the market’s attention snaps back to $88,000 — the level BTC just lost and now needs to reclaim. A close back above $88,000 would improve the tone, but it doesn’t solve the bigger issue: there’s a bearish trend line on the hourly BTC/USD chart (Kraken feed) with resistance near $89,000, which also lines up with the next technical hurdle. If BTC can push through $89,000 and hold, the rebound could extend toward $90,000, with follow-through targets at $91,000 and $91,500. But until price clears that $88,000–$89,000 zone, rallies are at risk of being sold rather than chased. If BTC fails to reclaim resistance, the downside path is clear(h3) The near-term bear case is simple: if Bitcoin can’t climb back above the $87,000 area and keep traction, sellers may attempt another leg lower. Support levels line up like this: Immediate support: $85,500 First major support: $85,000 Next support: $83,500 Then $82,500 in the near term Below that, the major “don’t break this” level is still $80,000. If BTC slips under $80,000, the risk of acceleration to the downside increases significantly — not because it’s magic, but because it’s the kind of psychological and structural level that tends to trigger forced de-risking. Indicators: momentum still leans bearish(h3) The intraday indicators aren’t offering much comfort yet: Hourly MACD is losing pace in the bearish zone. Hourly RSI remains below 50, suggesting sellers still have the upper hand on short timeframes. So while the $85,000 defense held for now, the market hasn’t flipped bullish — it’s just stopped bleeding.
Author  Mitrade
14 hours ago
Bitcoin has dropped back below $88,000 after rolling over from $90,500, with price still trading under the 100-hour Simple Moving Average. The sell-off found a floor at $85,151, and BTC is now consolidating near that base, but rebounds are facing pressure from a bearish trend line around $89,000. Bulls need to retake $88,000–$89,000 to ease downside risk; failure to do so keeps $85,500–$85,000 and then $83,500 in play, with $80,000 as the deeper “line in the sand.” Bitcoin (BTC) is back in damage-control mode after a sharp pullback wiped out recent gains. The price failed to reclaim the $90,000–$90,500 band, rolled over, and slid through $88,500 before briefly dipping under $87,000. Buyers did show up around $85,000, but the rebound so far looks more like stabilization than a clear trend reversal. Bitcoin dips hard, finds a bid near $85,000(h3) BTC’s latest move lower began when it couldn’t build follow-through above $90,000 and $90,500. Once that upside stalled, sellers took control and pushed price down through $88,500. The slide accelerated enough to spike below $87,000, but the market didn’t free-fall. Bulls defended the $85,000 zone, printing a low at $85,151. Since then, Bitcoin has been consolidating below the 23.6% Fibonacci retracement of the drop from the $93,560 swing high to the $85,151 low — a clue that the bounce is still shallow and that sellers haven’t fully backed off yet. Structurally, BTC is still on the back foot: It’s trading below $88,000, and It remains below the 100-hour Simple Moving Average, keeping short-term trend pressure pointed downward. Resistance is layered, and $89,000 is the problem area(h3) If bulls try to turn this into a recovery, they’ll have to climb through multiple ceilings in quick succession. First, BTC faces resistance around $87,150, followed by a more meaningful barrier near $87,500. From there, the market’s attention snaps back to $88,000 — the level BTC just lost and now needs to reclaim. A close back above $88,000 would improve the tone, but it doesn’t solve the bigger issue: there’s a bearish trend line on the hourly BTC/USD chart (Kraken feed) with resistance near $89,000, which also lines up with the next technical hurdle. If BTC can push through $89,000 and hold, the rebound could extend toward $90,000, with follow-through targets at $91,000 and $91,500. But until price clears that $88,000–$89,000 zone, rallies are at risk of being sold rather than chased. If BTC fails to reclaim resistance, the downside path is clear(h3) The near-term bear case is simple: if Bitcoin can’t climb back above the $87,000 area and keep traction, sellers may attempt another leg lower. Support levels line up like this: Immediate support: $85,500 First major support: $85,000 Next support: $83,500 Then $82,500 in the near term Below that, the major “don’t break this” level is still $80,000. If BTC slips under $80,000, the risk of acceleration to the downside increases significantly — not because it’s magic, but because it’s the kind of psychological and structural level that tends to trigger forced de-risking. Indicators: momentum still leans bearish(h3) The intraday indicators aren’t offering much comfort yet: Hourly MACD is losing pace in the bearish zone. Hourly RSI remains below 50, suggesting sellers still have the upper hand on short timeframes. So while the $85,000 defense held for now, the market hasn’t flipped bullish — it’s just stopped bleeding.
placeholder
AUD/USD remains depressed below mid-0.6600s; downside seems limited ahead of US NFP reportThe AUD/USD pair attracts some sellers for the fourth straight day on Tuesday and trades around the 0.6630 region, down just over 0.10%, during the Asian session.
Author  FXStreet
16 hours ago
The AUD/USD pair attracts some sellers for the fourth straight day on Tuesday and trades around the 0.6630 region, down just over 0.10%, during the Asian session.
placeholder
Macro Analysts: Hawkish Japan Could Push Bitcoin Below $70KAnalysts predict Bitcoin may face further declines towards the $70,000 mark if the Bank of Japan raises interest rates as expected.
Author  Mitrade
Yesterday 05: 48
Analysts predict Bitcoin may face further declines towards the $70,000 mark if the Bank of Japan raises interest rates as expected.
goTop
quote