

Uniswap Aims For Recovery – Bulls Take A Stand At $12.3 Support

Source Newsbtc

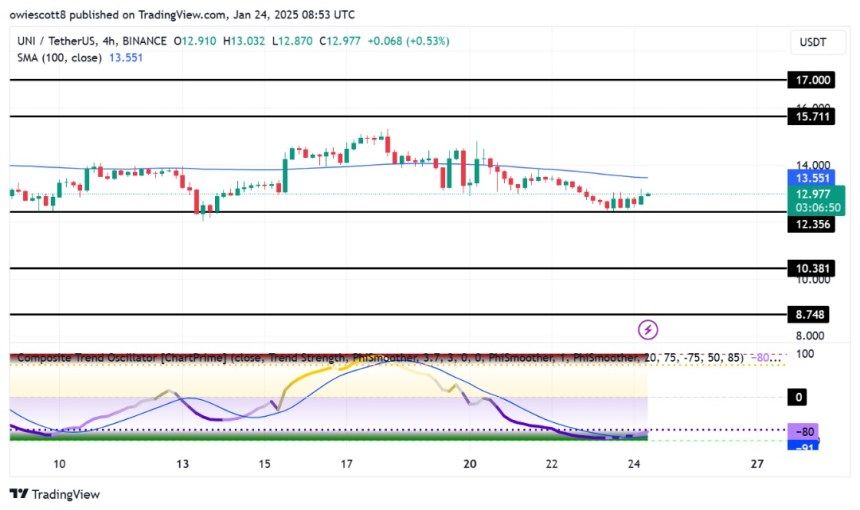
Uniswap is making a determined effort to bounce back, with bulls stepping up to defend the crucial $12.3 support level. This price point has become a pivotal battleground since it could pave the way for a potential recovery or signal further bearish momentum. The recent price action highlights growing buyer interest at this level, suggesting that market sentiment may be tilting cautiously in favor of the bulls. 

If the bulls succeed in maintaining this support, UNI could gain the momentum needed to test higher resistance levels, potentially setting the stage for a broader upward move. The coming sessions will be pivotal in shaping Uniswap’s trajectory as traders closely monitor this key level.

Price Action And Technical Indicators Highlight Rebound Potential

Uniswap’s price action at the $12.3 support level is gaining significant attention from traders and market analysts as it approaches a crucial technical juncture. The $12.3 mark has held as support in recent price cycles, and its ability to continue doing so will be key to determining whether the bulls can regain control.

Currently, UNI is moving toward the 100-day Simple Moving Average (SMA), a widely followed indicator that tends to act as both support and resistance during trend transitions. Adding to the positive outlook, the Composite Trend Oscillator’s recent move toward oversold territory signals a possible market correction or reversal.
Uniswap

As the indicator shows signs of improvement, it suggests that negative strength may be weakening, allowing buying pressure to take over. A rise from oversold levels would indicate a shift toward a more favorable market for buyers, reinforcing the likelihood of a price rebound.

Collectively, the 100-day SMA and the Composite Trend Oscillator provide a strong technical case for recovery at the $12.3 level. However, this bullish outlook is contingent on the ability of the price to move above the 100-day SMA and for the RSI to continue showing signs of strength.

Market Momentum Shifts: Will Uniswap Bulls Prevail?

Market momentum for Uniswap is showing early signs of a shift, with recent price action showing that bulls may be regaining control. If the bulls can sustain this strength, UNI’s price could break above the 4-hour SMA, which would cause a rally toward the $15.7 resistance level and beyond.

However, the market remains cautious as failing to defend the $12.3 level hints at increased selling pressure, pushing prices lower toward the $10 support mark. Furthermore, a decisive break below this key level might trigger further losses, bringing additional support levels into focus as the bearish momentum continues.

Uniswap
Disclaimer: For information purposes only. Past performance is not indicative of future results.
placeholder
US August CPI lands tonight: after a 5.4% PPI shock, will the Fed hike on September 16?US August PPI came in at 5.4% year-on-year, above the 5.3% consensus, with core PPI at 4.6%. Traders have pushed the odds of a 25bp Fed hike on September 15-16 to around 70%. Tonight's CPI is the last major inflation print before the decision — here is the full calendar, the consensus numbers, and what a hot versus cool reading would mean for the dollar, yields, gold and stocks.
Author  Irene Q.
Sep 11, Fri
US August PPI came in at 5.4% year-on-year, above the 5.3% consensus, with core PPI at 4.6%. Traders have pushed the odds of a 25bp Fed hike on September 15-16 to around 70%. Tonight's CPI is the last major inflation print before the decision — here is the full calendar, the consensus numbers, and what a hot versus cool reading would mean for the dollar, yields, gold and stocks.
placeholder
Brent tests $108 as a key export pipeline stays shut — can the rally clear $110?Brent crude rose 2.55% to $106.97 and WTI 2.32% to $102.30 as a major regional export pipeline remained offline with no restart timeline. Front-month backwardation has widened to $5.53 from $3.84 a week ago, European gas is at its highest since December 2022, and one analyst sees $119.48 if talks stall.
Author  Irene Q.
Yesterday 07: 16
Brent crude rose 2.55% to $106.97 and WTI 2.32% to $102.30 as a major regional export pipeline remained offline with no restart timeline. Front-month backwardation has widened to $5.53 from $3.84 a week ago, European gas is at its highest since December 2022, and one analyst sees $119.48 if talks stall.
placeholder
Fed hike odds near 90% into Wednesday's decision — how to trade the dollar, gold and the S&P 500A 0.3% monthly core CPI print has lifted the market-implied probability of a 25bp Fed hike on 16 September to roughly 86.5% ~ 90%, which would be the first increase since July 2023. Here is the decision timeline, the pricing versus the forecasts, both scenarios, and the key levels for the dollar, gold and the S&P 500.
Author  Suzie
Yesterday 07: 49
A 0.3% monthly core CPI print has lifted the market-implied probability of a 25bp Fed hike on 16 September to roughly 86.5% ~ 90%, which would be the first increase since July 2023. Here is the decision timeline, the pricing versus the forecasts, both scenarios, and the key levels for the dollar, gold and the S&P 500.
placeholder
Silver Price Forecast: XAG/USD falls to near $63.50 amid Fed hike bets, higher oil pricesSilver price (XAG/USD) loses its gains from the previous day, trading around $63.50 per troy ounce during Asian hours on Monday. Non-yielding Silver is currently facing significant headwinds driven by rising Federal Reserve (Fed) rate-hike expectations for the upcoming September decision.
Author  FXStreet
Yesterday 10: 37
Silver price (XAG/USD) loses its gains from the previous day, trading around $63.50 per troy ounce during Asian hours on Monday. Non-yielding Silver is currently facing significant headwinds driven by rising Federal Reserve (Fed) rate-hike expectations for the upcoming September decision.
placeholder
【Daily Brief】10-year Treasury yield briefly tops 5%, S&P 500 slips to 7,602 and the dollar firms at 99.3 as the Fed's decision eve beginsThe 10-year Treasury yield touched 5.014% on Monday — its first print above 5% since October 2023 — while the S&P 500 closed 0.48% lower at 7,619.98 and the dollar index firmed to 99.3. Here is the full market wrap ahead of Wednesday's FOMC decision, the dot plot and the August retail sales report, plus today's CLARITY Act Senate vote.
Author  Irene Q.
3 hours ago
The 10-year Treasury yield touched 5.014% on Monday — its first print above 5% since October 2023 — while the S&P 500 closed 0.48% lower at 7,619.98 and the dollar index firmed to 99.3. Here is the full market wrap ahead of Wednesday's FOMC decision, the dot plot and the August retail sales report, plus today's CLARITY Act Senate vote.
goTop
quote