Here’s why Bonk Inu price could lead the meme coin pack with 30% rally
- Bonk Inu price has formed the rare Adam and Eve pattern, suggesting a trend reversal.
- The recent breakout and retest of the $0.000012397 level suggests that the rally is around the corner.
- A twelve-hour candlestick close below $0.000011747 will invalidate the bullish bias for BONK.
Bonk Inu (BONK) price seems to be primed for a quick move to the upside as it breached a three-week consolidation pattern. If the outlook remains bullish in the markets, BONK holders are in for a treat.
Also read: Dogecoin price eyes double digit gains as DOGE bulls make a comeback
Bonk Inu price triggers breakout rally
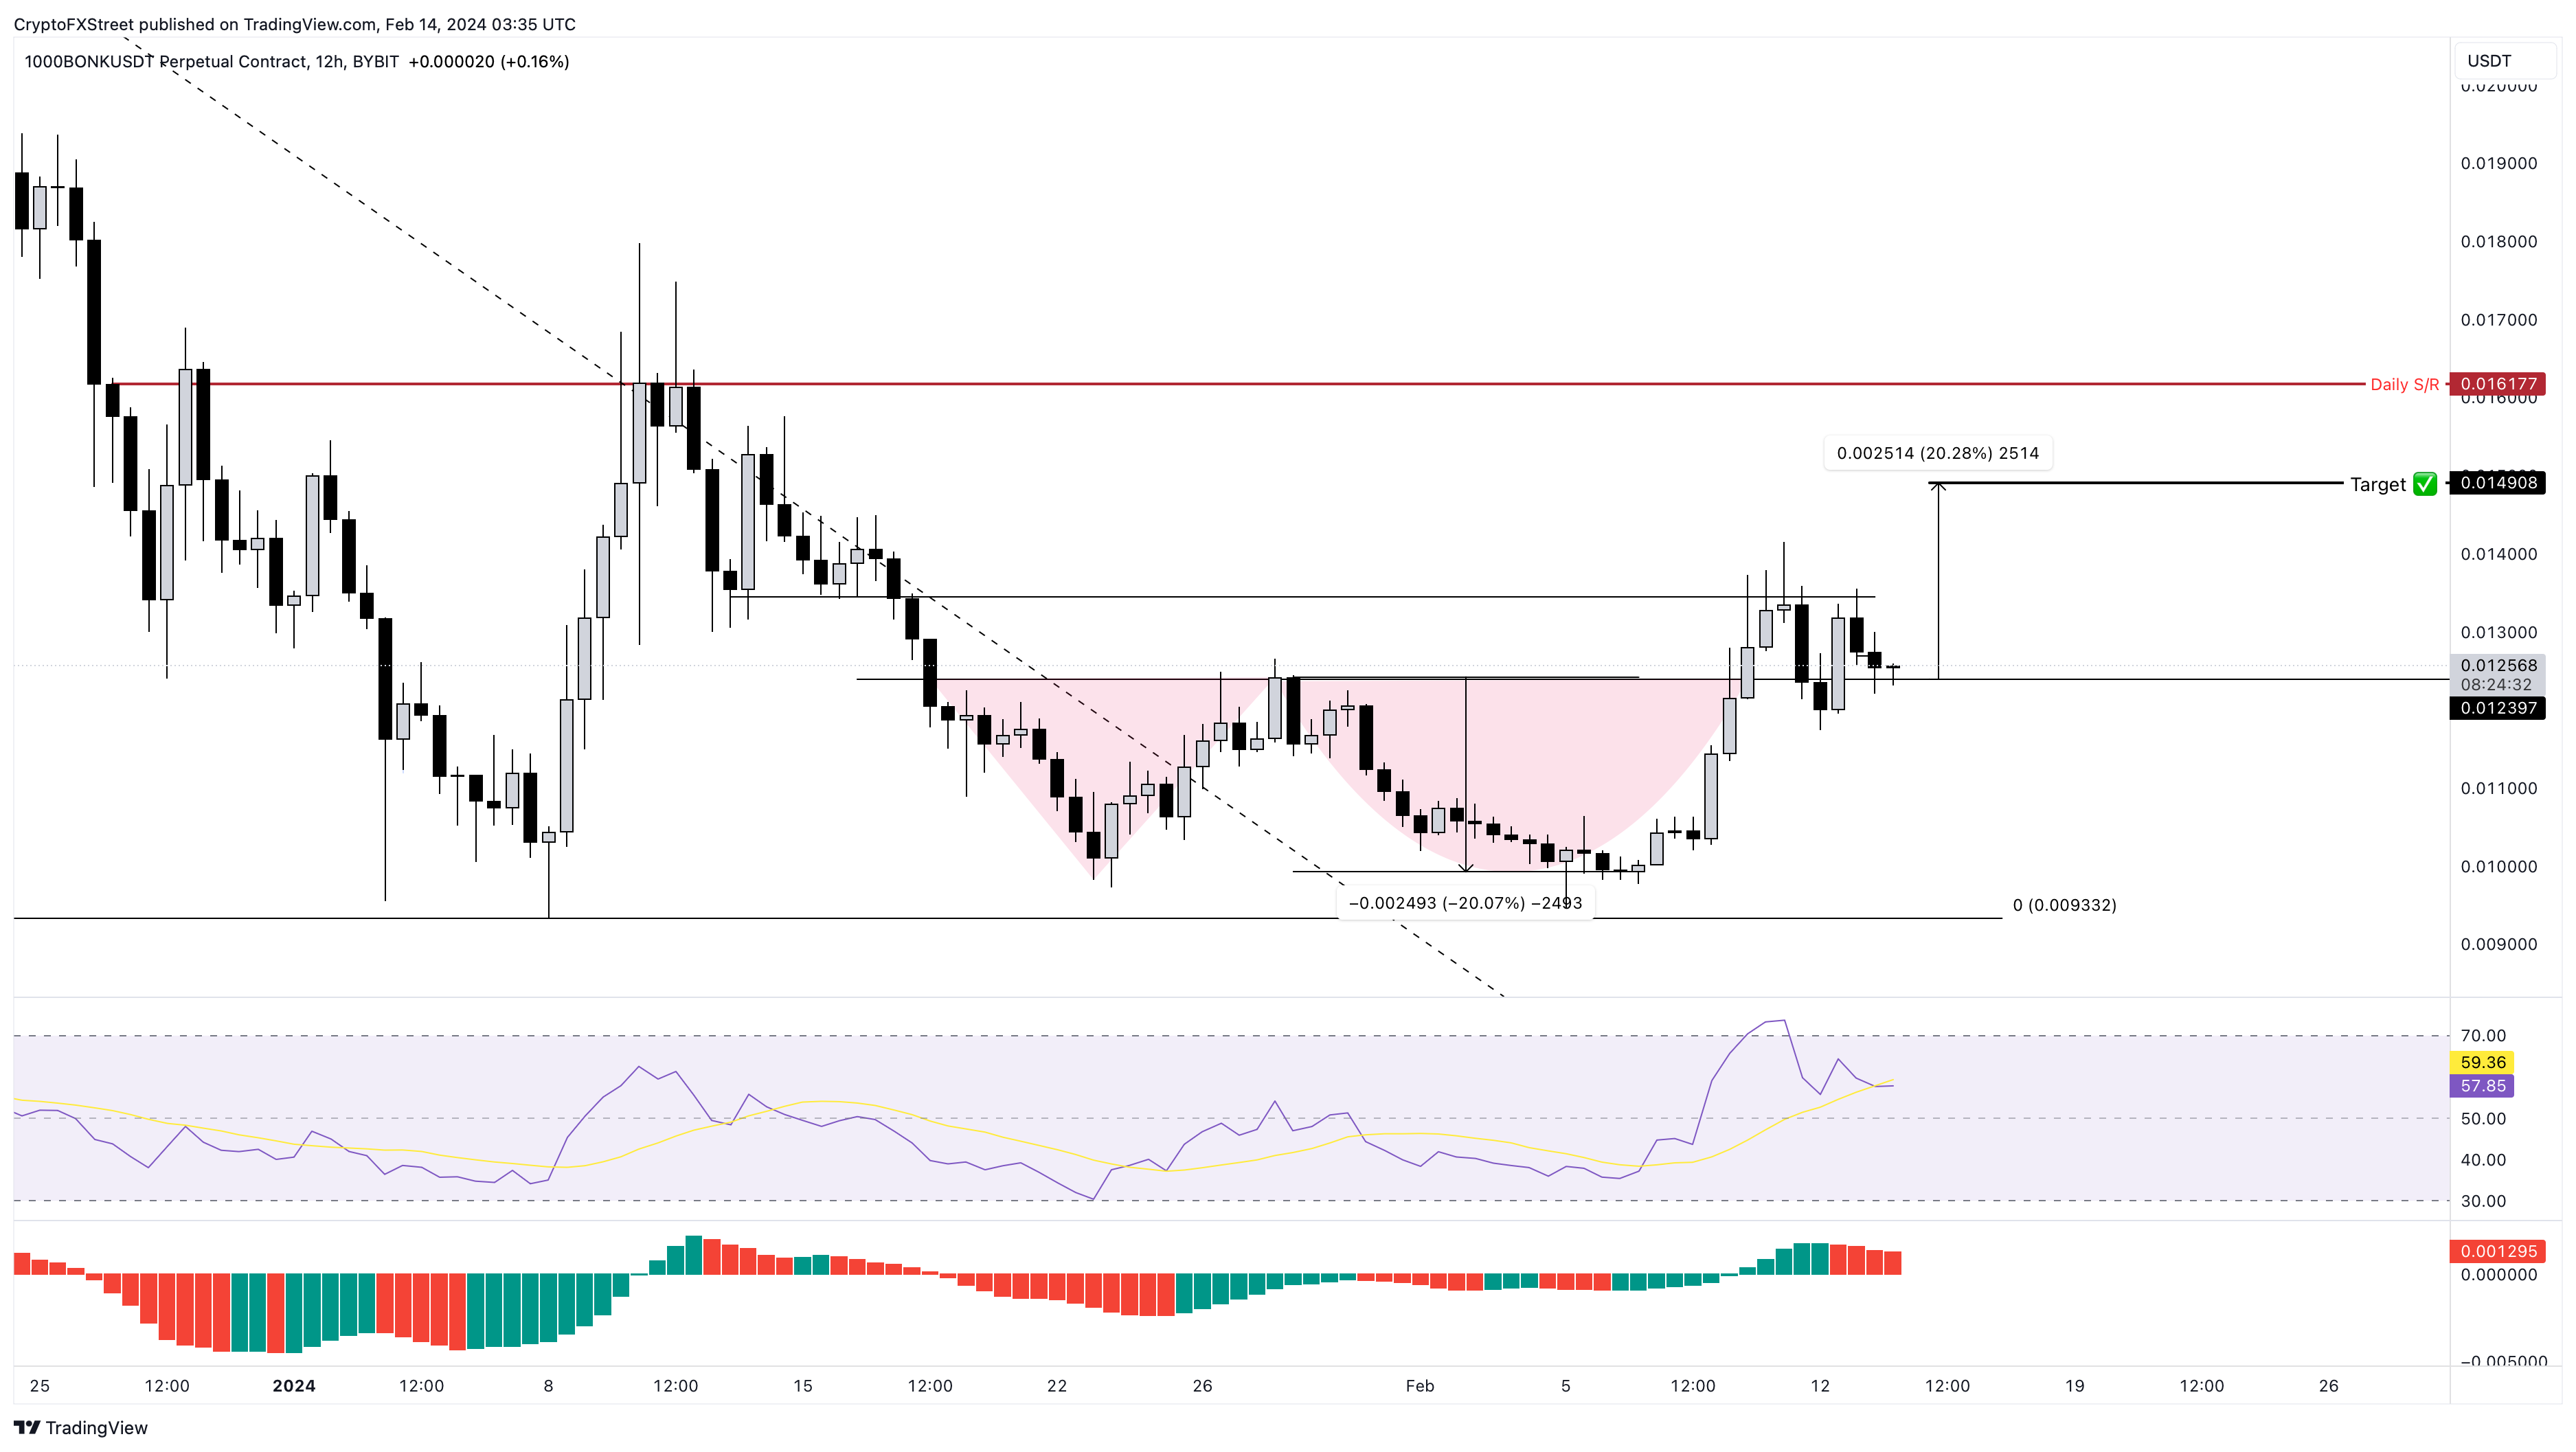
Bonk Inu price consolidation for the last three weeks has resulted in the formation of the Adam and Eve pattern.
The Adam and Eve chart pattern represents a distinctive formation that indicates potential trend reversals in the market. It is characterized by a sharp, V-shaped 'Adam' peak followed by a more gradual, rounded 'Eve' trough.
This technical formation forecasts a 20% upswing to $0.000014908, obtained by measuring the depth of the rounded bottom trough known as Eve and adding to the breakout point at $0.000012397.
On February 10, Bonk Inu price breached the horizontal resistance level at $0.000012397 and is currently retesting it in a bid to confirm a flip of the aforementioned level. Going forward, investors can still expect a 20% move from BONK in the coming days.
Ideally, the Bonk Inu price rally could extend higher and retest the daily resistance level at $0.000016177, bringing the total gain from 20% to 30%
Both the Relative Strength Index and the Awesome Oscillator are in a favorable position to help propel BONK higher.
Read more: BONK price crash leads to half a million Dollars in liquidations

BONK/USDT 12-hour chart
On the other hand, if Bonk Inu price produces a twelve-hour candlestick close below $0.000011747, it will invalidate the bullish for BONK by setting up a lower low. Under these conditions, BONK could slide 20% to collect the sell-side liquidity below $0.000009332.
Also read: Dogecoin price struggles to recover despite fast-paced wallet growth


