

Bitcoin Price Forecast: BTC recovers ahead of US CPI data release
Bitcoin price today: $97,200
- Bitcoin price recovers, trading above $97,000 on Wednesday after retesting its key psychological level of $90,000 earlier this week.
- Traders should be cautious as BTC expects volatility in the upcoming US CPI data release.
- A K33 report predicts Donald Trump will pursue expansionary policies, extend 2017 tax cuts, and offer more relief for working-class Americans, boosting risk assets.
Bitcoin (BTC) continues its recovery, trading above $97,000 on Wednesday after retesting its key psychological level at $90,000 earlier this week. The upcoming US Consumer Price Index (CPI) data release could bring volatility to Bitcoin, and traders should watch for it.
A K33 report this week predicts Trump will pursue expansionary policies to extend the 2017 tax cuts and add further tax relief for working-class Americans, boosting risk assets like Bitcoin.
Bitcoin expects volatility ahead of US CPI data
Bitcoin’s price recovery continues on Wednesday, trading above $97,200 after rebounding from the $90,000 psychological level earlier this week.
“Softer-than-expected inflation data from the US helped pause the recent surge in the US Treasury bond yields and boosted investors’ appetite for riskier assets,” reports FXStreet analyst Haresh Menghani.
Menghani explained further that the US Bureau of Labor Statistics reported on Tuesday that the Producer Price Index (PPI), which measures wholesale inflation, rose 0.2% in December, below the 0.3% expected and the 0.4% reading in November. The core gauge remained flat during the reported month. This comes after the upbeat US monthly jobs report on Friday and makes it difficult for investors to project the Federal Reserve’s (Fed) next moves on interest rates, which keeps the US Dollar bulls on the defensive. Meanwhile, risky assets like Bitcoin recovered slightly on Tuesday.
Moreover, Senior Analyst at FXStreet Yohay Elam reports, “After the warm-up on Tuesday, the main event awaits on Wednesday – America’s first read of consumer inflation.”
Elam continued, “The most important figure to watch is core CPI MoM, which rose by 0.3% in the past four months. The annualized rate of 0.3% MoM is roughly 3.6%, which is too high. A 2% core inflation rate is desired, and getting closer to that level would allow the Fed to cut interest rates.”
If the Fed decides to cut rates, it would boost demand for risky assets like Bitcoin and other cryptocurrencies, and investors would begin favoring higher-yield investment products.
Bitcoin highly correlated with Nasdaq – K33 Research report
Tuesday’s K33 Research “Ahead of the curve” report explained that the crypto market is caught in the same headwinds blazing through global markets.
The report explains that the rising 10-year yields, a strengthening US Dollar (USD), and reduced Fed interest cut expectations amid higher inflation expectations have curtailed marked wide momentum and pushed BTC lower, reaching levels below $90,000.
Moreover, in the past month, BTC and Nasdaq have seen higher correlations, with the current 30-day correlation between BTC and Nasdaq sitting at 2024 highs, as shown in the graph below.
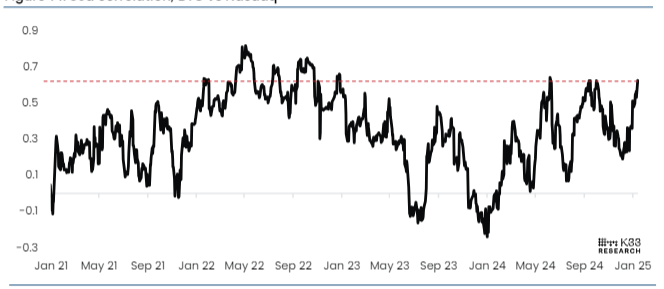
BTC Vs. Nasdaq correlation chart. Source: K33 Research
K33’s analyst explains, “Trump is expected to run expansionary policies, extend the 2017 tax cuts and add further tax relief for working-class Americans, all policies that should benefit risk assets broadly.”
The analyst continued that Trump is expected to bring forward favorable crypto policies, which, in turn, should reflect well on the crypto market.
In an interview with Bloomberg on Tuesday, VanEck’s CEO, Jan van Eck, explained that vicious drawdowns up to 25% have historically been seen in Bitcoin in the past year as investors taking profits.
He further explains that it is disappointing that Bitcoin has had a high correlation with the Nasdaq over the last six months.
Eck continued, “Just as many people are looking at it for the first time, that’s not what you want. If you look at the ten-year correlations, they are almost zero, which is really what diversification should be. We’ll have to see how Bitcoin performs going forward.”
Bitcoin Price Forecast: BTC in recovery mode
Bitcoin price dipped, reaching a low of $89,256, but recovered quickly and closed above $94,500 on Monday. On Tuesday, it rebounded by 2.14% and closed above $96,500. At the time of writing on Wednesday, it continues its recovery, trading around $97,200.
If BTC continues its recovery and closes above the $100,000 level, it could extend the rally to retest the December 17, 2024, all-time high of $108,353.
The Relative Strength Index on the daily chart reads 52, above its neutral level of 50 and points upwards, indicating a rise in bullish momentum. Additionally, the Moving Average Convergence Divergence (MACD) indicator is about to flip a bullish crossover. If the MACD line closes above the signal line, it would give a buy signal and suggest an uptrend.
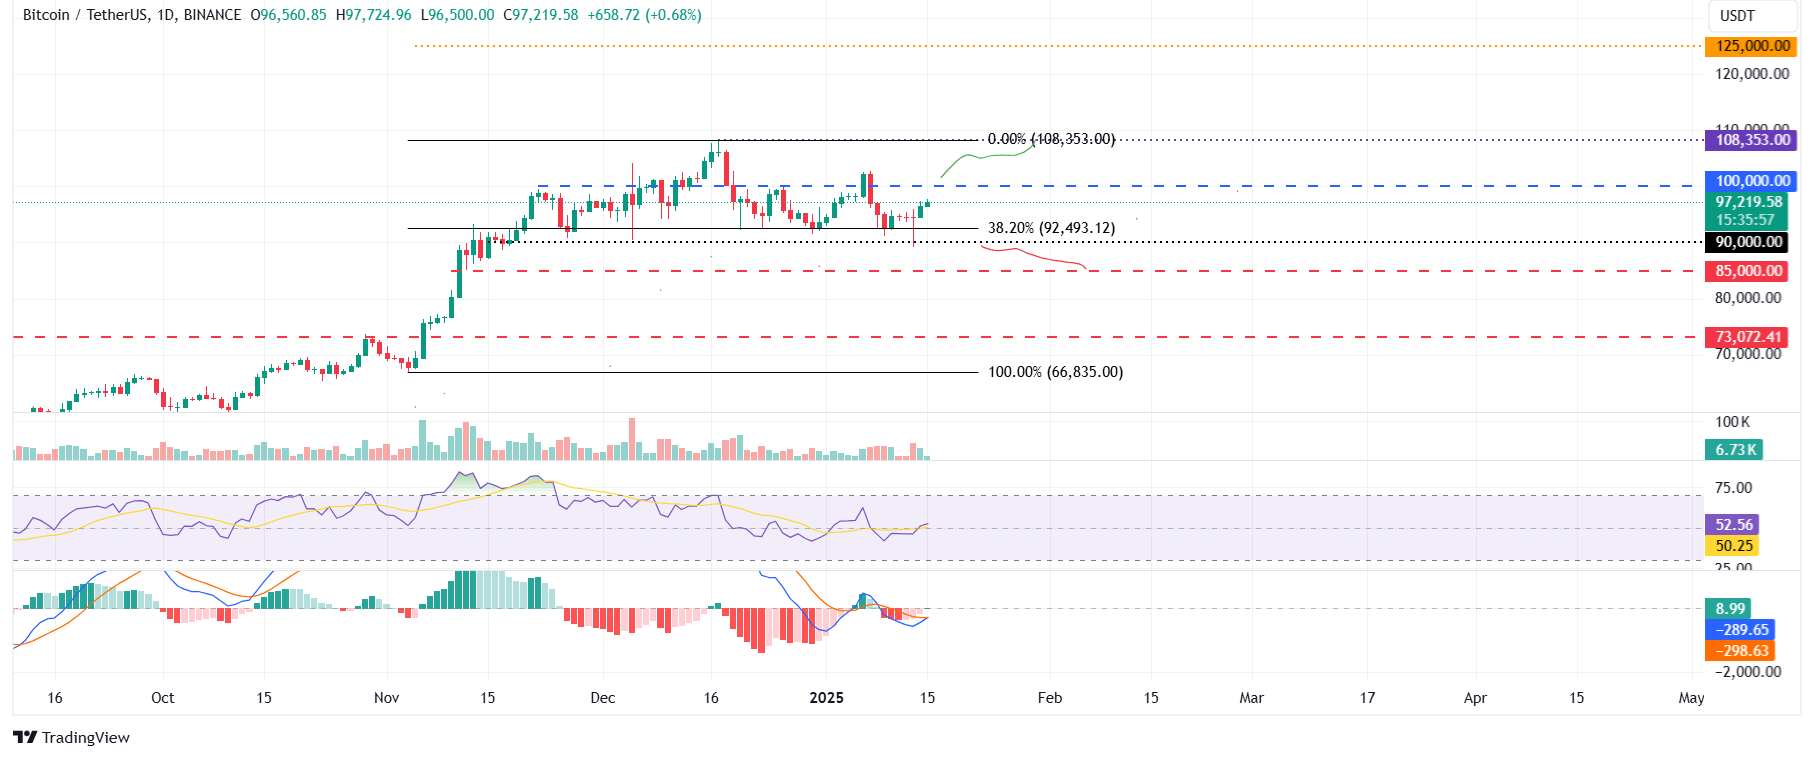
BTC/USDT daily chart
However, if BTC continues its correction and closes below $90,000, it will extend an additional decline to retest its next support level at $85,000.
Bitcoin, altcoins, stablecoins FAQs
Bitcoin is the largest cryptocurrency by market capitalization, a virtual currency designed to serve as money. This form of payment cannot be controlled by any one person, group, or entity, which eliminates the need for third-party participation during financial transactions.
Altcoins are any cryptocurrency apart from Bitcoin, but some also regard Ethereum as a non-altcoin because it is from these two cryptocurrencies that forking happens. If this is true, then Litecoin is the first altcoin, forked from the Bitcoin protocol and, therefore, an “improved” version of it.
Stablecoins are cryptocurrencies designed to have a stable price, with their value backed by a reserve of the asset it represents. To achieve this, the value of any one stablecoin is pegged to a commodity or financial instrument, such as the US Dollar (USD), with its supply regulated by an algorithm or demand. The main goal of stablecoins is to provide an on/off-ramp for investors willing to trade and invest in cryptocurrencies. Stablecoins also allow investors to store value since cryptocurrencies, in general, are subject to volatility.
Bitcoin dominance is the ratio of Bitcoin's market capitalization to the total market capitalization of all cryptocurrencies combined. It provides a clear picture of Bitcoin’s interest among investors. A high BTC dominance typically happens before and during a bull run, in which investors resort to investing in relatively stable and high market capitalization cryptocurrency like Bitcoin. A drop in BTC dominance usually means that investors are moving their capital and/or profits to altcoins in a quest for higher returns, which usually triggers an explosion of altcoin rallies.
Recommended Articles


