

Cardano Price Prediction: ADA continues to find buyers as BTC recovers
- Cardano price rebounded 4% on Friday, reclaiming the $0.95 territory as BTC reclaimed the $95,000 mark.
- On-chain data shows ADA daily trading volumes remain elevated despite the market-wide correction phase.
- Technical indicators suggest ADA faces stiff resistance at the $1.10 level.
Cardano price rebounded 4% on Friday, reclaiming the $0.95 territory as BTC reached the $95,000 mark. On-chain data shows ADA market demand remains elevated despite the recent price volatility.
Cardano retakes $0.95 as market recovery signals emerge
Cardano price has endured a turbulent week, driven by two significant bearish macro catalysts that triggered widespread sell-offs.
The strong United States (US) employment data amplified fears of a hawkish Federal Reserve (Fed), leading to heightened risk aversion among investors.
Compounding the pressure, a US court approved the Department of Justice’s (DOJ) request to sell $6.5 billion worth of Bitcoin seized from the Silk Road.
Together, these developments cast a shadow over the altcoin market this week.
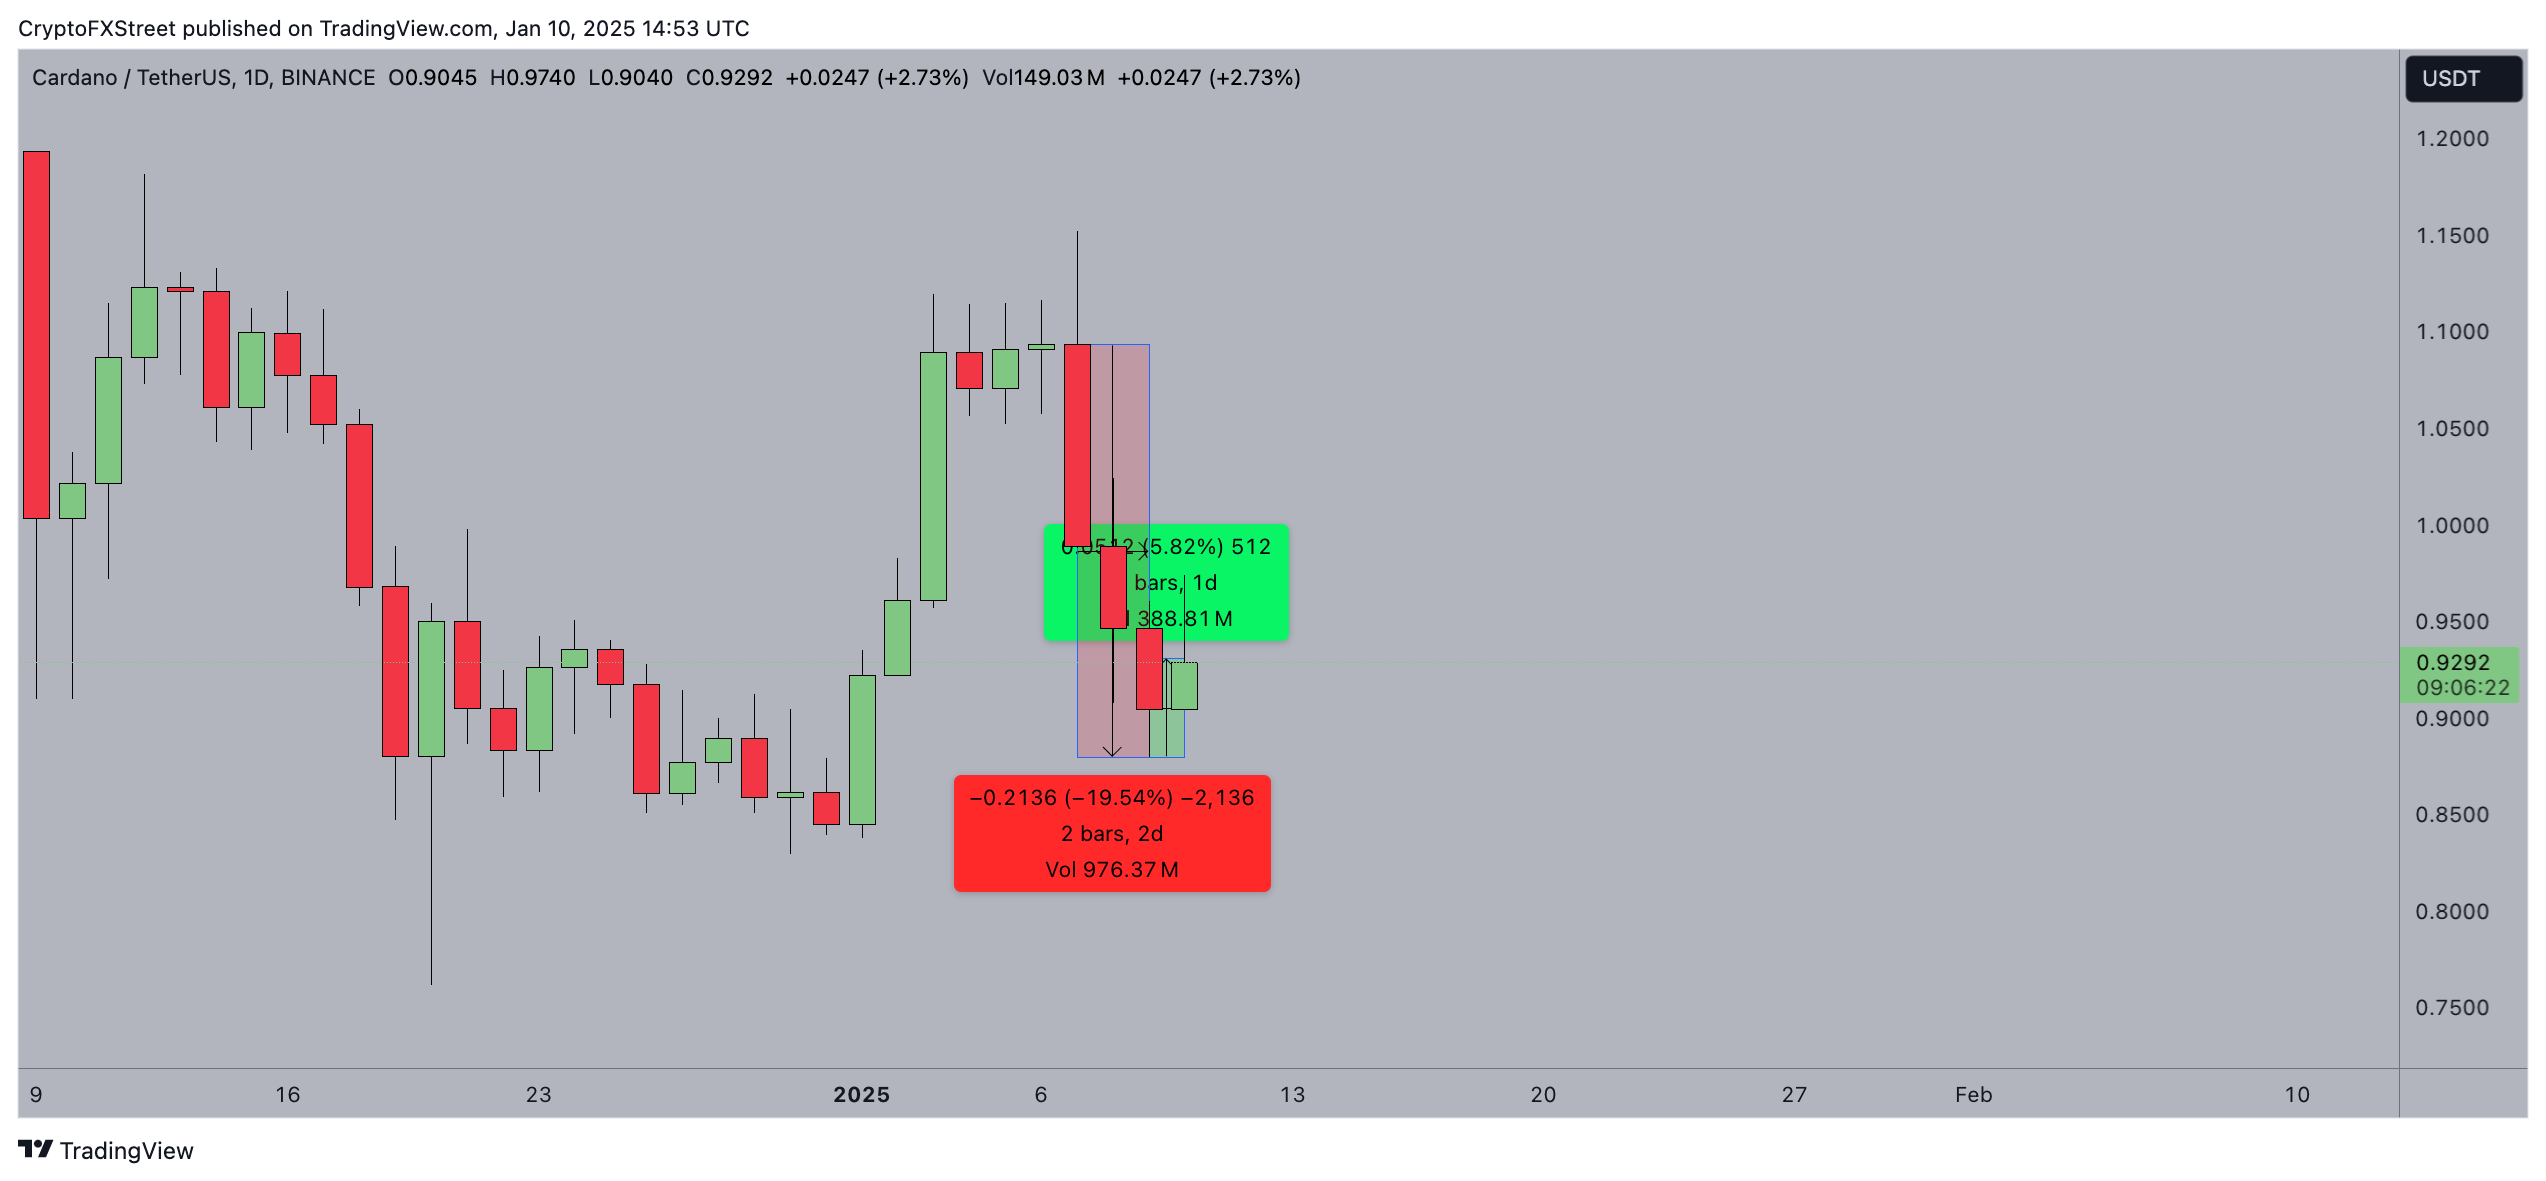 Cardano price action | ADAUSDT
Amid this broader market turmoil, Cardano (ADA) suffered a 20% drop, falling from $1.10 on January 5 to a low of $0.87 on Thursday.
However, Thursday marked a potential turning point, as ADA found stable support at $0.87 and rebounded by 6% within 24 hours.
Now trading at $0.95, the bounce suggests the $0.87 level may have established a local bottom.
If buying momentum persists, Cardano could extend its recovery and retest the $1 resistance zone in the coming sessions, signaling a potential bullish reversal.
Cardano trading volumes remain elevated despite recent market pullback
Despite the sharp 20% price correction this week, Cardano continues to exhibit elevated trading volume, signaling sustained market activity.
Trading volume is a crucial metric for assessing market momentum and liquidity.
High volumes during price corrections can indicate the presence of buyers accumulating at lower levels, reinforcing confidence in a potential recovery.
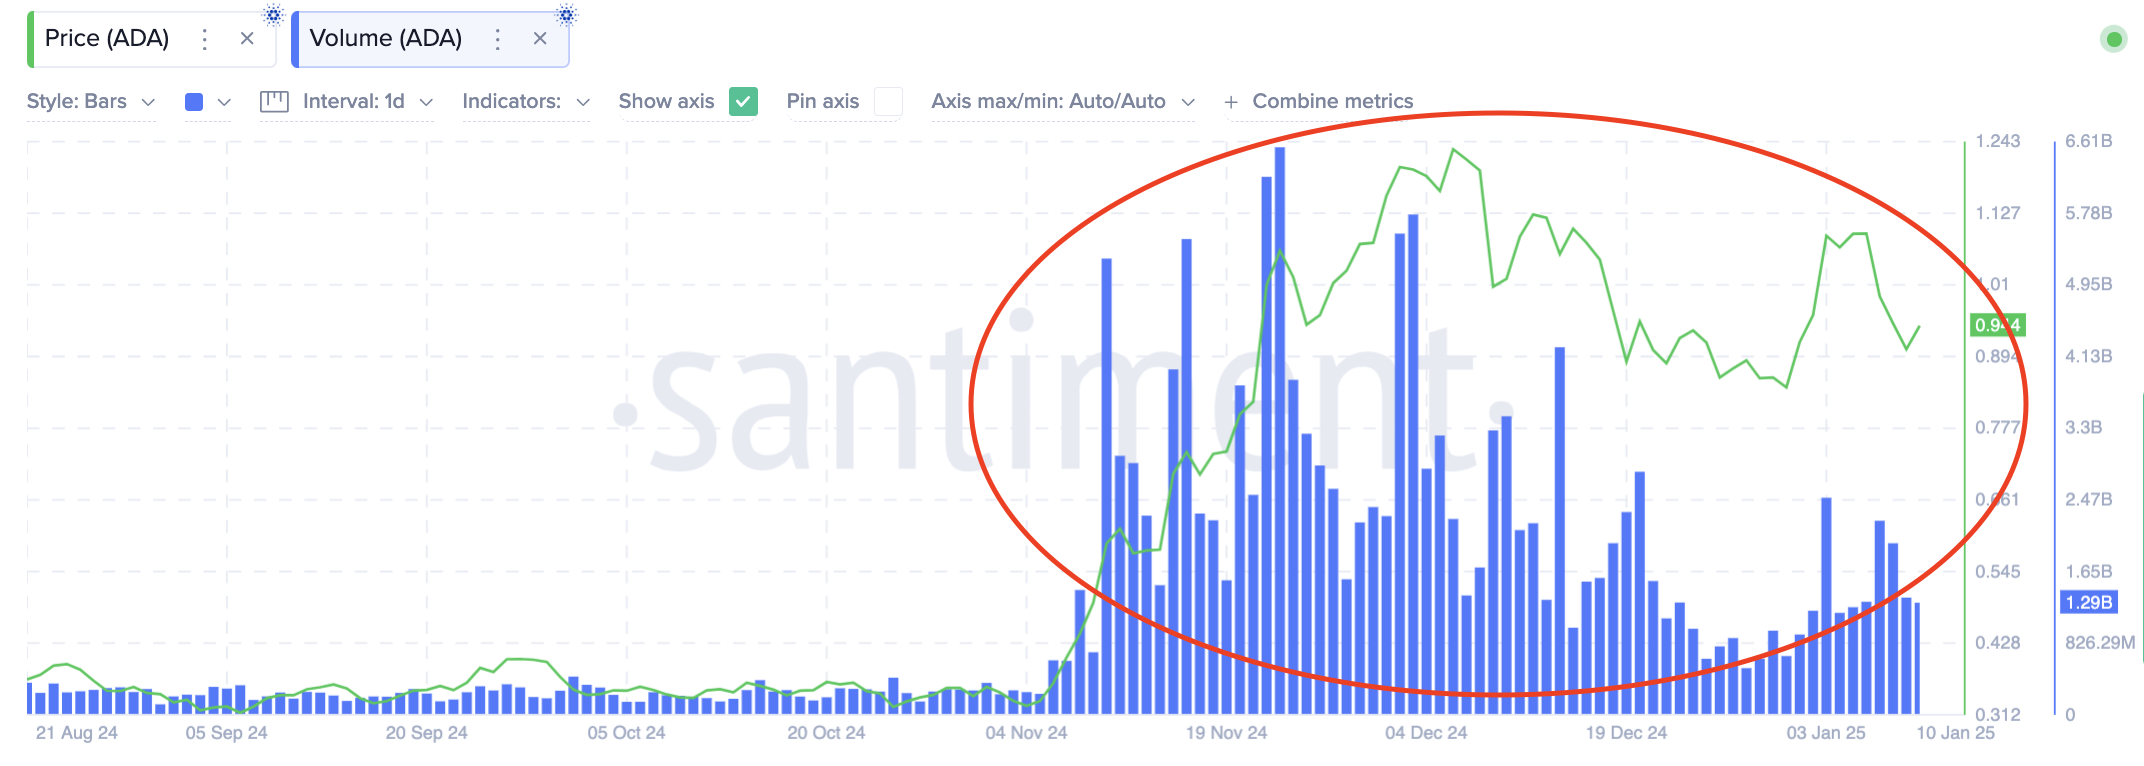 Cardano Trading Volume | Source: Santiment
Santiment data shows that Cardano's trading volume has increased considerably in the last 3 months and maintained significant levels despite recent price turbulence.
For context, the 1.4 billion ADA trading volume recorded on Thursday was amid this week’s crash.
This is more than 300% higher than the October 2024 peak of 438 million.
This suggests active market interest, potentially driven by long-term accumulation strategies and the token's appeal among retail and institutional investors.
The current trading dynamics emphasize Cardano's resilience amid the volatile crypto market phase.
As market sentiment improves, Cardano's consistent trading activity positions it as a key asset to watch in the next recovery phase.
Cardano Price Forecast: Downside risk ahead as $1.10 sell-wall looms large
Cardano's (ADA) recent performance shows signs of market indecision as the token consolidates near $0.94.
Bollinger Bands indicate contracting volatility, with price action hovering around the middle band ($0.94).
This signals a neutral bias in the short term, but ADA faces immediate resistance near $1.10, a psychological and technical sell-wall, as highlighted in recent trading sessions.
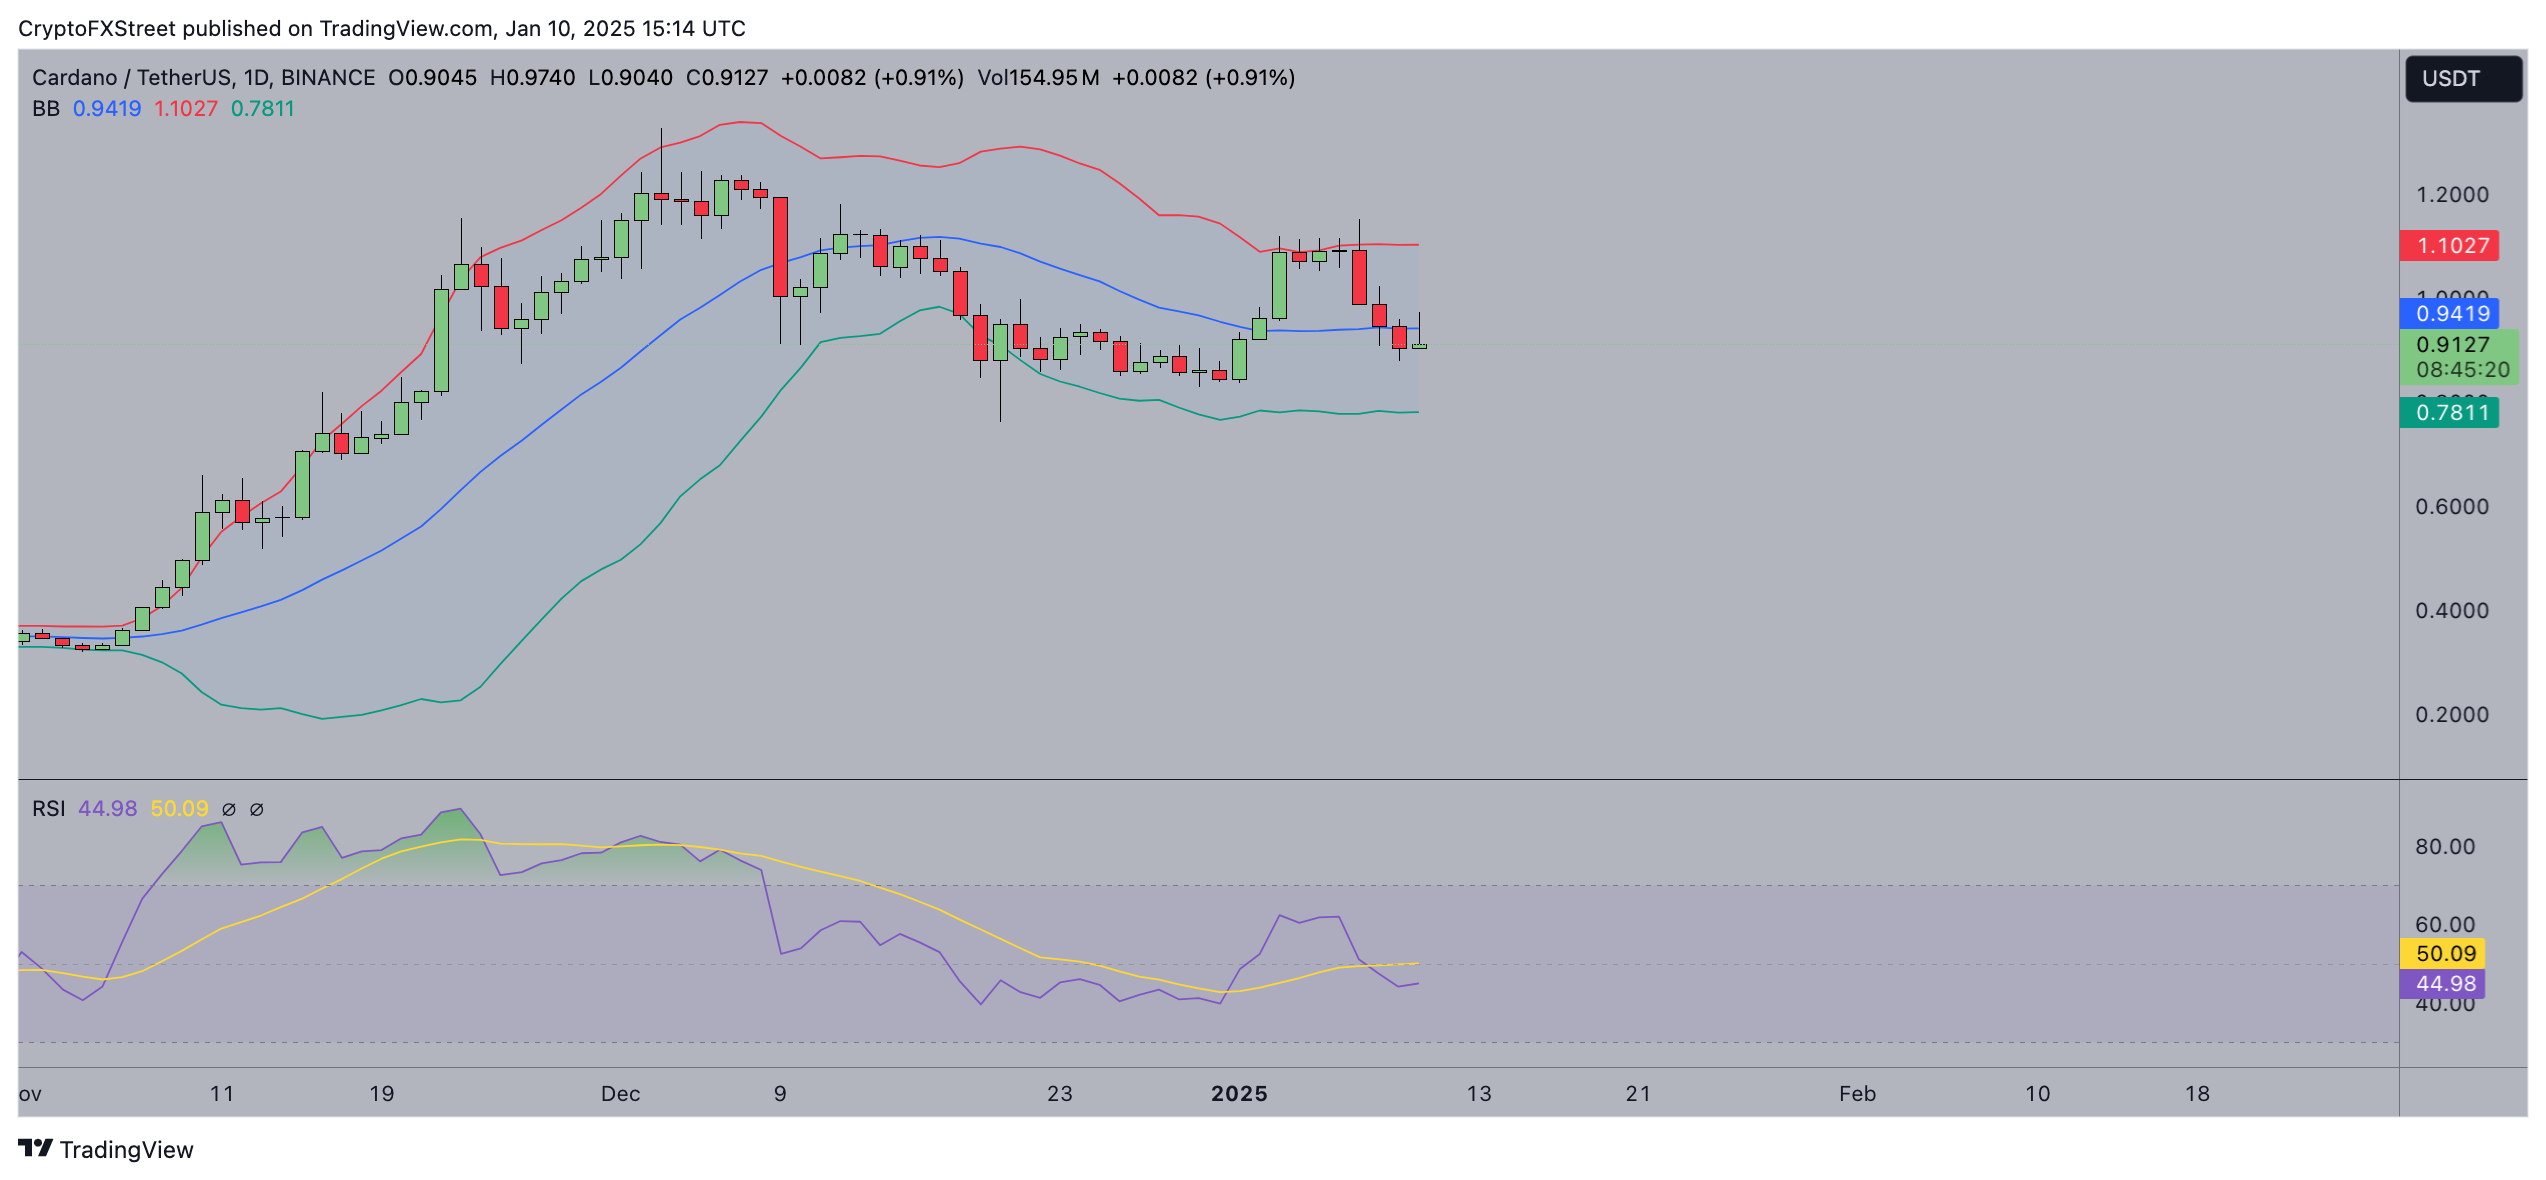 Cardano price forecast (ADAUSDT)
The Relative Strength Index (RSI) is currently near 50, showing a bearish lean while remaining above oversold levels.
A bullish scenario could materialize if ADA breaks the $0.94 resistance, targeting $1.10. Such a breakout may see intensified buying pressure, supported by the Bollinger Band upper boundary at $1.10.
An RSI breakout above 50 would strengthen the case for bullish momentum.
Conversely, failure to sustain above the $0.90 level could lead to a bearish extension toward the $0.78 support level, coinciding with the lower Bollinger Band.
Recommended Articles


