

This Solana meme coin, SILLY could rally 50%
- Silly price has formed a double-bottom pattern around $0.0325, signaling a potential rally.
- Investors can expect a 20% rally to $0.0439 for starters, but this move could extend to $0.0554.
- A flip of the equal lows formed around $0.0312 into a resistance level will invalidate the bullish thesis.
Silly (SILLY) price consolidation could end soon as the altcoin looks for an upward breakout. Sidelined buyers who accumulated SILLY after the February 12 dip will likely be rewarded handsomely if they’re patient in the coming days.
Also read: Dogecoin price eyes double digit gains as DOGE bulls make a comeback
Silly price coils up before explosive move
Silly price crashed 40% between February 8 and 10, setting up a local bottom around $0.0321. While a recovery rally was attempted, SILLY failed to move higher. As a result of the second retest of the $0.0321 level again, a double-bottom reversal pattern formation seems to be underway.
The double bottom is strengthened by the bullish convergence between the second low of the W-shaped pattern and the Relative Strength Index (RSI). The RSI is higher on the second low compared to the first whilst price is lower, this convergence suggests bearish momentum is waning and is a further hint of a reversal of the downtrend coming.
This technical formation typically occurs after a steep correction and signals a reversal of the downtrend. Considering the swift move to the downside, SILLY is likely to experience a similar move in the opposite direction. For this bullish development to occur, Silly price needs to overcome the February 11 swing high at $0.0377 and produce a higher high.
This development would signal a shift in the trend and encourage sidelined buyers to step in, kickstarting the uptrend. Investors can expect SILLY to retest $0.0439, which is roughly 23% away from the current trading level of $0.0358.
In a highly bullish case, Silly price could extend higher and retest $0.0554, which could constitute a 55% gain.
Also read: Week Ahead: Bitcoin inches closer to $50,000, altcoins likely to explode
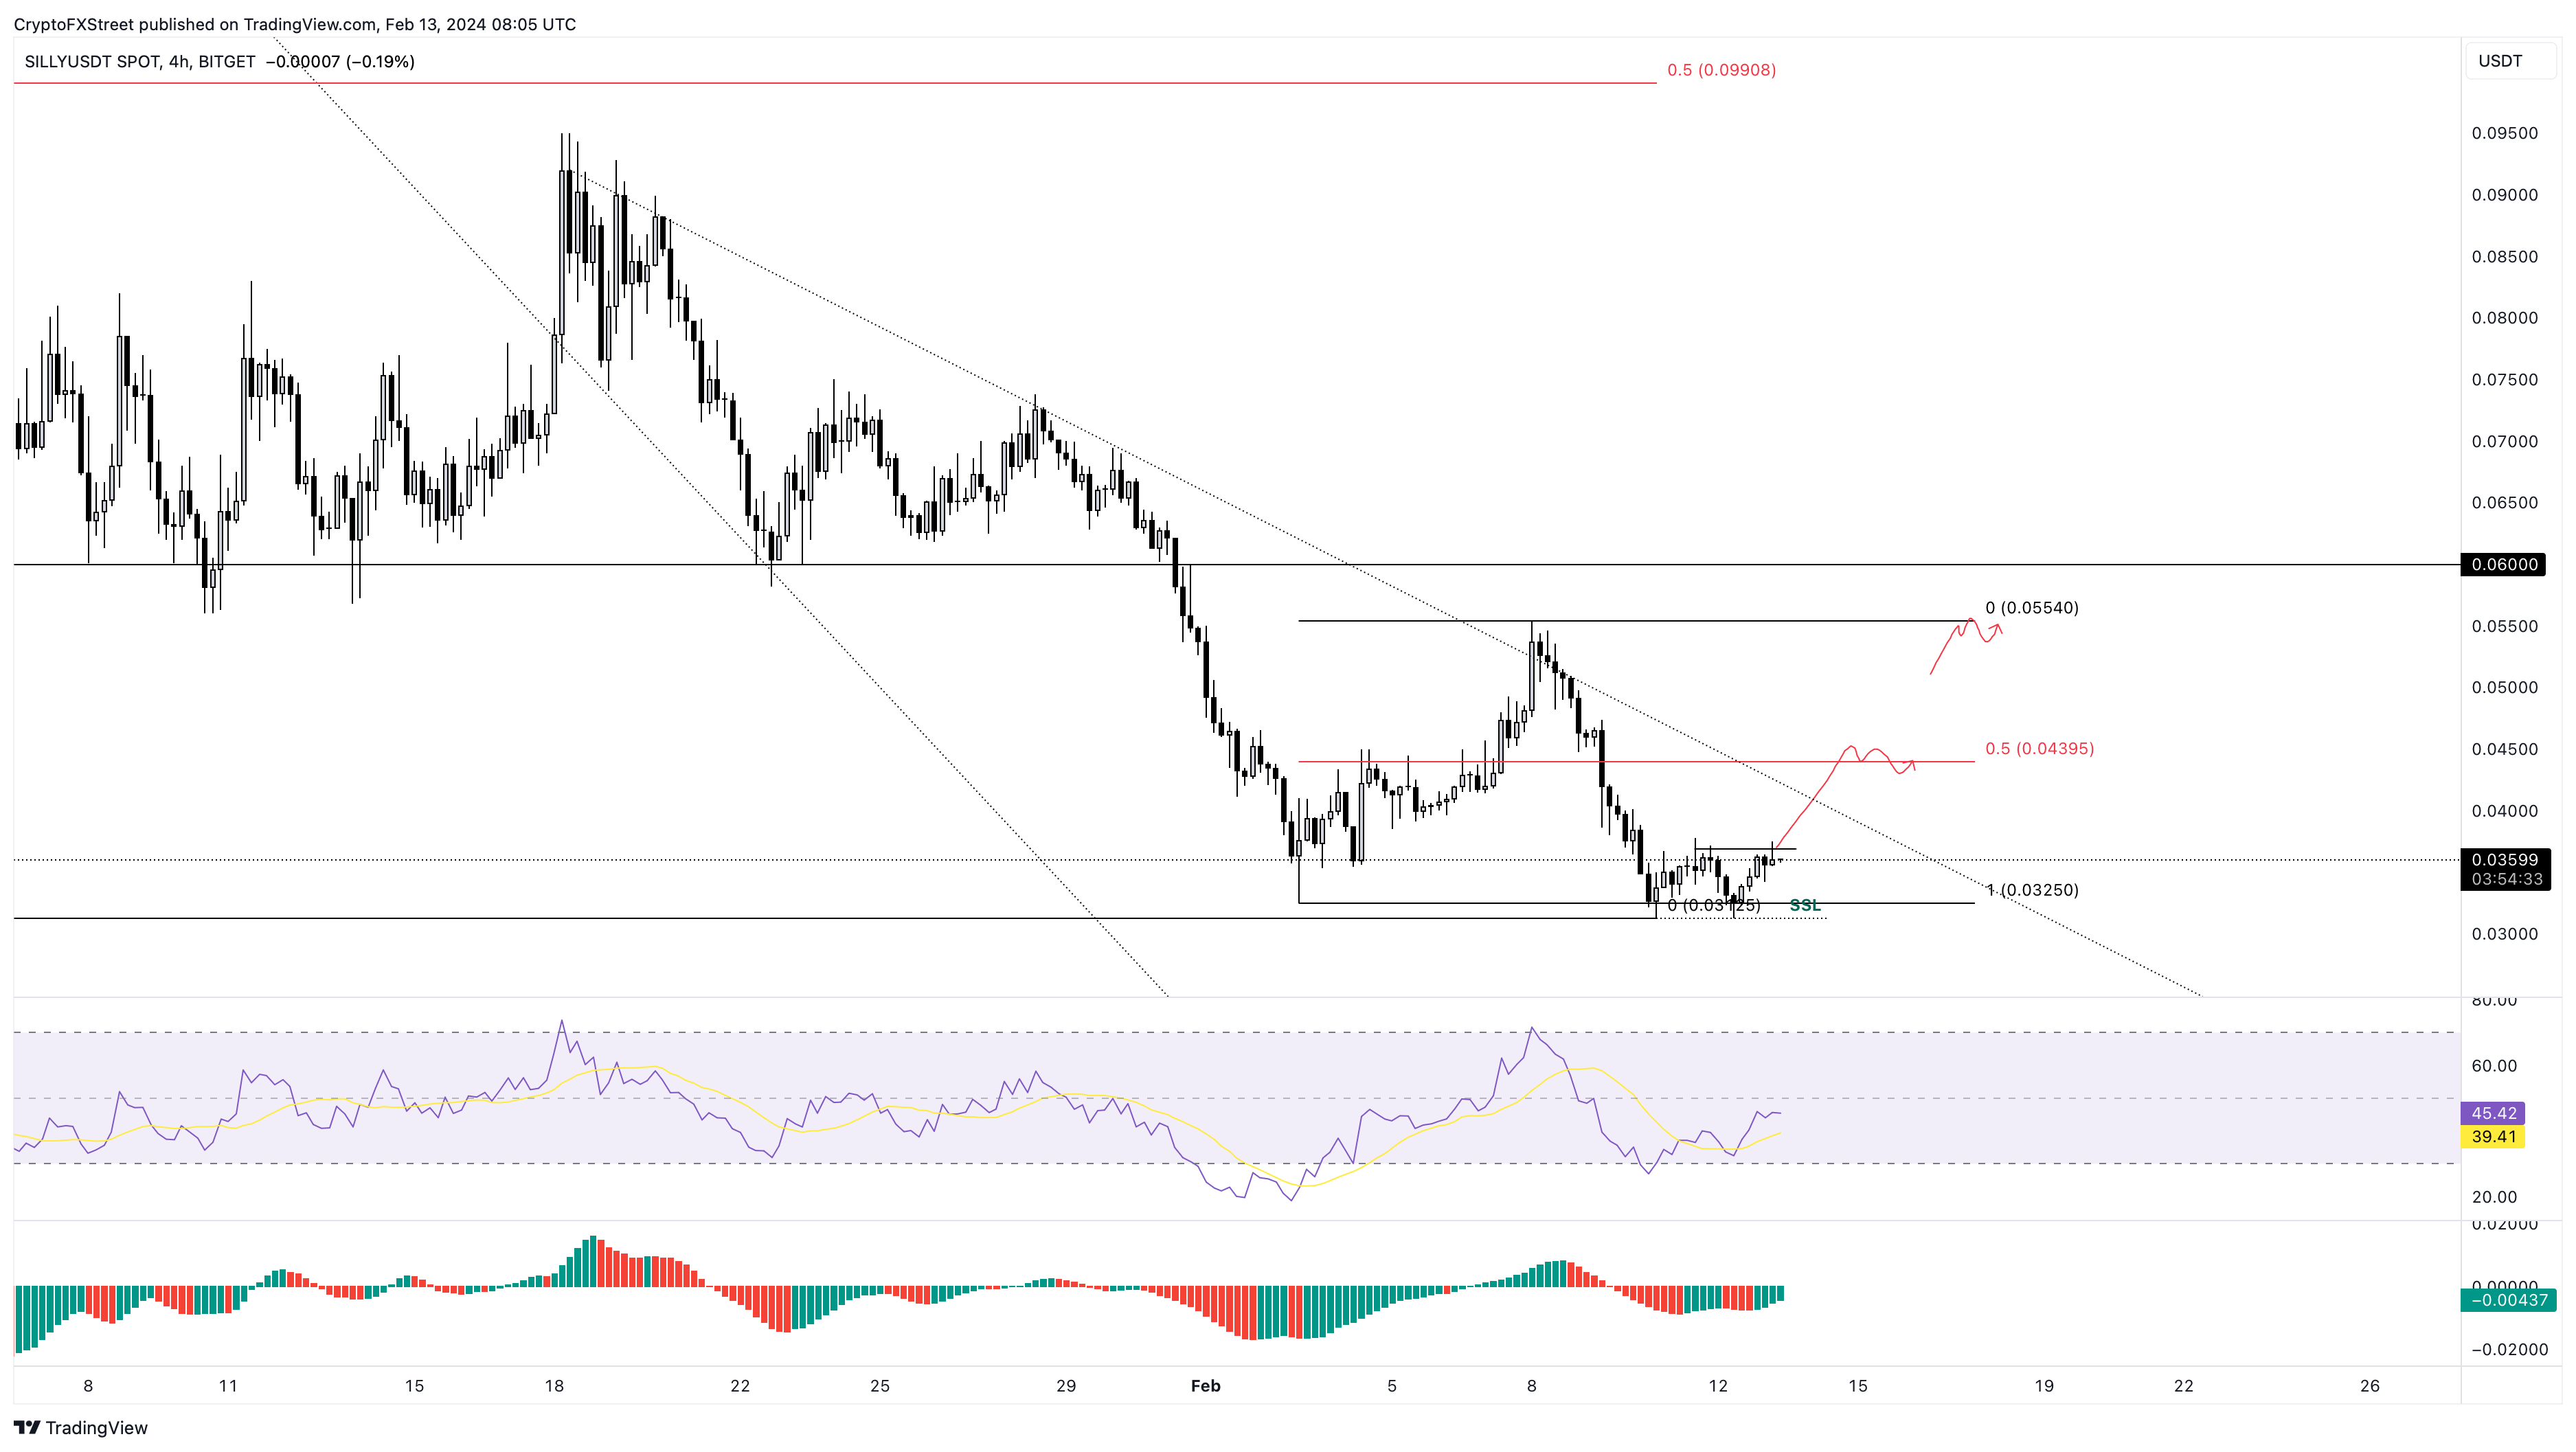
SILLY/USDT 4-hour chart
On the contrary, if Bitcoin price takes a dip, Silly price and other altcoins are likely to follow suit. Regardless of BTC, SILLY could get rejected around $0.0370, which is the midpoint of the double bottom pattern. A sell-off here could send the Solana-based meme coin to sweep the liquidity resting below $0.0312.
A quick recovery there could indicate that bulls are ready for an upswing. However, if SILLY flips the equal lows formed around $0.0312 into a resistance level, it will invalidate the bullish thesis.
In such a case, Silly price could pullback roughly 4% and tag $0.0300.
Recommended Articles


