


Ethereum On-Chain Metrics Looking Strong – Momentum Building For ETH?
Ethereum is attempting to break above the critical $4,000 level as it edges closer to its all-time high. The market has shown skepticism regarding Ethereum’s performance in this cycle, with some analysts predicting it might underperform compared to previous bullish phases. Despite this doubt, Ethereum has proven its resilience, consistently finding demand at key support levels and maintaining a bullish price structure.
Adding to the optimism, on-chain data from IntoTheBlock highlights a strong foundation for Ethereum’s network activity this week. Metrics such as active addresses, transaction volumes, and net flows suggest a healthy ecosystem, reinforcing the potential for ETH to continue its upward trajectory. These indicators reveal increasing participation and growing confidence among investors, even amid broader market uncertainties.
As Ethereum approaches a critical resistance, all eyes are on whether it can maintain momentum and push past $4,000. If successful, this breakout could reignite bullish sentiment and pave the way for ETH to retest its all-time highs, silencing doubters in the process. However, failure to clear this hurdle might result in further consolidation, keeping traders on edge as they anticipate Ethereum’s next major move.
Ethereum Data Signals Strength
Ethereum has been steadily climbing in recent weeks, fueled by a strong bullish trend that began earlier this month. The price momentum is catching the attention of top analysts and investors, who are closely watching for a breakout above yearly highs as ETH edges closer to its all-time high (ATH). The anticipation in the market is palpable, with many viewing this as a pivotal moment for Ethereum to solidify its position in this bull cycle.
Top analyst Ali Martinez recently shared on-chain metrics from IntoTheBlock, revealing a robust outlook for Ethereum’s network this week. Active addresses have increased by 4.24%, signaling heightened participation and interest among users. Similarly, new addresses have risen by 2.65%, suggesting growing adoption and investor activity. Notably, zero-balance addresses have decreased by 4.06%, indicating that dormant wallets are coming back to life, and ETH is being reactivated for transactions or investments.
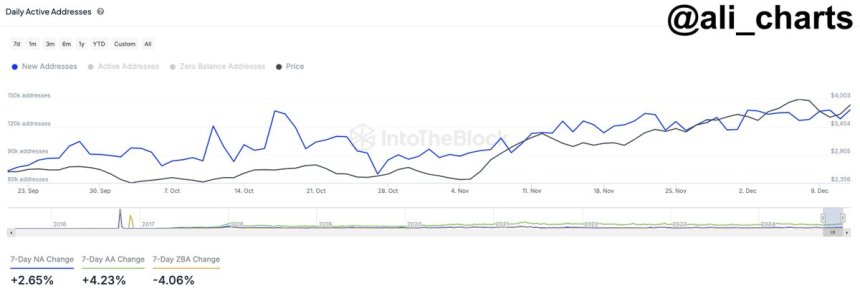
These positive metrics highlight building momentum for Ethereum, reinforcing the belief that it is poised for a significant price move. If ETH successfully breaks above its yearly highs, it could trigger a powerful rally, potentially setting new records. However, a failure to maintain upward momentum could see Ethereum retreat to consolidate further before attempting another breakout.
With its fundamentals strengthening and the market aligning for a breakout, Ethereum appears ready to make its next major move. Whether it’s targeting new all-time highs or finding support for another push, the coming weeks will likely be crucial in determining Ethereum’s trajectory for the remainder of the bull cycle. As sentiment builds, all eyes remain on Ethereum’s ability to capitalize on its growing momentum.
ETH Testing Supply
Ethereum (ETH) is currently trading at $3,920, showing resilience after several failed attempts to break above the critical $4,000 resistance level. This price point remains a psychological and technical barrier for ETH, and clearing it is essential to confirm the continuation of its bullish uptrend.
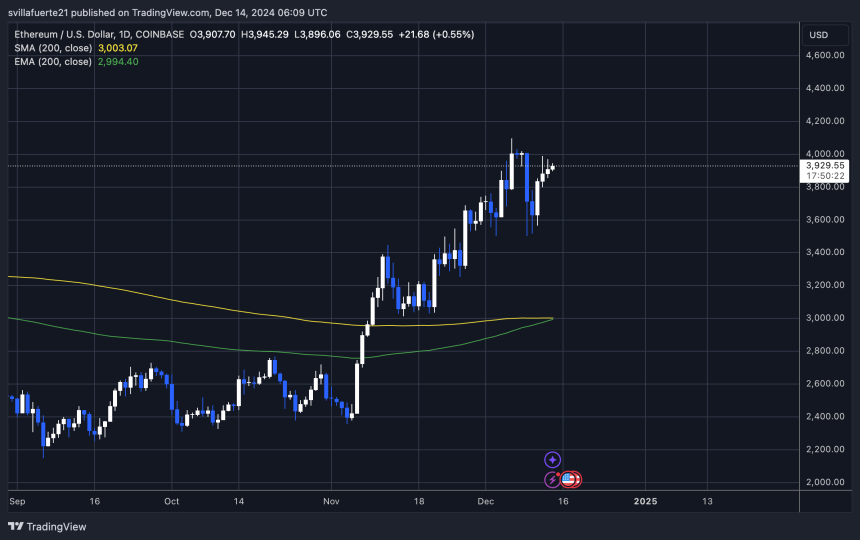
The market’s attention is focused on Ethereum’s ability to reclaim the $4,000 level, which would likely serve as a catalyst for a strong rally toward new yearly highs. However, the inability to decisively breach this resistance has kept ETH in a consolidative phase, leaving some uncertainty about its next move.
If Ethereum fails to maintain its current momentum and breaks above $4,000 in the coming sessions, the price could face increased selling pressure. A retracement toward lower demand levels around $3,500 is likely in such a scenario. This level has previously acted as a robust support zone, and a retest could provide the foundation for another upward attempt.
As the market awaits a decisive move, Ethereum remains in a critical position. Breaking $4,000 would reinvigorate bullish sentiment, while failure to do so could signal further consolidation or correction before the next significant price action unfolds.
Featured image from DALL-E, chart from TradingView
Recommended Articles


