XRP price faces risk of decline with XRPLedger AMM amendment proposal in jeopardy

Source Fxstreet
  • XRPLedger Automated Market Maker amendment is facing criticism in the community and the consensus is 65.71%. 
  • Major XRPL validators Vet and Daniel Keller have rescinded their support for the amendment citing a minor but significant bug.
  • XRP price is nearly unchanged in the past 24 hours, the altcoin is trading at $0.5133 on Wednesday.

XRP price is $0.5133, yielding nearly 2% weekly gains for holders. The native token of the XRPLedger is holding steady despite the status of the Automated Market Maker (AMM) amendment proposal. 

Validators are critical of the amendment and some notable ones have pulled support citing concerns regarding a significant bug. 

Also read: Ethereum price poised for gains as Dencun upgrade goes live on the testnet

Daily Digest Market Movers: XRPLedger amendment for AMM in jeopardy

  • The XRPLedger (XRPL) is currently faced with a major hurdle as the proposal for Automated Market Maker amendment has dropped below the required 80% consensus threshold. 
  • On Thursday, the consensus is 65.71%, notable validators have pulled support for the amendment citing their concerns. 
  • This is a setback for XRPLedger as the amendment previously secured an 85.7% approval rate and was well on its way to be finalized. 

XRP

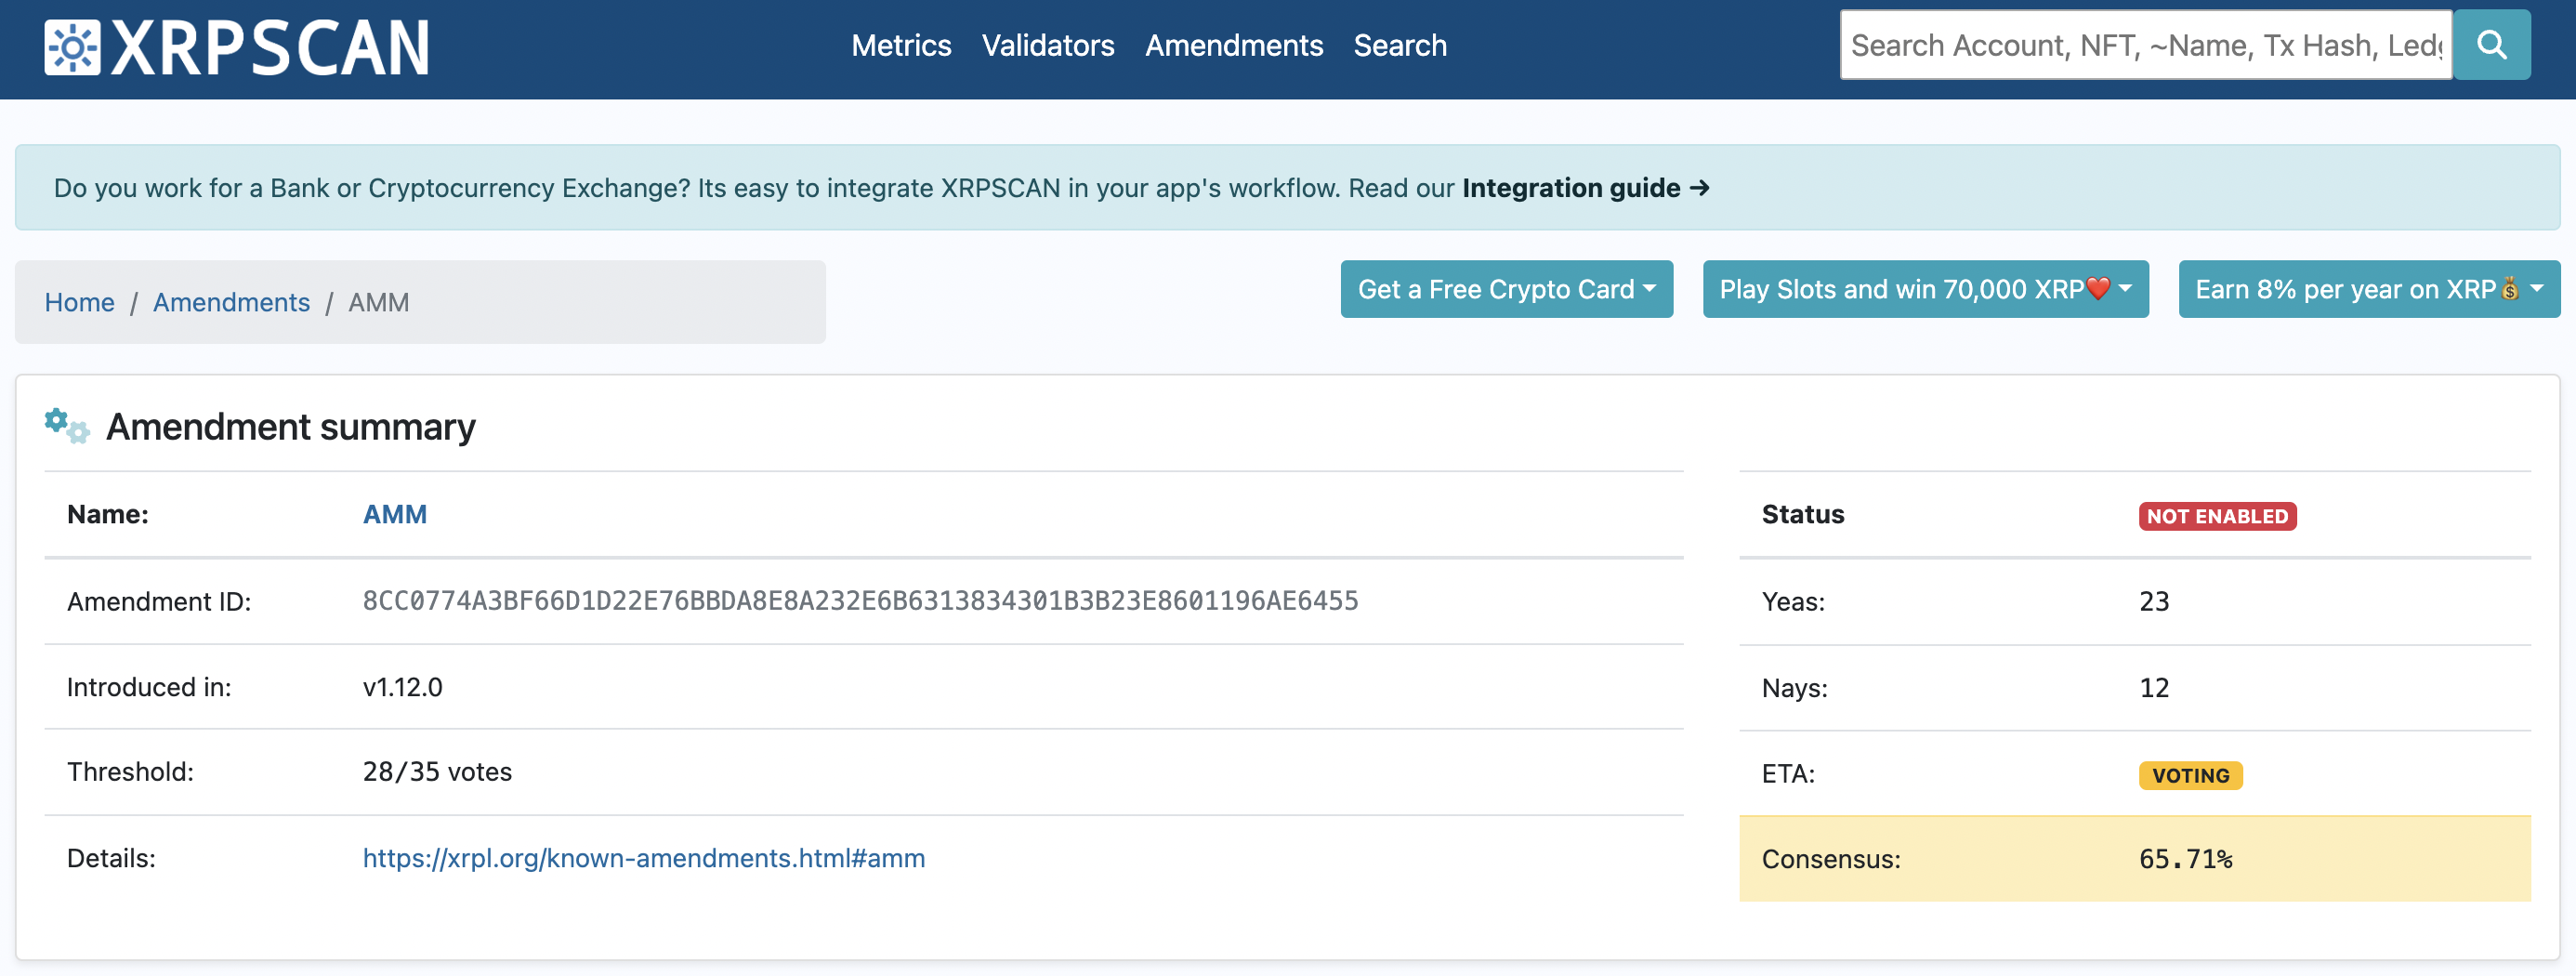
XRPL AMM Amendment consensus on Thursday. Source: XRPScan

  • Validator Vet stated that allowing the AMM proposal to go through would damage the XRP community’s image and XRPL’s reputation. There is room for improvement in the Ledger before rollout of a key feature like AMMs, according to the validator. 
  • The developments in the SEC v. Ripple lawsuit continue to influence the community of XRP holders. 
  • Ripple’s lawyers have asked for a deadline extension for the remedies-related discovery phase stating that SEC’s request for information includes large volumes of data to be compiled by the cross-border payment remittance firm. 

Technical Analysis: XRP price likely to decline further 

XRP price is in a downtrend since the beginning of 2024. The altcoin’s price sustained above the $0.50 psychological level, however further correction is likely due to signals from two key indicators. The Moving Average Convergence Divergence (MACD) indicator is flashing green, however the momentum is likely not enough to push XRP price into recovery. 

The Relative Strength Index (RSI), a momentum oscillator reads 40.50, down from 41.29 on Wednesday. As RSI dips and moves away from the neutral level, there is room for a correction in XRP price. 

XRP price is likely to sweep support at $0.4968, just below the psychologically important level of $0.50 before rebound to R1 at $0.5272. In the event that XRP price sees a daily candlestick close above this level, price could rally towards R2, at $0.5625, that coincides with the 50% Fibonacci Retracement of the decline between January 3 and January 31. 

XRP

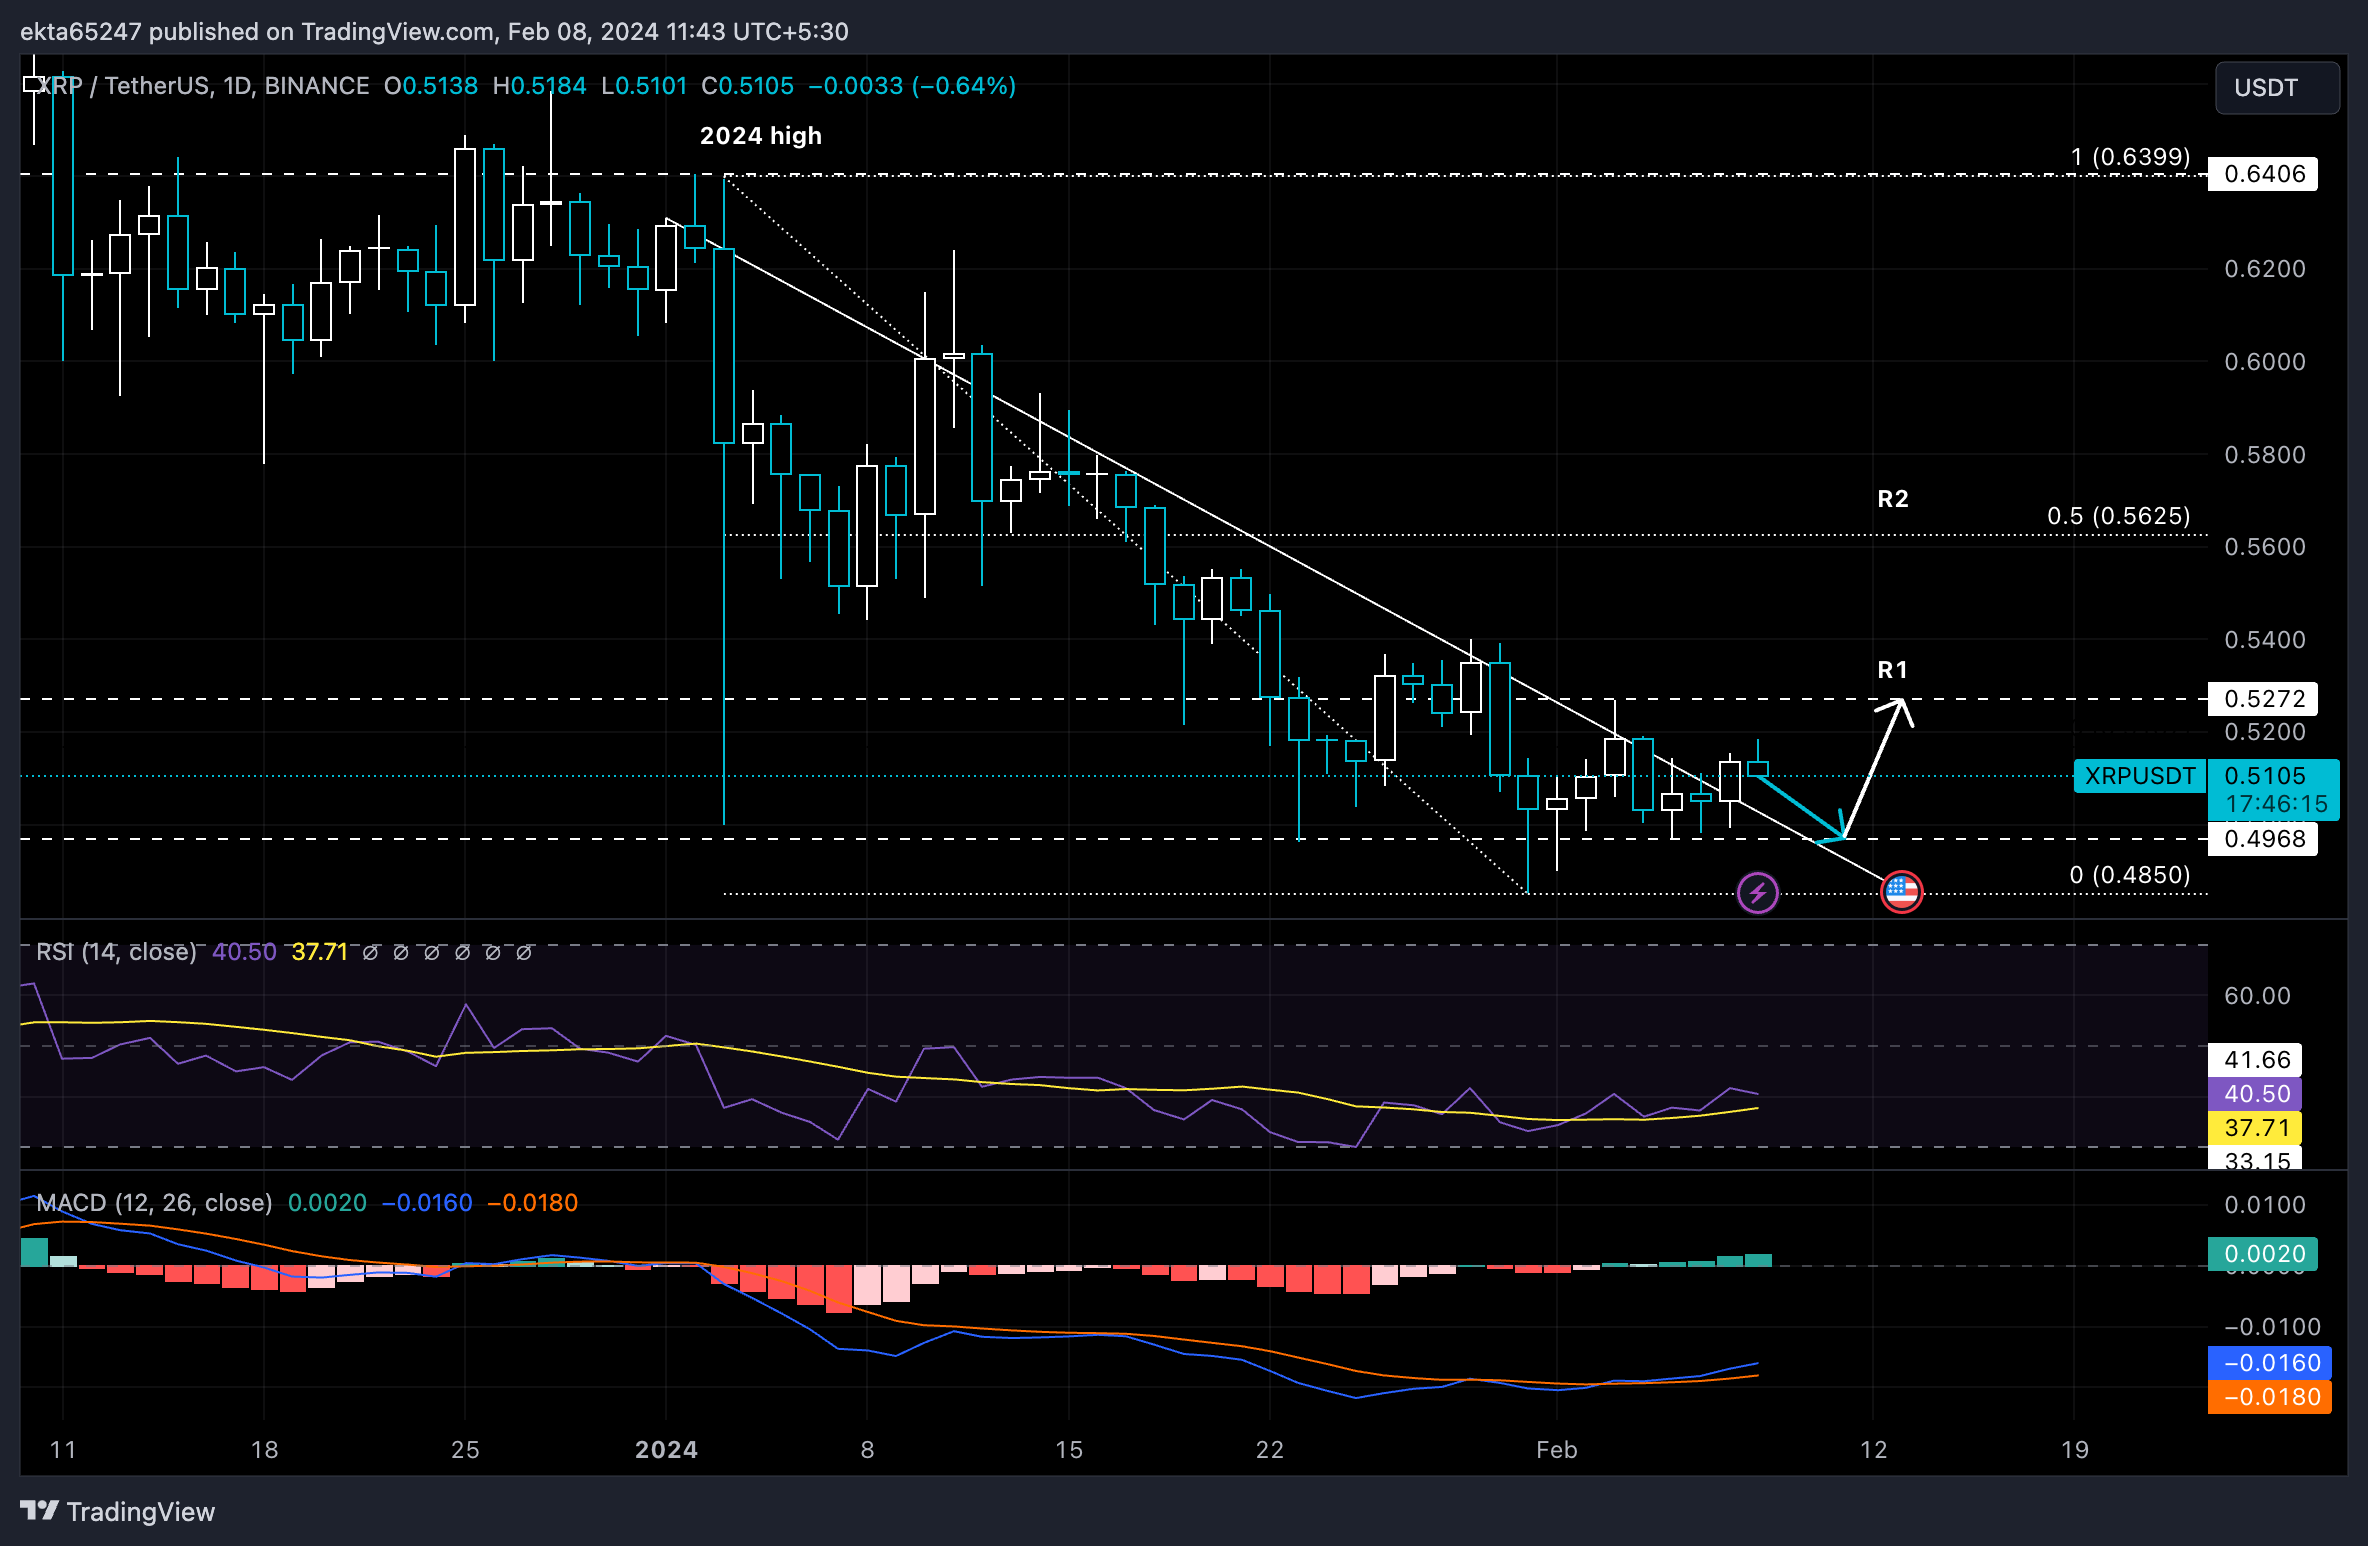
XRP/USDT 1-day chart 

A daily candlestick close below support at $0.4968 could invalidate the recovery thesis and the January 31 low of $0.4850 is likely to come into play for XRP price.

Ripple FAQs

What is Ripple?

Ripple is a payments company that specializes in cross-border remittance. The company does this by leveraging blockchain technology. RippleNet is a network used for payments transfer created by Ripple Labs Inc. and is open to financial institutions worldwide. The company also leverages the XRP token.

What is XRP?

XRP is the native token of the decentralized blockchain XRPLedger. The token is used by Ripple Labs to facilitate transactions on the XRPLedger, helping financial institutions transfer value in a borderless manner. XRP therefore facilitates trustless and instant payments on the XRPLedger chain, helping financial firms save on the cost of transacting worldwide.

What is XRPL?

XRPLedger is based on a distributed ledger technology and the blockchain using XRP to power transactions. The ledger is different from other blockchains as it has a built-in inflammatory protocol that helps fight spam and distributed denial-of-service (DDOS) attacks. The XRPL is maintained by a peer-to-peer network known as the global XRP Ledger community.

What blockchain technology does XRP use?

XRP uses the interledger standard. This is a blockchain protocol that aids payments across different networks. For instance, XRP’s blockchain can connect the ledgers of two or more banks. This effectively removes intermediaries and the need for centralization in the system. XRP acts as the native token of the XRPLedger blockchain engineered by Jed McCaleb, Arthur Britto and David Schwartz.

Disclaimer: For information purposes only. Past performance is not indicative of future results.
placeholder
U.S. November Nonfarm Payrolls: What Does the Rare "Weak Jobs, Strong Economy" Mix Mean for U.S. Equities?1. IntroductionAfter retreating from the late-October highs, U.S. equities embarked on a bottoming rebound in mid-to-late November, a trend driven by the interplay of multiple factors. That said, it i
Author  TradingKey
11 hours ago
1. IntroductionAfter retreating from the late-October highs, U.S. equities embarked on a bottoming rebound in mid-to-late November, a trend driven by the interplay of multiple factors. That said, it i
placeholder
Senate Delays Crypto Market Structure Hearings to Early 2026The Senate Banking Committee has postponed cryptocurrency market structure hearings until 2026, citing ongoing bipartisan negotiations.
Author  Mitrade
16 hours ago
The Senate Banking Committee has postponed cryptocurrency market structure hearings until 2026, citing ongoing bipartisan negotiations.
placeholder
Bitcoin Slides 5% as Sellers Lean In — Can BTC Reclaim $88,000?Bitcoin has dropped back below $88,000 after rolling over from $90,500, with price still trading under the 100-hour Simple Moving Average. The sell-off found a floor at $85,151, and BTC is now consolidating near that base, but rebounds are facing pressure from a bearish trend line around $89,000. Bulls need to retake $88,000–$89,000 to ease downside risk; failure to do so keeps $85,500–$85,000 and then $83,500 in play, with $80,000 as the deeper “line in the sand.” Bitcoin (BTC) is back in damage-control mode after a sharp pullback wiped out recent gains. The price failed to reclaim the $90,000–$90,500 band, rolled over, and slid through $88,500 before briefly dipping under $87,000. Buyers did show up around $85,000, but the rebound so far looks more like stabilization than a clear trend reversal. Bitcoin dips hard, finds a bid near $85,000(h3) BTC’s latest move lower began when it couldn’t build follow-through above $90,000 and $90,500. Once that upside stalled, sellers took control and pushed price down through $88,500. The slide accelerated enough to spike below $87,000, but the market didn’t free-fall. Bulls defended the $85,000 zone, printing a low at $85,151. Since then, Bitcoin has been consolidating below the 23.6% Fibonacci retracement of the drop from the $93,560 swing high to the $85,151 low — a clue that the bounce is still shallow and that sellers haven’t fully backed off yet. Structurally, BTC is still on the back foot: It’s trading below $88,000, and It remains below the 100-hour Simple Moving Average, keeping short-term trend pressure pointed downward. Resistance is layered, and $89,000 is the problem area(h3) If bulls try to turn this into a recovery, they’ll have to climb through multiple ceilings in quick succession. First, BTC faces resistance around $87,150, followed by a more meaningful barrier near $87,500. From there, the market’s attention snaps back to $88,000 — the level BTC just lost and now needs to reclaim. A close back above $88,000 would improve the tone, but it doesn’t solve the bigger issue: there’s a bearish trend line on the hourly BTC/USD chart (Kraken feed) with resistance near $89,000, which also lines up with the next technical hurdle. If BTC can push through $89,000 and hold, the rebound could extend toward $90,000, with follow-through targets at $91,000 and $91,500. But until price clears that $88,000–$89,000 zone, rallies are at risk of being sold rather than chased. If BTC fails to reclaim resistance, the downside path is clear(h3) The near-term bear case is simple: if Bitcoin can’t climb back above the $87,000 area and keep traction, sellers may attempt another leg lower. Support levels line up like this: Immediate support: $85,500 First major support: $85,000 Next support: $83,500 Then $82,500 in the near term Below that, the major “don’t break this” level is still $80,000. If BTC slips under $80,000, the risk of acceleration to the downside increases significantly — not because it’s magic, but because it’s the kind of psychological and structural level that tends to trigger forced de-risking. Indicators: momentum still leans bearish(h3) The intraday indicators aren’t offering much comfort yet: Hourly MACD is losing pace in the bearish zone. Hourly RSI remains below 50, suggesting sellers still have the upper hand on short timeframes. So while the $85,000 defense held for now, the market hasn’t flipped bullish — it’s just stopped bleeding.
Author  Mitrade
19 hours ago
Bitcoin has dropped back below $88,000 after rolling over from $90,500, with price still trading under the 100-hour Simple Moving Average. The sell-off found a floor at $85,151, and BTC is now consolidating near that base, but rebounds are facing pressure from a bearish trend line around $89,000. Bulls need to retake $88,000–$89,000 to ease downside risk; failure to do so keeps $85,500–$85,000 and then $83,500 in play, with $80,000 as the deeper “line in the sand.” Bitcoin (BTC) is back in damage-control mode after a sharp pullback wiped out recent gains. The price failed to reclaim the $90,000–$90,500 band, rolled over, and slid through $88,500 before briefly dipping under $87,000. Buyers did show up around $85,000, but the rebound so far looks more like stabilization than a clear trend reversal. Bitcoin dips hard, finds a bid near $85,000(h3) BTC’s latest move lower began when it couldn’t build follow-through above $90,000 and $90,500. Once that upside stalled, sellers took control and pushed price down through $88,500. The slide accelerated enough to spike below $87,000, but the market didn’t free-fall. Bulls defended the $85,000 zone, printing a low at $85,151. Since then, Bitcoin has been consolidating below the 23.6% Fibonacci retracement of the drop from the $93,560 swing high to the $85,151 low — a clue that the bounce is still shallow and that sellers haven’t fully backed off yet. Structurally, BTC is still on the back foot: It’s trading below $88,000, and It remains below the 100-hour Simple Moving Average, keeping short-term trend pressure pointed downward. Resistance is layered, and $89,000 is the problem area(h3) If bulls try to turn this into a recovery, they’ll have to climb through multiple ceilings in quick succession. First, BTC faces resistance around $87,150, followed by a more meaningful barrier near $87,500. From there, the market’s attention snaps back to $88,000 — the level BTC just lost and now needs to reclaim. A close back above $88,000 would improve the tone, but it doesn’t solve the bigger issue: there’s a bearish trend line on the hourly BTC/USD chart (Kraken feed) with resistance near $89,000, which also lines up with the next technical hurdle. If BTC can push through $89,000 and hold, the rebound could extend toward $90,000, with follow-through targets at $91,000 and $91,500. But until price clears that $88,000–$89,000 zone, rallies are at risk of being sold rather than chased. If BTC fails to reclaim resistance, the downside path is clear(h3) The near-term bear case is simple: if Bitcoin can’t climb back above the $87,000 area and keep traction, sellers may attempt another leg lower. Support levels line up like this: Immediate support: $85,500 First major support: $85,000 Next support: $83,500 Then $82,500 in the near term Below that, the major “don’t break this” level is still $80,000. If BTC slips under $80,000, the risk of acceleration to the downside increases significantly — not because it’s magic, but because it’s the kind of psychological and structural level that tends to trigger forced de-risking. Indicators: momentum still leans bearish(h3) The intraday indicators aren’t offering much comfort yet: Hourly MACD is losing pace in the bearish zone. Hourly RSI remains below 50, suggesting sellers still have the upper hand on short timeframes. So while the $85,000 defense held for now, the market hasn’t flipped bullish — it’s just stopped bleeding.
placeholder
AUD/USD remains depressed below mid-0.6600s; downside seems limited ahead of US NFP reportThe AUD/USD pair attracts some sellers for the fourth straight day on Tuesday and trades around the 0.6630 region, down just over 0.10%, during the Asian session.
Author  FXStreet
20 hours ago
The AUD/USD pair attracts some sellers for the fourth straight day on Tuesday and trades around the 0.6630 region, down just over 0.10%, during the Asian session.
placeholder
Macro Analysts: Hawkish Japan Could Push Bitcoin Below $70KAnalysts predict Bitcoin may face further declines towards the $70,000 mark if the Bank of Japan raises interest rates as expected.
Author  Mitrade
Yesterday 05: 48
Analysts predict Bitcoin may face further declines towards the $70,000 mark if the Bank of Japan raises interest rates as expected.
goTop
quote