

Top 3 Price Prediction Bitcoin, Ethereum, Ripple: BTC, ETH and XRP hints for a pullback ahead
- Bitcoin price action shows a bearish momentum on the RSI indicator, suggesting a decline ahead.
- Ethereum price faces resistance around the $4,000 level, indicating a pullback ahead.
- Ripple price rejects the $2.66 resistance level, suggesting a downturn on the horizon.
Bitcoin (BTC), Ethereum (ETH) and Ripple (XRP) all face resistance at their crucial level, indicating a pullback in the upcoming days.
Bitcoin bulls show signs of exhaustion
Bitcoin price reached a new all-time high (ATH) of $104,088 on Thursday. It then fell sharply to a daily low of $90,500 but recovered and closed above $96,900 on the same day. BTC rose 4.3% in the next three days until Sunday. At the time of writing on Monday, it trades slightly down around $99,500.
Despite the recovery from Thursday’s fall and rising until Sunday, Bitcoin’s Relative Strength Index (RSI) flashes warning signs. The higher high formed on Thursday does not reflect the RSI chart for the same period, indicating a formation of a bearish divergence, which often leads to a short-term correction.
If this bearish divergence plays out, traders could expect a small rise towards the recent high of $104,088 (grabbing liquidity or trapping longs), to then fall sharply towards the $90,000 support level. A successful close below this level could extend an additional decline towards the next support level of $85,000.
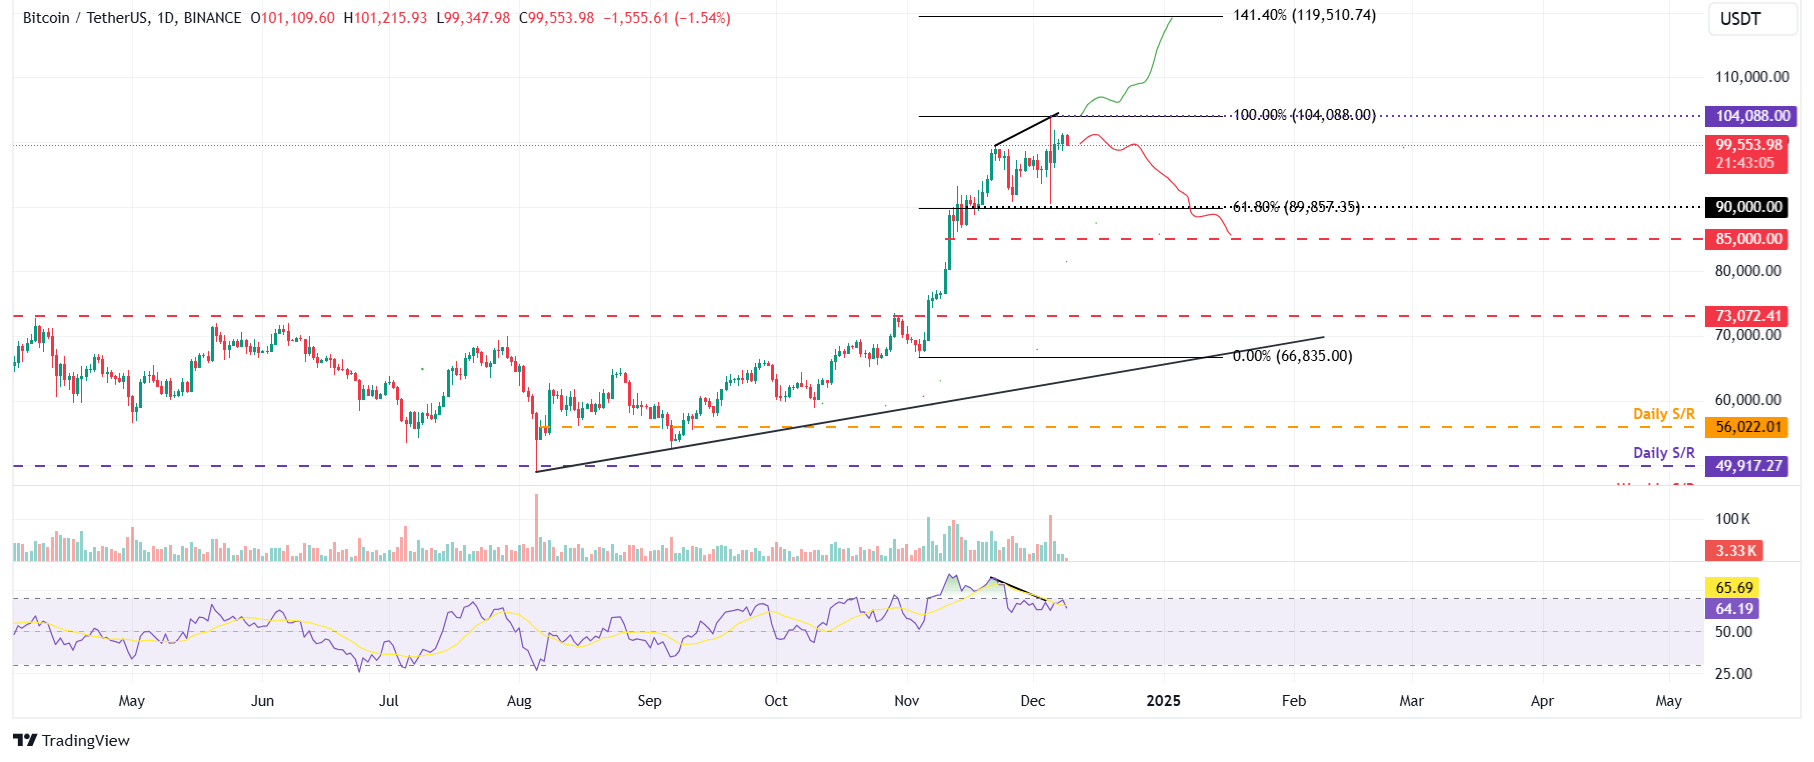
BTC/USDT daily chart
However, if BTC continues its uptrend and closes above $104,088, it could extend the rally toward the new all-time high of $119,510. This level aligns with the 141.4% Fibonacci extension line drawn from the November 4 low of $66,835 to Thursday’s all-time high of $104,088.
Ethereum price is set for a pullback as it faces resistance at $4,000
Ethereum price rallied 8% last week and retested the $4,000 level on Friday. However, it faced resistance around this level during the weekend. At the time of writing on Monday, it trades down around $3,948.
If the $4,000 continues to hold as resistance, ETH could extend the decline to retest its daily support level at $3,721.
The RSI on the daily chart reads 69 and points downwards after rejecting the overbought level of 70, suggesting weakness in bullish momentum.
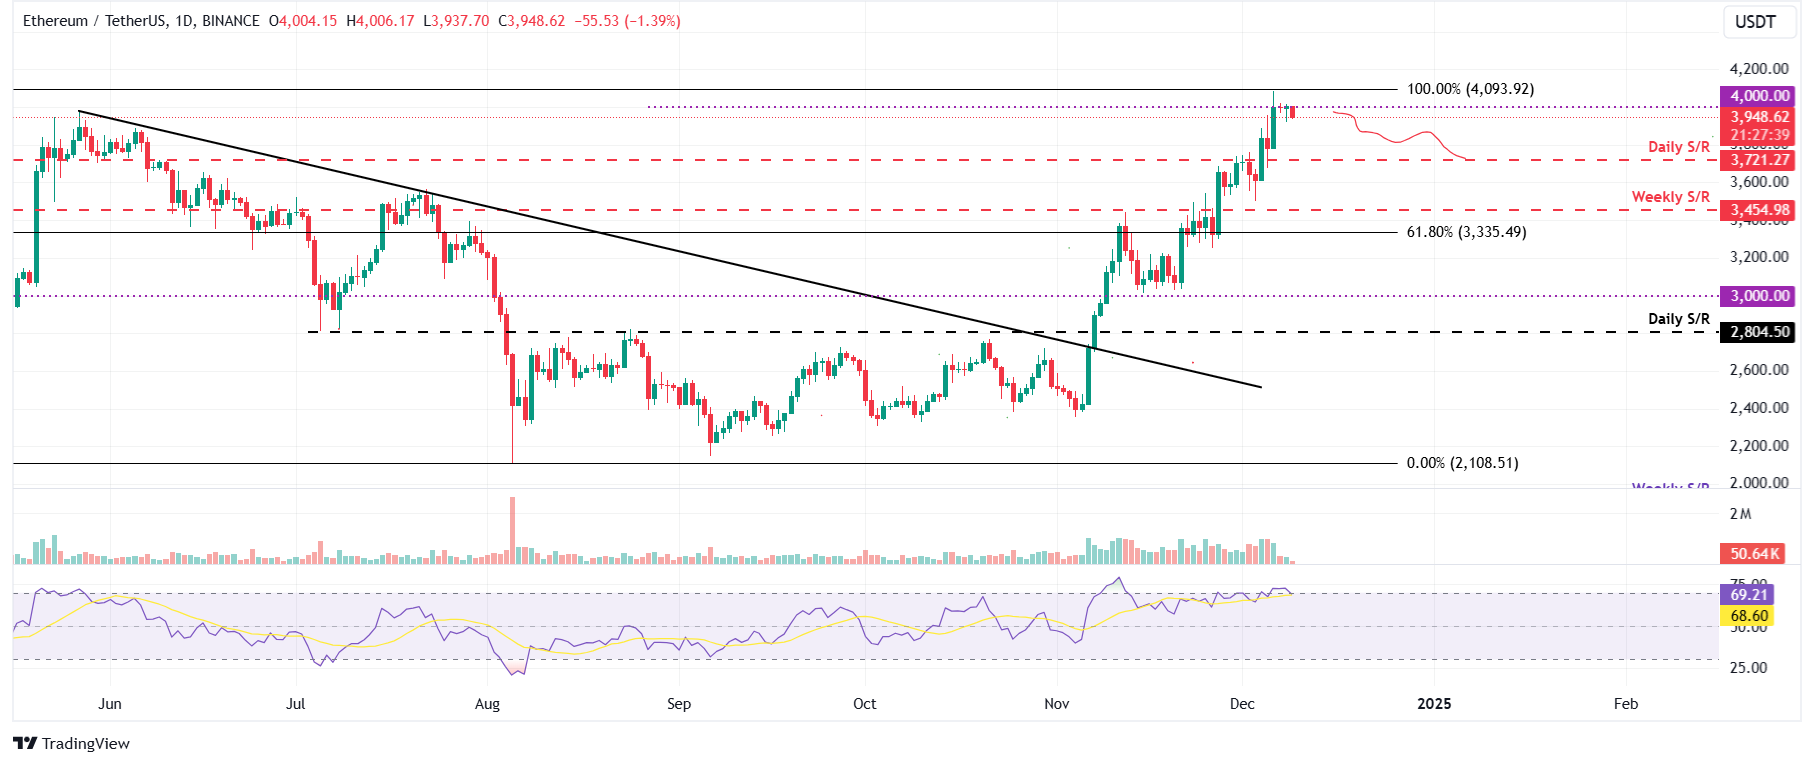
ETH/USDT daily chart
However, if ETH rallies and closes above $4,000, it could extend the rally to retest the $4,200 level.
Ripple price is set for a downturn
Ripple price faces resistance around the $2.66 level on Sunday. At the time of writing on Monday, it trades slightly down around $2.47.
If the $2.66 level continues to hold as resistance, XRP could extend the decline to retest the psychologically important level of $2.00.
The RSI on the daily chart reads 70, hovering around the overbought level of 70, and points downwards, indicating weakness in bullish momentum. If the RSI exits overbought territory, it could provide a clear sell signal.
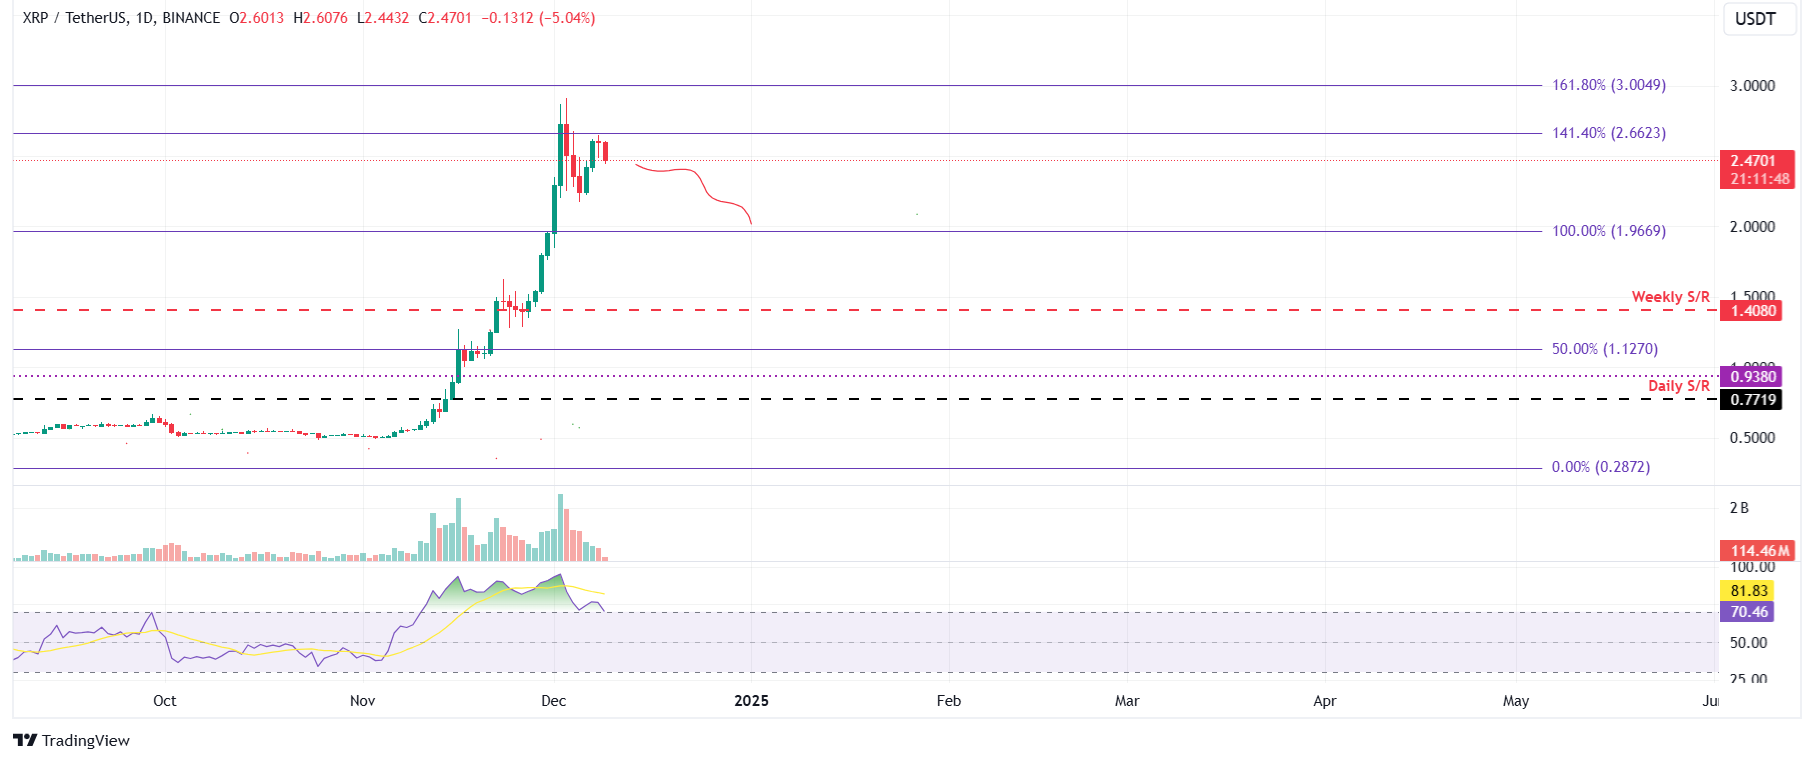
XRP/USDT daily chart
On the other hand, if XRP rallies and closes above the $2.66 level, it could extend the rally to retest the psychologically important level of $3.00.
Bitcoin, altcoins, stablecoins FAQs
Bitcoin is the largest cryptocurrency by market capitalization, a virtual currency designed to serve as money. This form of payment cannot be controlled by any one person, group, or entity, which eliminates the need for third-party participation during financial transactions.
Altcoins are any cryptocurrency apart from Bitcoin, but some also regard Ethereum as a non-altcoin because it is from these two cryptocurrencies that forking happens. If this is true, then Litecoin is the first altcoin, forked from the Bitcoin protocol and, therefore, an “improved” version of it.
Stablecoins are cryptocurrencies designed to have a stable price, with their value backed by a reserve of the asset it represents. To achieve this, the value of any one stablecoin is pegged to a commodity or financial instrument, such as the US Dollar (USD), with its supply regulated by an algorithm or demand. The main goal of stablecoins is to provide an on/off-ramp for investors willing to trade and invest in cryptocurrencies. Stablecoins also allow investors to store value since cryptocurrencies, in general, are subject to volatility.
Bitcoin dominance is the ratio of Bitcoin's market capitalization to the total market capitalization of all cryptocurrencies combined. It provides a clear picture of Bitcoin’s interest among investors. A high BTC dominance typically happens before and during a bull run, in which investors resort to investing in relatively stable and high market capitalization cryptocurrency like Bitcoin. A drop in BTC dominance usually means that investors are moving their capital and/or profits to altcoins in a quest for higher returns, which usually triggers an explosion of altcoin rallies.
Recommended Articles


