

Whale Activity Sparks Chainlink Rally, $52 Target On Traders’ Radar

Source Newsbtc

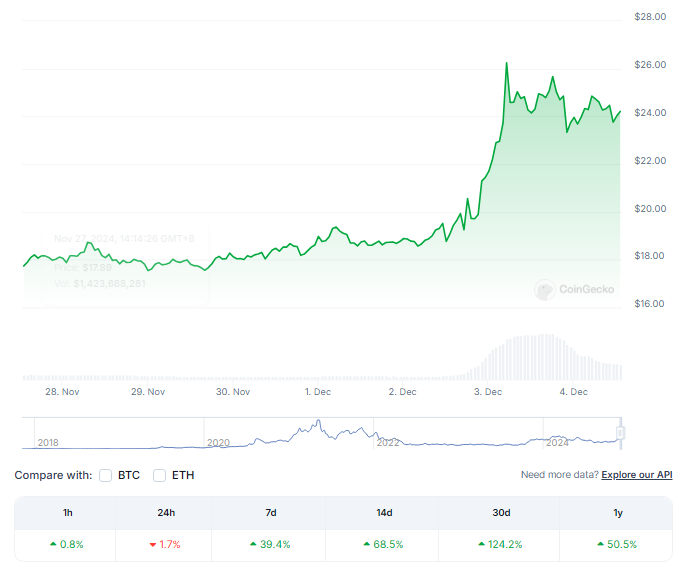
It’s simple to understand why Chainlink (LINK) has recently drawn attention in the cryptocurrency community. The digital asset has experienced a remarkable 40% increase in just one week.

Demand for LINK significantly increased from $16.54 on November 26 to $25.73 by December 3. As the largest price increase since January 2022, this spike indicates a new wave of investor enthusiasm and momentum.
Surge Fueled By Whale Activity

Whale activity is one of the main drivers for this rally. LookonChain reported on December 3 that a whale address scooped up 269,861 LINK tokens, valued at $6.68 million. The acquisition of 107,838 tokens on a decentralized exchange by the whale, costing $2.6 million, shows that confidence in LINK continues to grow.

Furthermore, 162,024 LINK tokens, which were valued at $4.08 million, were withdrawn from Binance, underscoring the increased interest of institutional investors.

This isn’t just something whales do. Other large holders also play a crucial part. As small and medium-sized investors increase their shares, new investors are now jumping on the Chainlink bandwagon.

IntoTheBlock data shows that over the last 30 days, the number of LINK tokens owned by small buyers (1,000 to 10,000) has grown by 35%.

In the same vein, mid-tier investors, who held 10,000 to 100,000 LINK, experienced a significant 86.79% increase in accumulation.

Bullish Forecasts & Strong Market Performance

Chainlink’s market capitalization has now exceeded $15 billion, following a 25% increase in the past 24 hours. The asset’s remarkable performance is also contributing to the current optimism in the DeFi sector, which is on the brink of a $150 billion market capitalization.

Well-known figures such as Satoshi Flipper have predicted a target price of $52 for LINK, which is a particularly bullish outlook among analysts. A breakout rally has gained more steam, emulating the 2022-2023 trendline breakout, which signaled a substantial rebound in the broader market.
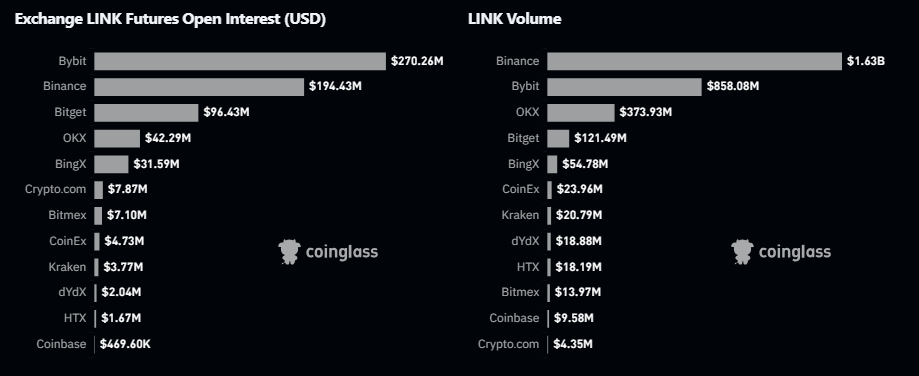
Coinglass indicators show a 57% growth in futures open interest to $708 million and rising investor interest. Trading volume in derivatives rose 450% to $5 billion. This shows a surge in speculative activity, which bodes well for LINK’s growth.

Chainlink: The Road Ahead

Chainlink’s price behavior suggests that the present surge could last; but, its long-term success depends on its capacity to maintain momentum. Strong purchasing pressure and rising whale activity point to a continuous optimistic view.

However, investors should exercise caution, as markets can fluctuate rapidly. LINK may achieve new price milestones in the upcoming weeks if it maintains its upward trajectory.

Featured image from IndiaMART, chart from TradingView

Disclaimer: For information purposes only. Past performance is not indicative of future results.
placeholder
Gold Price Analysis Today | Forex Gold Analysis | XAU/USD Analysis - November 11, 2026Get the latest gold price analysis, forex gold insights, and XAU/USD analysis for November 11, 2026. Read on for the details.
Author  Mitrade
Nov 11, Wed
Get the latest gold price analysis, forex gold insights, and XAU/USD analysis for November 11, 2026. Read on for the details.
placeholder
Bitcoin lost its 200-day average — but the exit started three sessions before the CPIBitcoin fell 2.5% to about $73,400 on 11 November, an 11-week low, breaking its 200-day moving average near $73,100. The 24-hour liquidation tally reached $632 to $705 million, roughly 82% of it longs. But spot ETF outflows began three sessions earlier and USDT's market cap has shrunk $6.6 billion in 60 days — the leveraged length left before the inflation print did. A double top at 81,890 and 81,080 leaves a measured target of 69,366.
Author  Suzie
Nov 11, Wed
Bitcoin fell 2.5% to about $73,400 on 11 November, an 11-week low, breaking its 200-day moving average near $73,100. The 24-hour liquidation tally reached $632 to $705 million, roughly 82% of it longs. But spot ETF outflows began three sessions earlier and USDT's market cap has shrunk $6.6 billion in 60 days — the leveraged length left before the inflation print did. A double top at 81,890 and 81,080 leaves a measured target of 69,366.
placeholder
Nvidia slid 7.7% after hours while AMD and Broadcom rose — the AI trade changed hands, it didn't breakNvidia closed Wednesday at 173.73, up 2.87%, then fell as much as 8.1% to 159.44 after reports that its board was preparing for a possible leadership change. The same session, the Philadelphia Semiconductor Index rose 5.7% with all 30 components higher, CoreWeave jumped 24.7% on 168% revenue growth, and Micron added 11.9%. If AI demand were being repriced, AMD and Broadcom would not be bid. This is a governance discount on one name, and 204.54 — the 200-day average — is the level that settles it.
Author  Irene Q.
Nov 12, Thu
Nvidia closed Wednesday at 173.73, up 2.87%, then fell as much as 8.1% to 159.44 after reports that its board was preparing for a possible leadership change. The same session, the Philadelphia Semiconductor Index rose 5.7% with all 30 components higher, CoreWeave jumped 24.7% on 168% revenue growth, and Micron added 11.9%. If AI demand were being repriced, AMD and Broadcom would not be bid. This is a governance discount on one name, and 204.54 — the 200-day average — is the level that settles it.
placeholder
Gold hit a one-year low while central banks bought 321 tonnes — the sellers were never the ones you thinkSpot gold closed at 3,876 on Thursday, down 2.8% and its lowest close in more than a year, with an intraday low near 3,852. The dollar is at a 19-month high of 103.21 and the 10-year yield is at 5.10%, so the price move is easy to explain. What is harder to explain is who sold: central banks bought 321 tonnes in Q3, the PBoC added for a 24th straight month, ETF holdings are near a record 4,256 tonnes, and roughly 95% of the futures selling came from non-reportable and sovereign-type accounts rather than hedge funds. This piece separates the two books that have to balance.
Author  Irene Q.
Yesterday 02: 40
Spot gold closed at 3,876 on Thursday, down 2.8% and its lowest close in more than a year, with an intraday low near 3,852. The dollar is at a 19-month high of 103.21 and the 10-year yield is at 5.10%, so the price move is easy to explain. What is harder to explain is who sold: central banks bought 321 tonnes in Q3, the PBoC added for a 24th straight month, ETF holdings are near a record 4,256 tonnes, and roughly 95% of the futures selling came from non-reportable and sovereign-type accounts rather than hedge funds. This piece separates the two books that have to balance.
placeholder
Brent rose 3.3% and US crude stocks built 4.66 million barrels in the same weekBrent January settled at 95.82, up 3.3%, and WTI at 88.74, up 2.55%, after the US signalled it would not pursue a deal with Iran and attacks on Gulf shipping continued. In the same week, EIA data showed US crude inventories rising 4.657 million barrels against expectations of a 1.1 million draw, with gasoline up another 1.799 million. OPEC output also rebounded 1.96 million barrels a day to 27.16 million in October, led by Saudi Arabia at 10.56 million. This piece separates the geopolitical premium from the physical balance and lays out where each side of the trade is anchored.
Author  Irene Q.
Yesterday 03: 06
Brent January settled at 95.82, up 3.3%, and WTI at 88.74, up 2.55%, after the US signalled it would not pursue a deal with Iran and attacks on Gulf shipping continued. In the same week, EIA data showed US crude inventories rising 4.657 million barrels against expectations of a 1.1 million draw, with gasoline up another 1.799 million. OPEC output also rebounded 1.96 million barrels a day to 27.16 million in October, led by Saudi Arabia at 10.56 million. This piece separates the geopolitical premium from the physical balance and lays out where each side of the trade is anchored.
goTop
quote