


Bitcoin Price Enters Parabolic Phase Of Cycle After Surge To $98,000 – Analyst
The Bitcoin price has continually tested resistance levels above $95,000 in its pursuit to reach and surpass the anticipated $100,000 all-time high. Following its surge to $98,000, a crypto analyst has asserted that the BTC price has officially entered the parabolic phase of this four-year market cycle.
Bitcoin Price Enters Parabolic Phase
Popular crypto analyst Rekt Capital has declared to his 517,800 followers on X (formerly Twitter) that Bitcoin, the world’s largest cryptocurrency, has officially and completely transitioned into its “Parabolic Upside phase” this bull cycle. The analyst shared a chart illustrating the coin’s price action during the 2021 bull run and the current bull cycle.
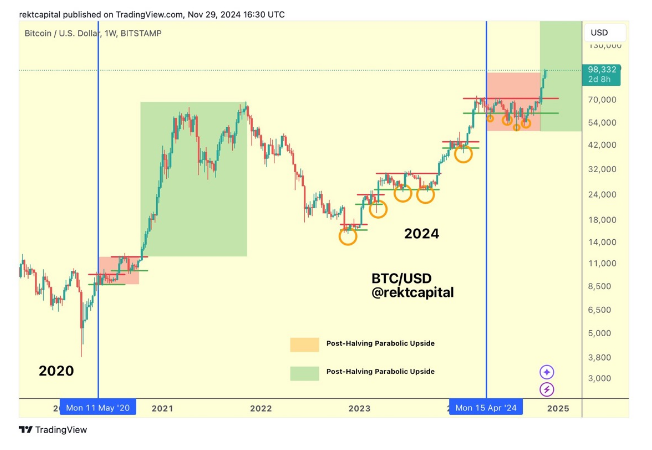
After its halving event in 2022, the Bitcoin price experienced a massive rally that pushed it to its 2021 all-time high of over $64,000. At the time, Bitcoin had experienced a significant correction before fully entering its bullish upside phase.
Interestingly, a similar trend can also be seen in this bull cycle, signaling a possibility of more price rallies. In the last few months, the BTC price entered a re-accumulation phase characterised by slight declines and consolidation before recording a subsequent rally above $99,000.
Rekt Capital disclosed that after BTC hit $98,000, the pioneer cryptocurrency had successfully entered its parabolic upside phase. This phase suggests that Bitcoin could rise even higher, matching analysts’ expectations in this bull market.
On November 27, Rekt Capital also shared a post illustrating the crypto asset’s steady progression into the parabolic phase. He pointed out that the cryptocurrency was on the verge of exiting a reaccumulation phase and transitioning into the parabolic upside, as indicated by the green zone on the price chart.
Bitcoin Price: $100,000 ATH – Now Or Never
The crypto community is on an intense bullish ride, as analysts and investors widely anticipate the Bitcoin price surge to $100,000. The leading cryptocurrency has been trading just shy of the $100,000 mark, experiencing a price increase above $98,000 at some point in the past week.
A crypto analyst identified as Trader of Crypto on X is tapping into this strong bullish trend, announcing that “the clock is ticking” for Bitcoin to reach $100,000. His statement underscores how close Bitcoin is to reaching the milestone during this cycle.
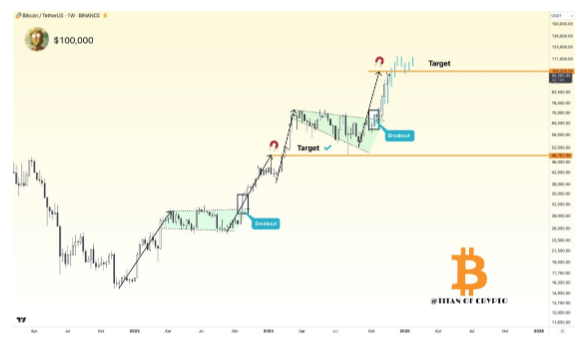
Trader of Crypto has also stated that it is only a matter of time before Bitcoin breaks past the anticipated $100,000 all time high. While the analyst has maintained a bullish outlook on Bitcoin, he has also presented a price chart that suggests that the cryptocurrency could experience a crash towards $46,757 if bears take over.
The Bitcoin price is currently trading at $96,965, marking a 1% increase in the past 24 hours, according to CoinMarketCap.
Featured image from Pexels, chart from TradingView
Recommended Articles


