

Ripple surges to a new yearly high; XRP bulls aim for three-year high of $1.96
- Ripple price surges around 10% on Friday, reaching levels not seen since May 2021.
- The rally was fueled by SEC Chair Gary Gensler’s upcoming resignation and the WisdomTree Physical XRP ETP launch in Europe on Thursday.
- Reports show XRPL DEX activity is at record highs, with active addresses and open interest also surging.
- The technical outlook suggests a continuation of the rally, targeting a three-year high of $1.96.
Ripple (XRP) extends its gains by around 10% on Friday, reaching a new year-to-date high of $1.43 and hitting levels not seen since mid-May 2021. The main reasons behind the rally are the announcement that the US Securities and Exchange Commission’s (SEC) Chair Gary Gensler will resign and the launch in Europe of an XRP exchange-traded products (ETP) by asset management company WisdomTree.
Another factor favoring the XRP price outlook is its record-high levels of activity in decentralized exchange (DEX), active addresses, and open interest in the XRP network. Amid the current optimistic market outlook and expectations that the legal troubles for XRP are about to end, bulls aim for a target of $1.96, a three-year high.
Why is Ripple going up today?
Ripple price extends its gains by around 10% on Friday, reaching levels not seen since mid-May 2021, after surging more than 30% so far this week. The main reasons for the recent price surge are:
First, SEC Chair Gary Gensler announced on Thursday that he would resign from the agency on January 20, 2025. The market rallied nearly 13% on Thursday following this news as investors anticipate an end to the SEC’s stringent “regulation by enforcement” approach, which has heavily impacted Ripple and the broader crypto sector.
Analysts consider that a new, more pro-crypto SEC chair could lead to a favorable outcome in the legal battle between the SEC and Ripple, unlocking XRP’s full potential and broader acceptance in the financial ecosystem.
On January 20, 2025 I will be stepping down as @SECGov Chair.
— Gary Gensler (@GaryGensler) November 21, 2024
A thread ⬇️
Second, the WisdomTree Physical XRP ETP launched in Europe on Thursday. The launch allows investors to gain exposure to the native token on the XRP Ledger through regulated European markets, which is a positive sign for the token’s accessibility and liquidity. This renewed interest will likely attract investors and traders to the XRP token, and anticipate the equivalent XRP ETF products could be launched in the US.
We’re excited to announce the launch of the WisdomTree Physical XRP ETP, now listed on Börse Xetra, SIX Swiss Exchange, and Euronext Paris and Amsterdam.
— WisdomTree in Europe (@WisdomTreeEU) November 21, 2024
The WisdomTree Physical XRP ETP offers a simple, secure, and low-cost way to gain exposure to XRP, one of the largest… pic.twitter.com/30VAQVau8t
Technical Outlook: XRP could extend rally toward three-year high
Ripple’s weekly chart shows that its price broke above $1.27, the 50% price retracement level drawn from the April 2021 high of $1.96 to the June 2022 low of $0.287. As of Friday, XRP reaches a new year-to-date high of $1.43, hovering around the key resistance level of $1.40.
If a weekly close is above $1.40, XRP could extend the rally and retest its next resistance level at $1.96, which is a three-year high.
However, the Relative Strength Index (RSI) on the weekly chart reads at 83, signaling extremely overbought conditions and suggesting an increasing risk of a correction. Traders should exercise caution when adding to their long positions as the RSI’s move out of the overbought territory could provide a clear sign of a pullback.
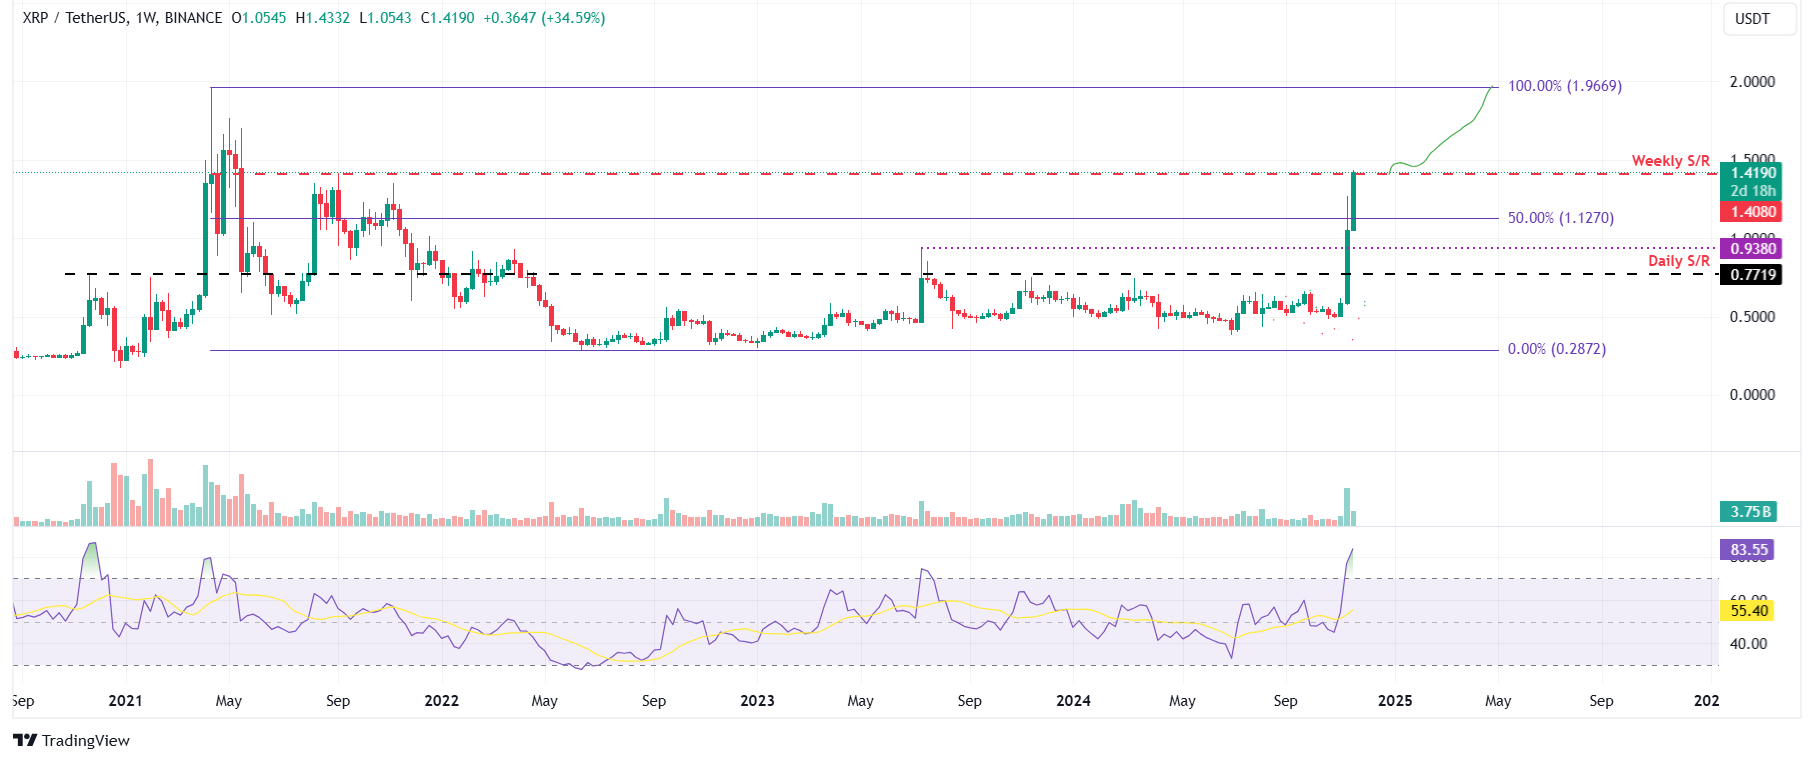
XRP/USDT weekly chart
XRP on-chain metrics show bullish signs
CryptoQuant’s weekly report released on Wednesday further supports Ripple’s bullish outlook. The report highlights that the price of XRP has also coincided with record-high decentralized exchange (DEX) activity on the XRP Ledger (XRPL) network.
DEX volume totaled $3.5 million on November 15, with 80 traders. The new Automated Market Maker (AMM) DEX was launched on XRPL in May of this year to complement the network’s Limit Order Book DEX that has been operating. Meanwhile, total active addresses on the network spiked, reaching the highest daily level since early 2024.
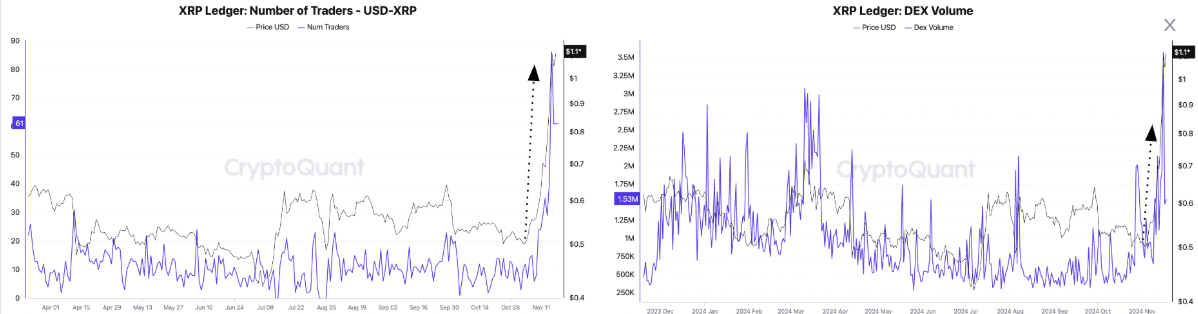
XRPL traders and DEX volume chart. Source: CryptoQuant
According to Coinglass’s data, the futures’ Open Interest (OI) in Ripple at exchanges rose from $1.81 billion on Thursday to $2.43 billion on Friday, a new all-time high. An increasing OI represents new or additional money entering the market and new buying, which also adds to credence to the bullish trend.
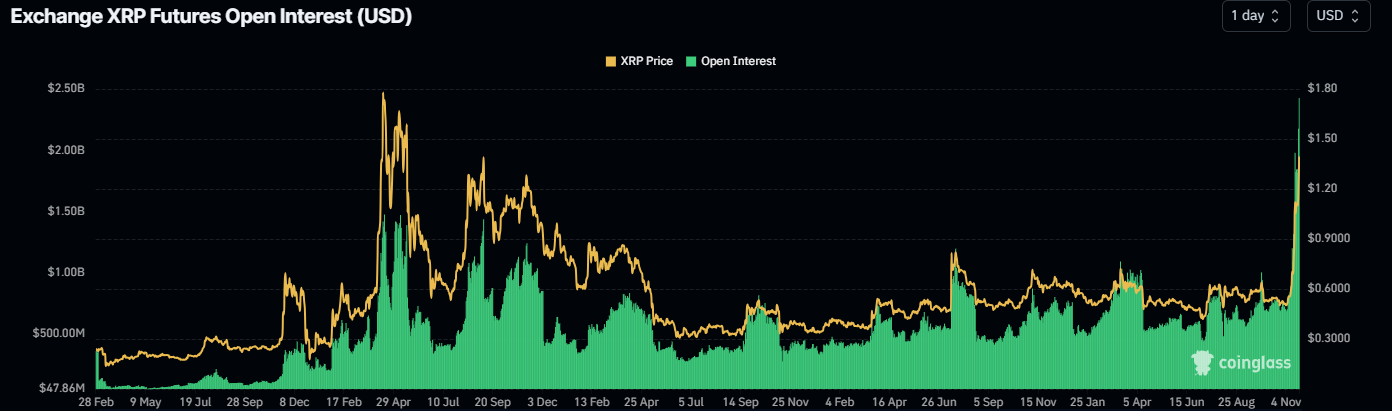
Ripple Open Interest chart. Source: Coinglass
Recommended Articles


