

Two Reasons Why Bitcoin’s Path to $90,000 Faces Roadblocks
Leading cryptocurrency Bitcoin (BTC) has been on a relentless bull run, consistently breaking new all-time highs over the past week. As of this writing, the king coin exchanges hands at $85,662, recording a 5% increase in the last 24 hours.
As the market anticipates Bitcoin’s price rally toward the $90,000 mark, signs suggest this milestone might remain out of reach. This analysis delves into two critical factors that could slow down or even stall the cryptocurrency’s ascent toward this price target.
Bitcoin Sends Cautionary Signals
Bitcoin’s exploding open interest is a key factor that may prevent its ascent to the $90,000 price mark in the short term. Per CryptoQuant’s data, over the past week, the futures market has seen an addition of over $16 billion in open positions. This marks a significant increase in leverage. As of this writing, BTC’s open interest is at $25 billion, its highest since August 2022.
Open interest tracks the total number of outstanding contracts (options and futures) that have yet to be settled. During a price rally, a surging open interest is a bullish signal. However, when an asset’s price rises too quickly, a high open interest can signal potential instability.
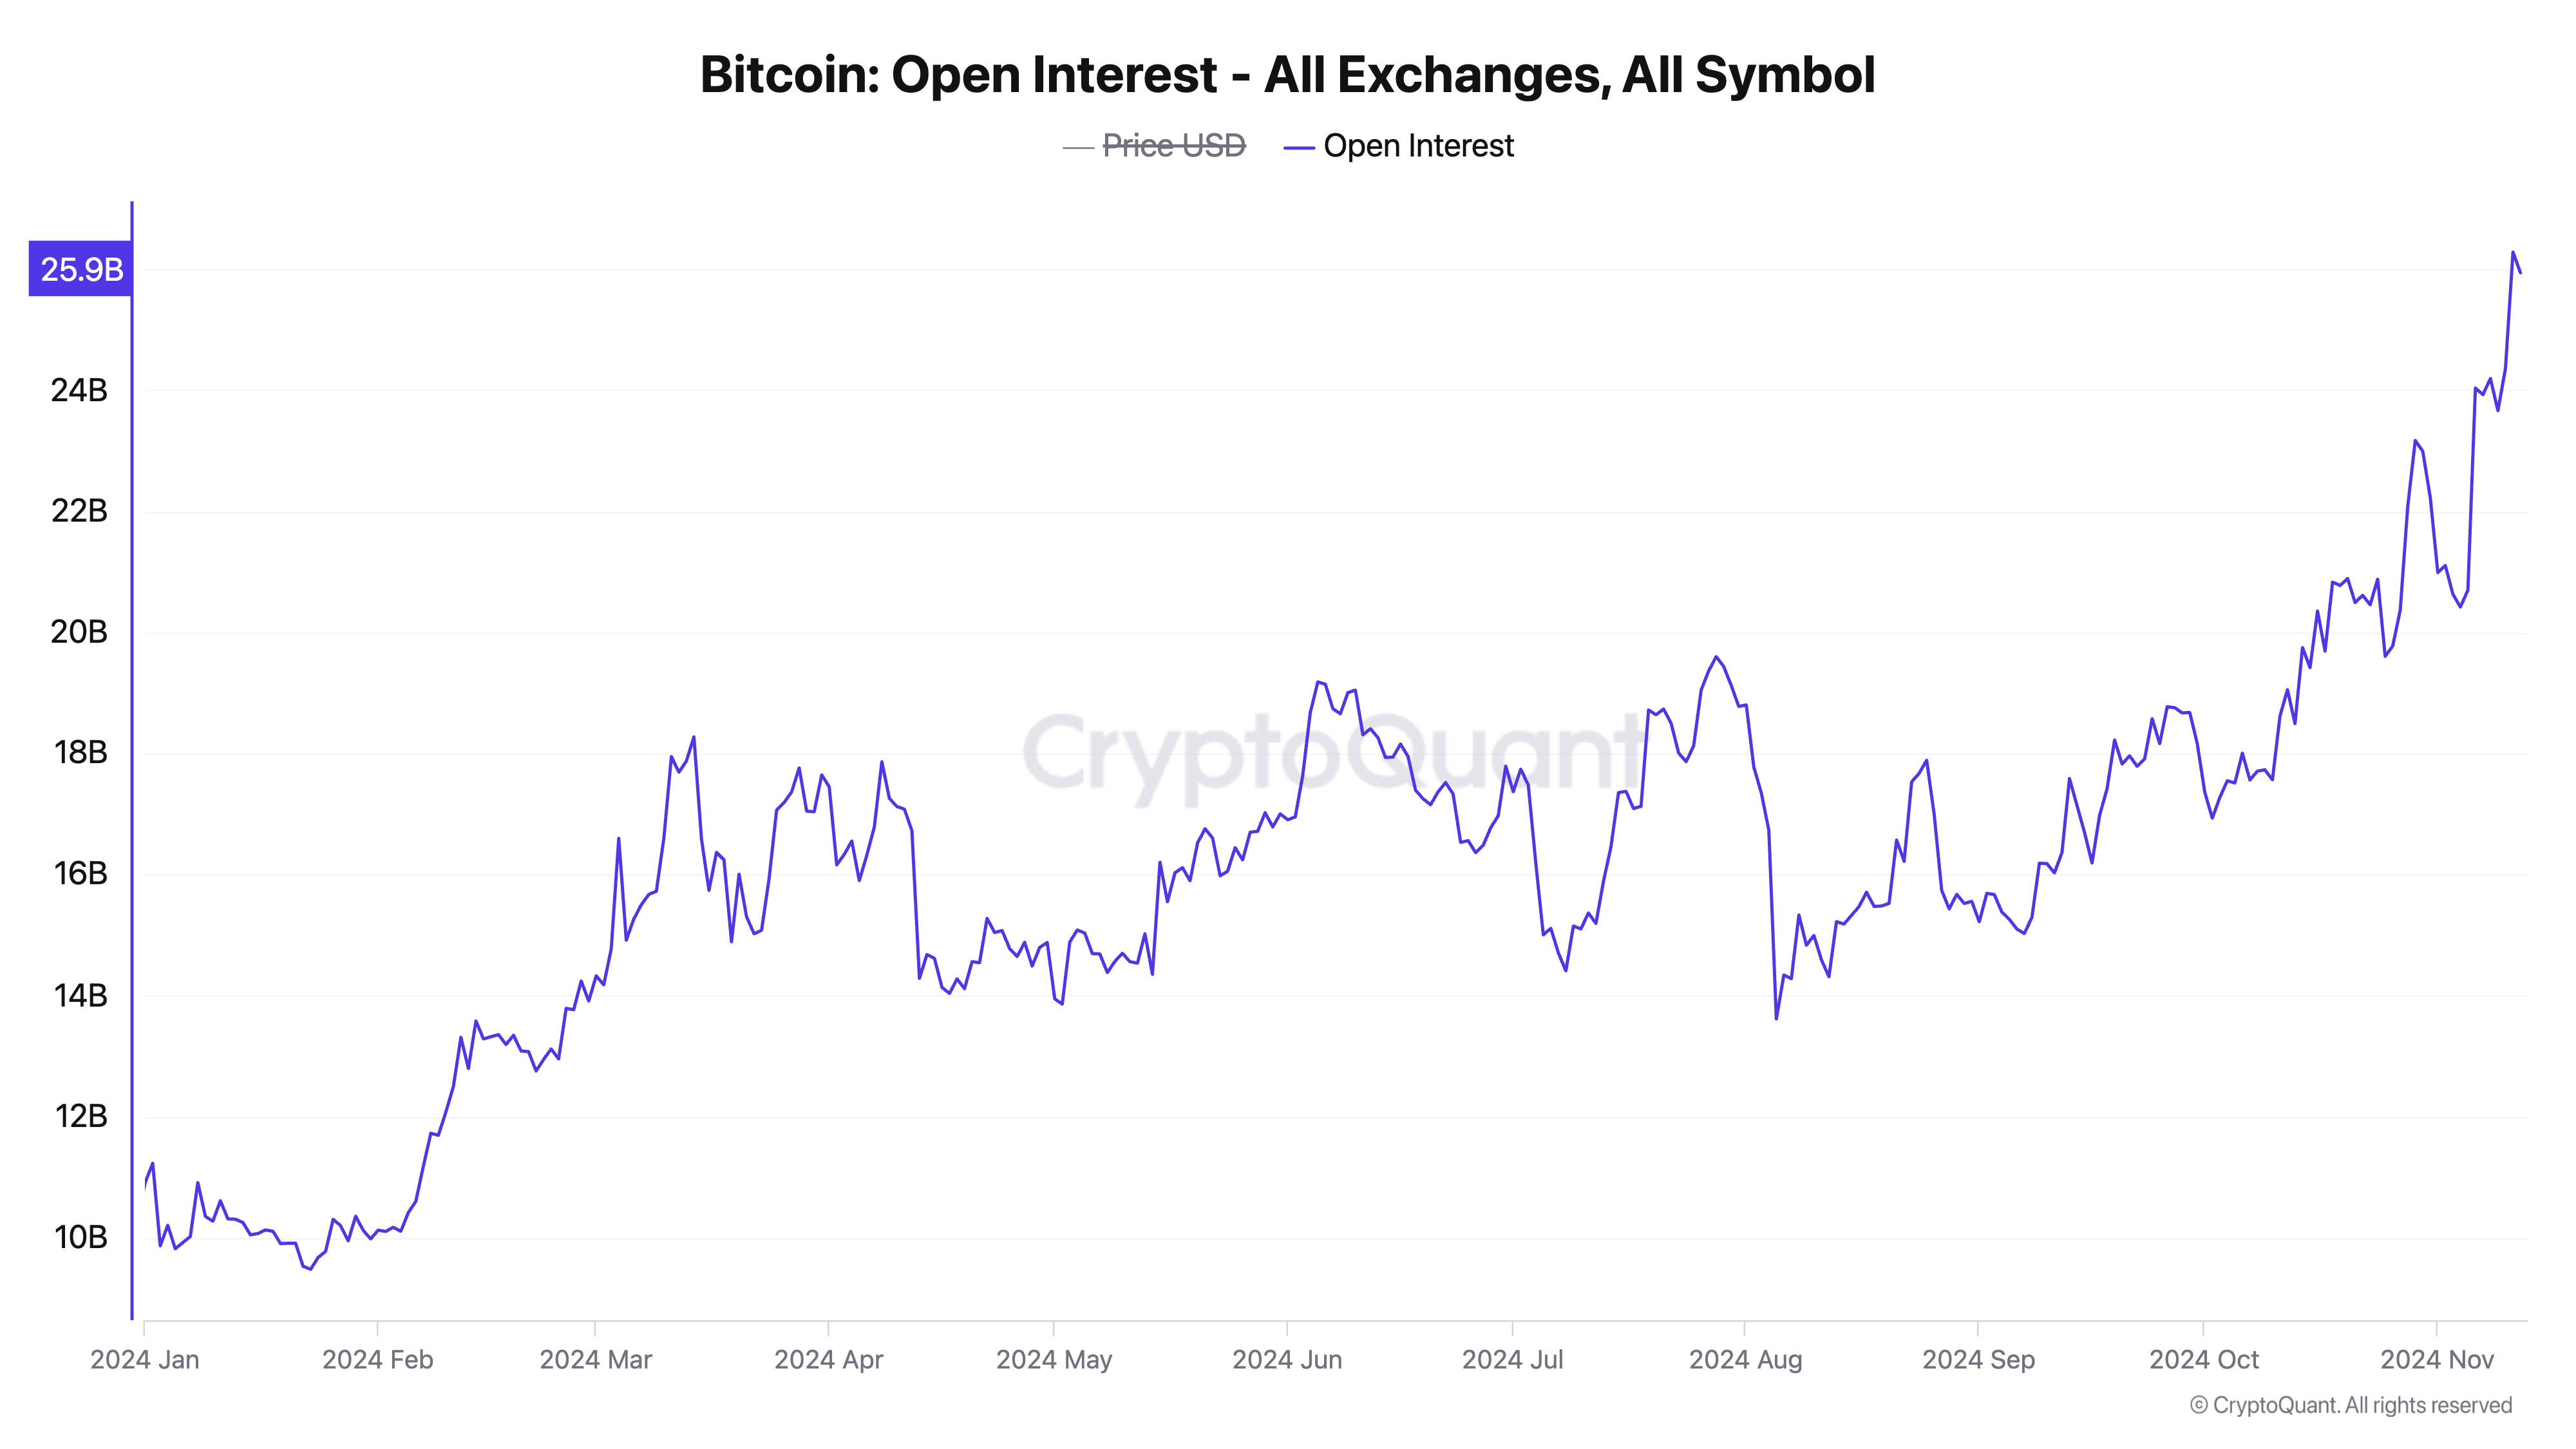 Bitcoin Open Interest. Source: CryptoQuant
Over the past week, Bitcoin’s price has rallied by 25%. The accompanying spike in open interest indicates that many investors have taken leveraged positions. This has created an environment vulnerable to liquidation cascades if prices start to drop.
If the coin’s price reverses, even slightly, these leveraged positions can trigger a chain reaction. When highly leveraged traders are forced to close out positions to avoid losses, the resulting sell orders can intensify downward pressure, causing the coin’s price to decline further and triggering additional liquidations.
Furthermore, BTC’s rising funding rate is another factor that may keep its price under $90,000 in the short term. It is currently at 0.015%, its highest value since the end of March when BTC suffered a more significant correction.
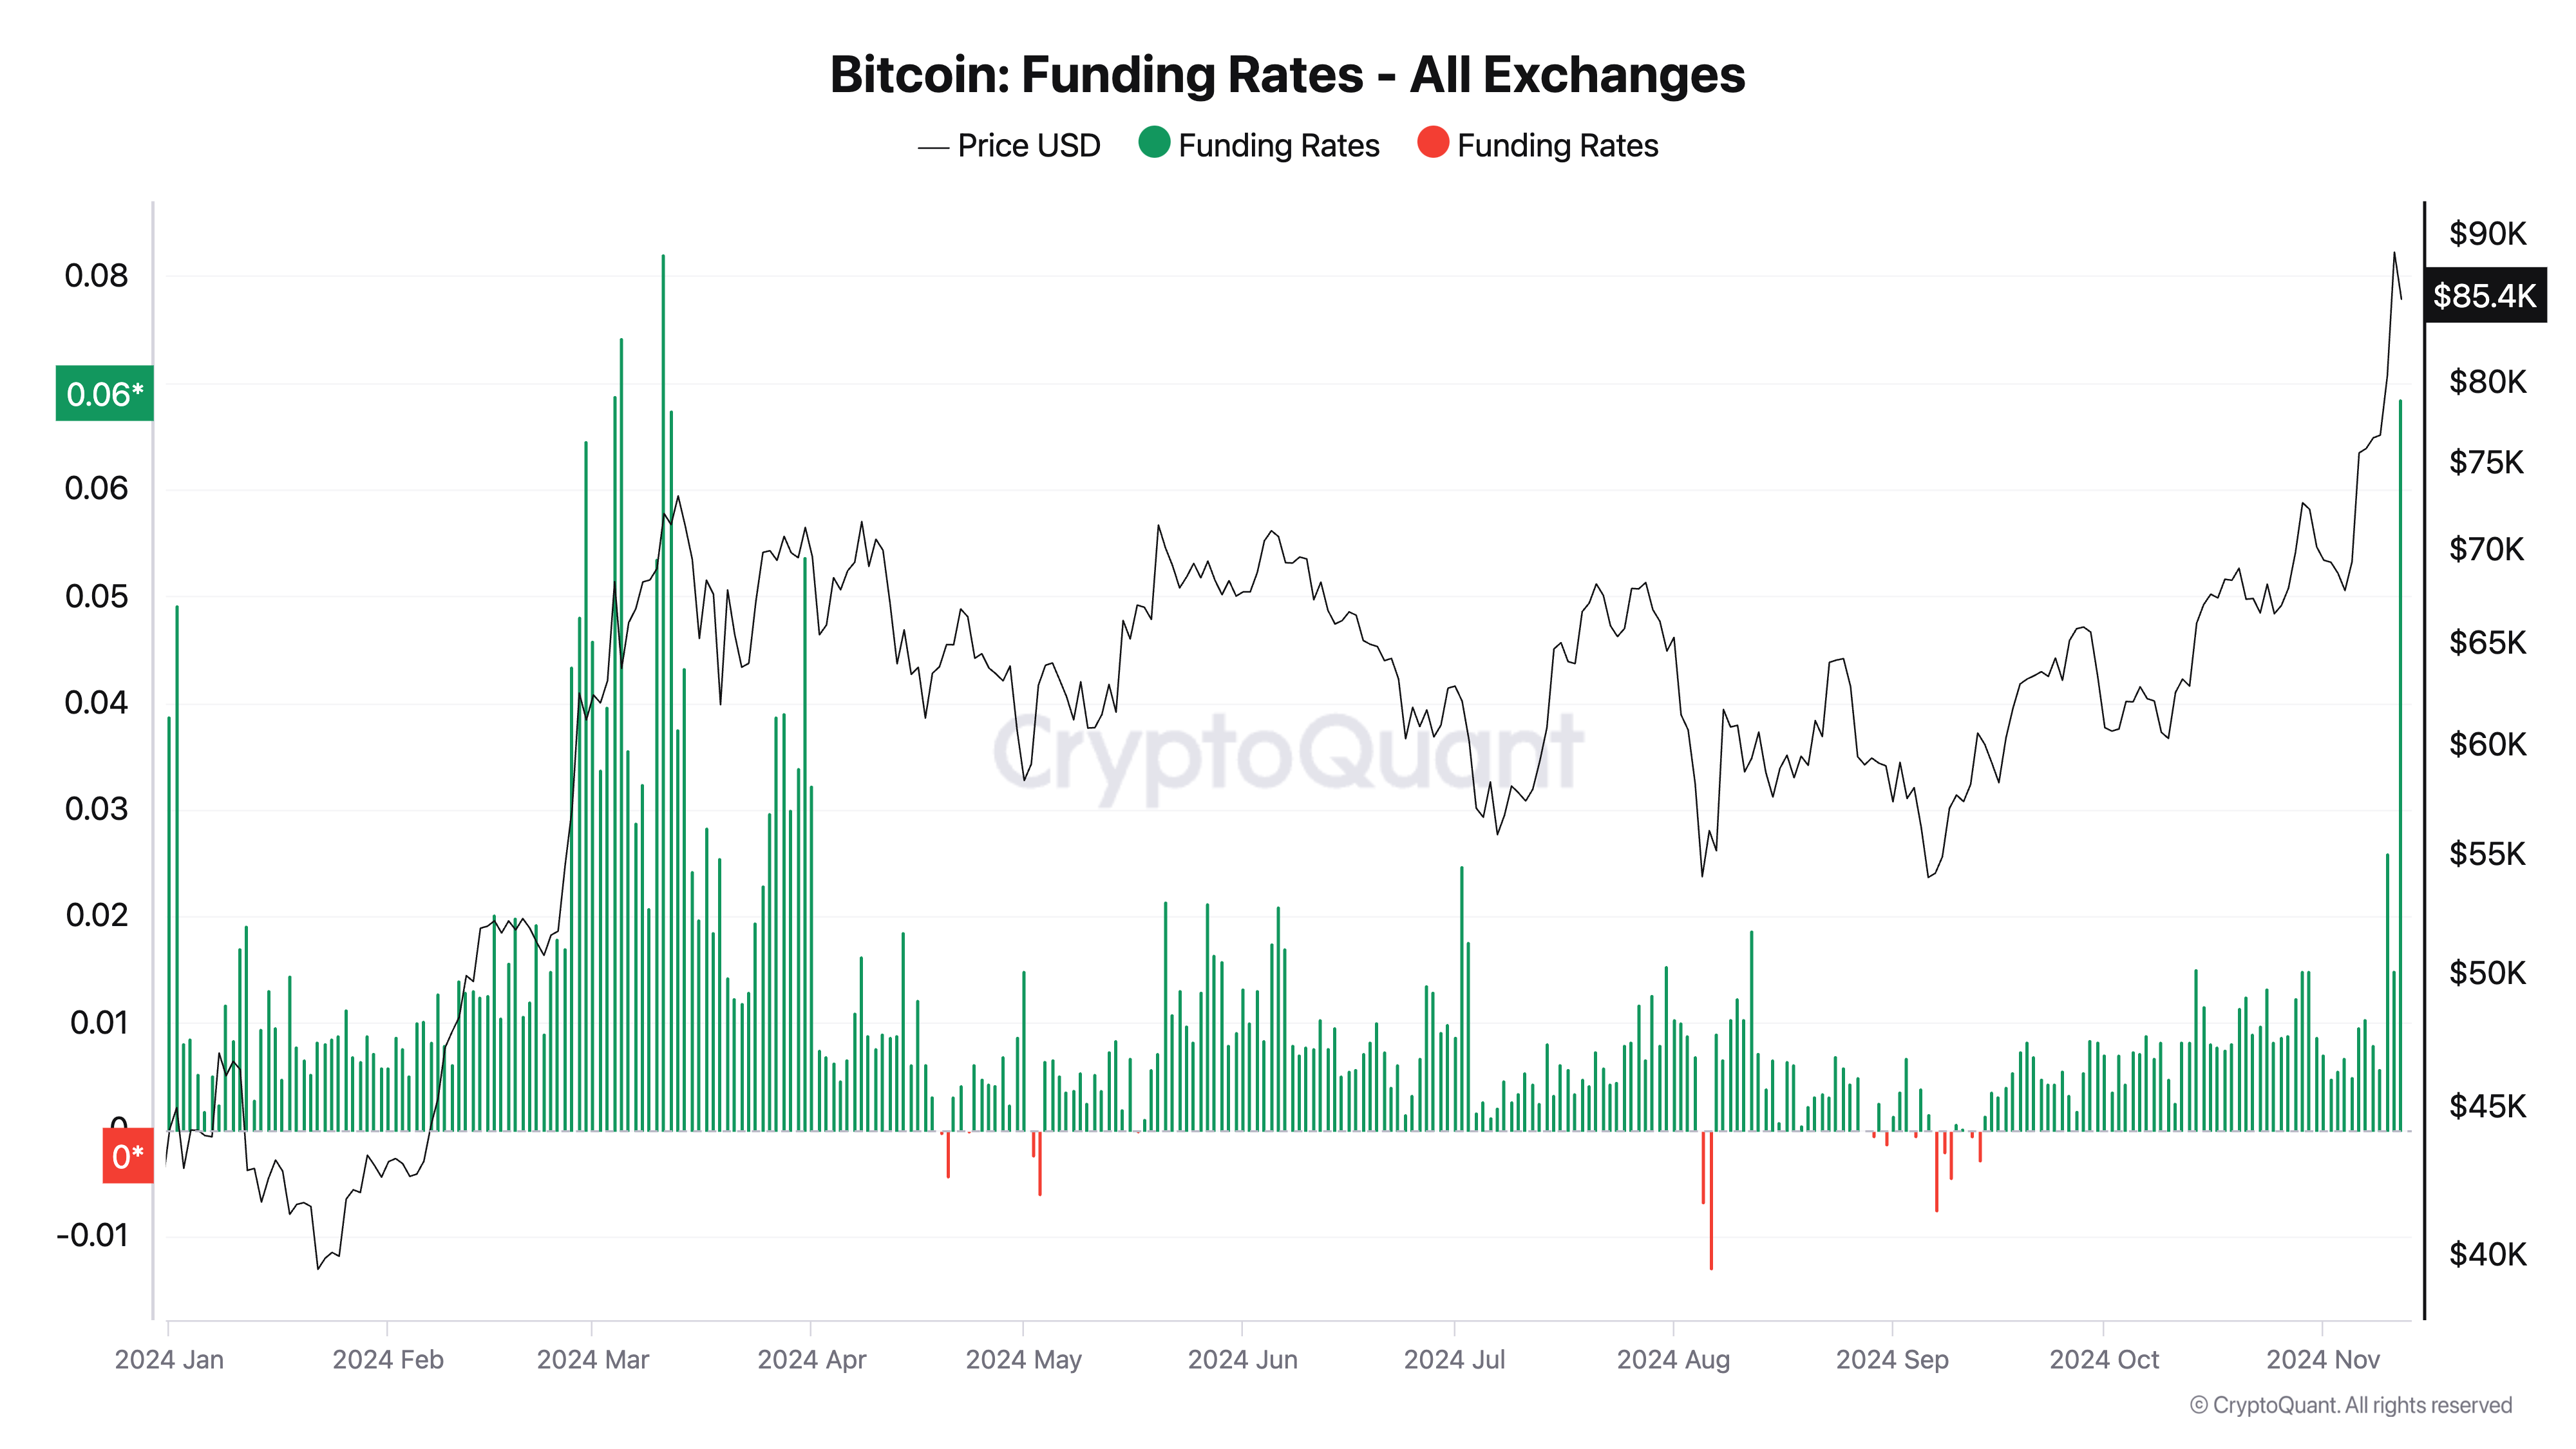 Bitcoin Funding Rate. Source: CryptoQuant
In futures trading, the funding rate is a periodic fee paid between traders holding long and short positions, incentivizing balance between the two. However, when the funding rate surges significantly, it typically signals that buying side of the market is heavily dominant. This is a bearish signal that usually precedes a price pullback.
BTC Price Prediction: Coin Is Overbought
When long positions become expensive to maintain, some traders may start to close their positions to avoid high funding costs, which can put downward pressure on the asset’s price. Additionally, if the asset’s price begins to decline, heavily leveraged long positions are at risk of liquidation, creating a cascade effect that can lead to a sharp drop in price.
Bitcoin’s overbought readings from its Relative Strength Index (RSI) confirm the bearish outlook above. As of this writing, the coin’s RSI is 74.83.
The RSI indicator measures an asset’s overbought and oversold market conditions. It ranges between 0 and 100, with values above 70 suggesting that the asset is overbought and due for a correction. On the other hand, values below 30 indicate that the asset in question is oversold and may be poised for a rebound.
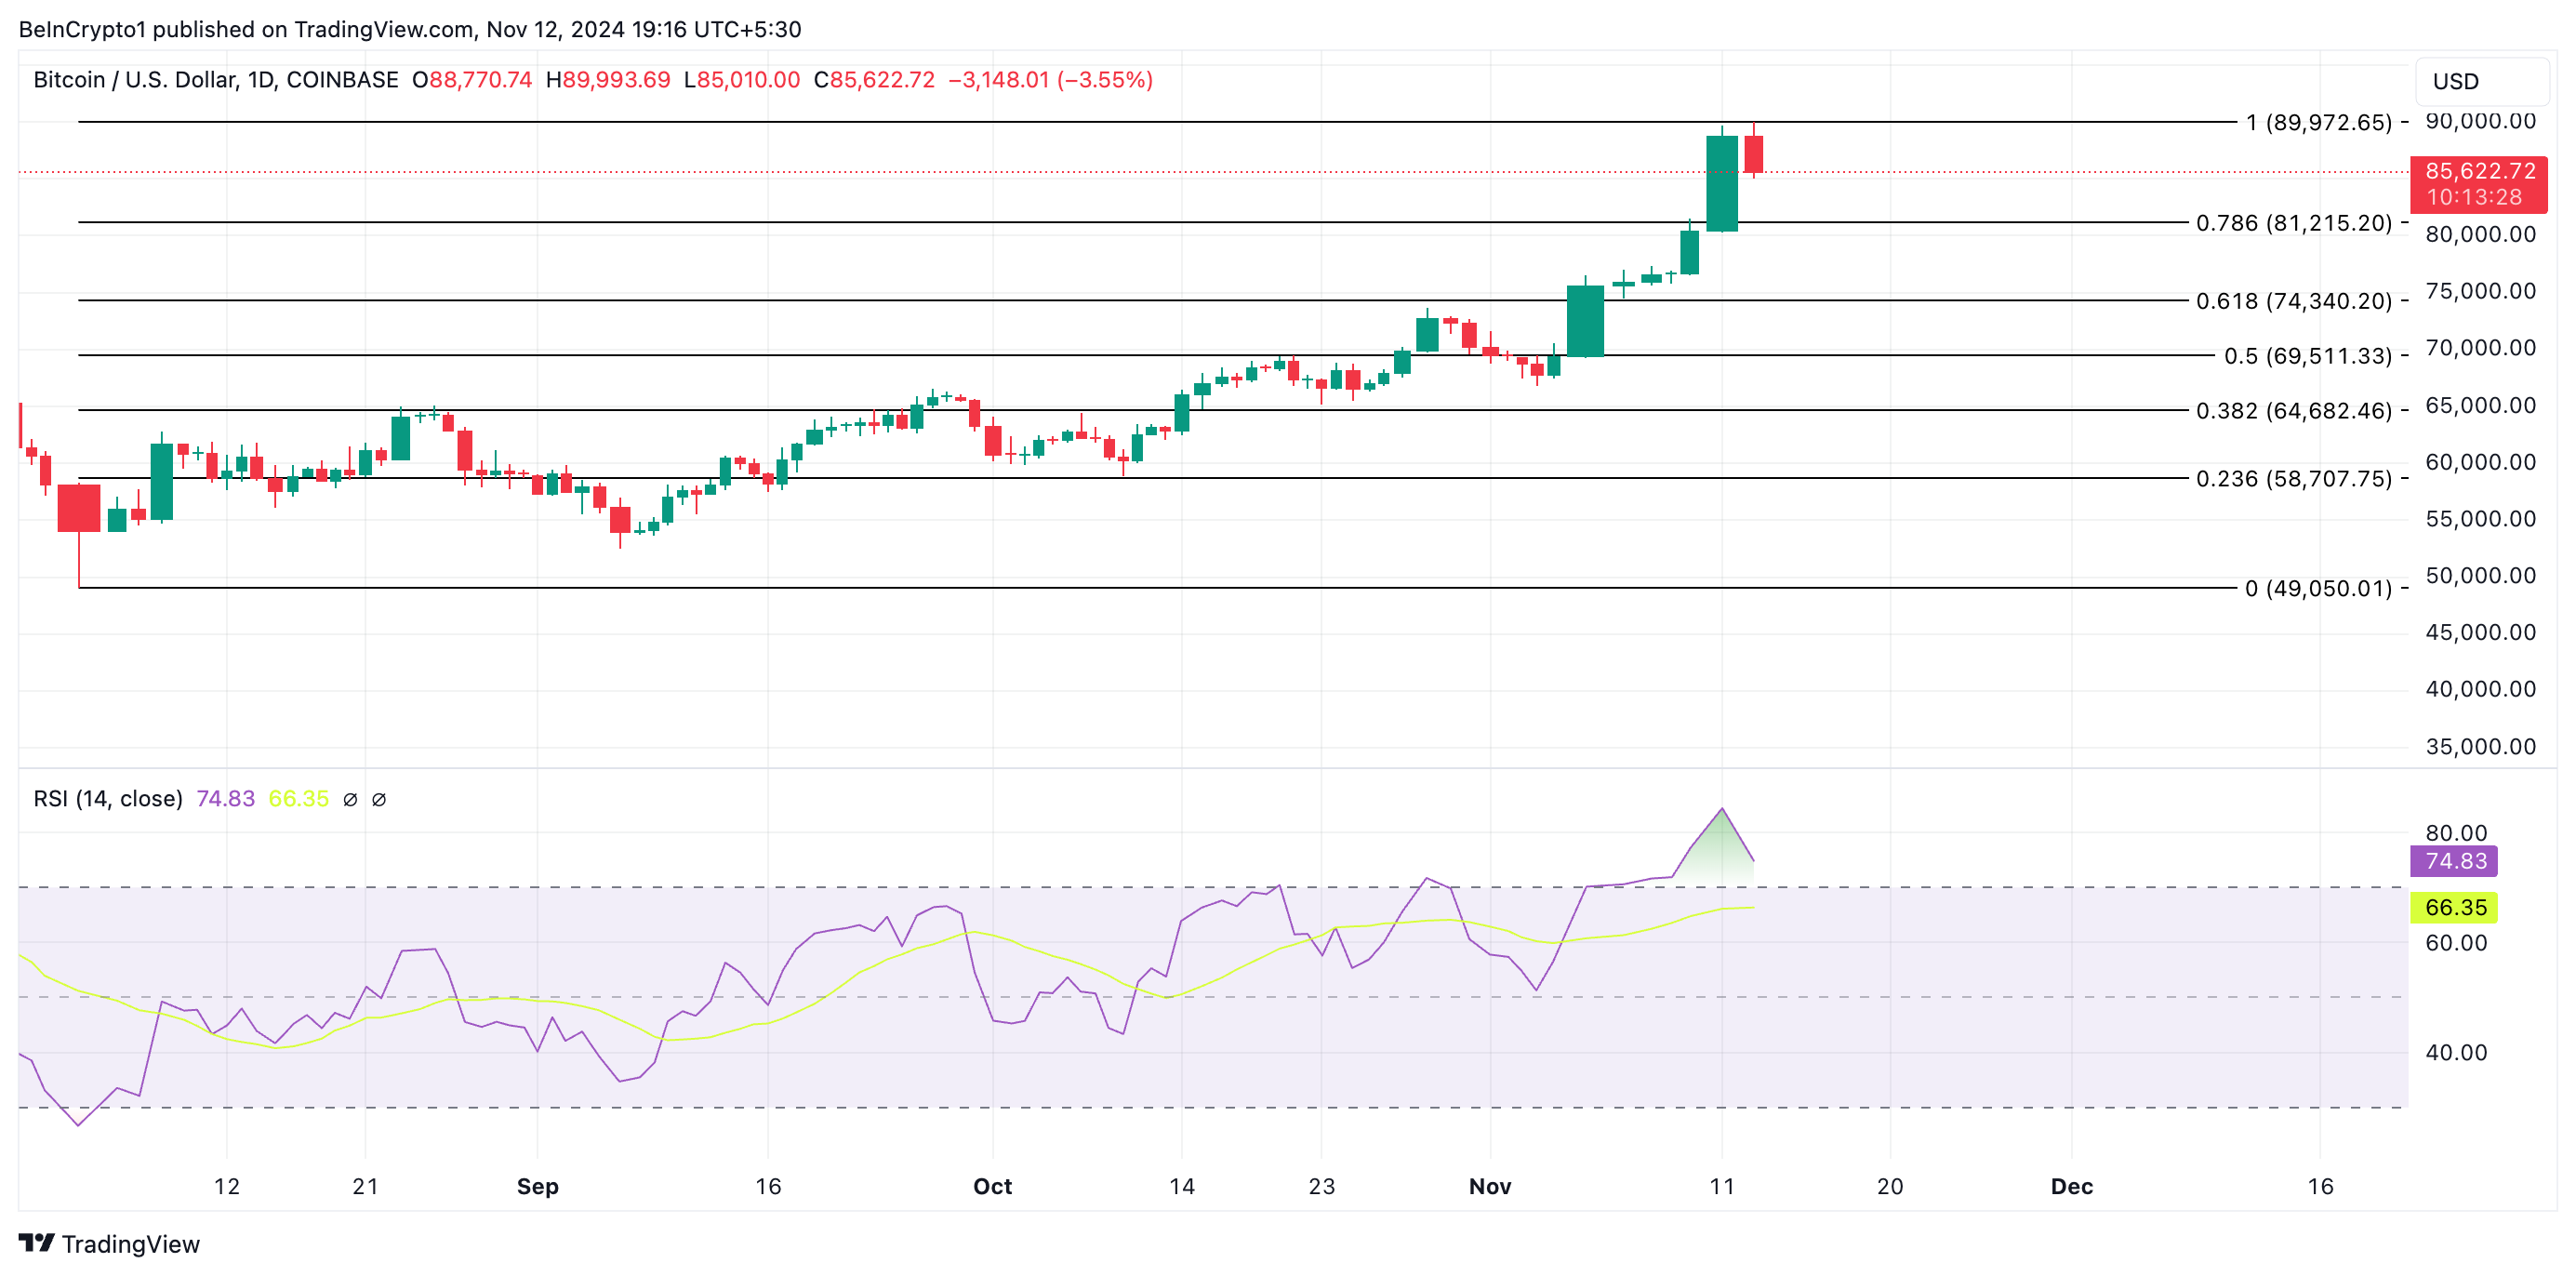 Bitcoin Price Analysis. Source: TradingView
At 74.83, BTC’s RSI indicates it is significantly overbought and may soon decline. If these factors hold true and Bitcoin experiences a temporary pullback, it may fall to $81,215. If this level fails to hold, the coin’s price may fall further to $74,340.
However, if buying pressure strengthens, the coin may reclaim its current all-time high of $89,972 and rally past it into the $90,000 price territory.
Recommended Articles


