

Ethereum Weekly Volume Hits $60 Billion As ETH Aims For Yearly Highs

Source Newsbtc

Ethereum has staged an impressive 35% rally since last Tuesday, marking a bullish breakout as it tests crucial supply levels for the first time since late July. Investor sentiment is increasingly optimistic, driven by a surge in Ethereum’s on-chain activity. 

Key data from IntoTheBlock reveals that transaction volume on Ethereum’s mainnet has reached its highest levels since July, a bullish signal highlighting renewed interest and activity in the network. This surge in volume is often seen as confirmation of a breakout, aligning with expectations from investors who have anticipated a strong rally toward Ethereum’s yearly highs. 

With momentum building, ETH now stands at a pivotal point: if it can maintain strength above these new levels, the stage may be set for further upside as the broader crypto market rallies alongside Bitcoin. 

The next few days will be crucial for Ethereum as traders watch to see if the bullish sentiment can sustain and propel ETH higher into new price territory.

Ethereum Bullish Trend Begins

Ethereum has entered a new bullish phase after eight months of consistent selling pressure and significant accumulation by smart money. Following a long period of subdued price action, ETH is finally rising, signaling a trend reversal many analysts and investors eagerly awaited. 

Data shared by IntoTheBlock on X shows that Ethereum’s mainnet transaction volume has surged significantly, with nearly $60 billion settled over the past week—the highest level since July. This spike in volume is a clear indicator of renewed market interest, and it suggests that more investors are actively trading and accumulating ETH. 
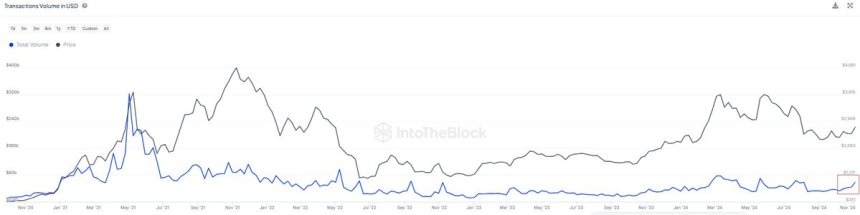
Ethereum transactions on the mainnet hit $60B in a week

When transaction volumes rise alongside price increases, it often signals healthy demand and strong market confidence, supporting the likelihood of a sustained bullish trend.

The next few months are expected to be volatile as speculative interest and trading activity heat up, with many traders positioning for substantial gains. Despite the anticipated price swings, analysts agree that Ethereum’s next major target is its yearly high of $4,000. Breaking this level would confirm Ethereum’s bullish momentum and set the stage for potential new all-time highs, aligning with the broader market’s optimism.

ETH Consolidates Above $3,000 

Ethereum is trading at $3,180, following a recent push to a local high of $3,250. After a strong weekend rally, the price paused, hinting at the need for consolidation before another potential breakout. This period of sideways movement could be essential for ETH to establish support and prepare for further upside, as it allows buyers to gather momentum while absorbing any short-term selling pressure.
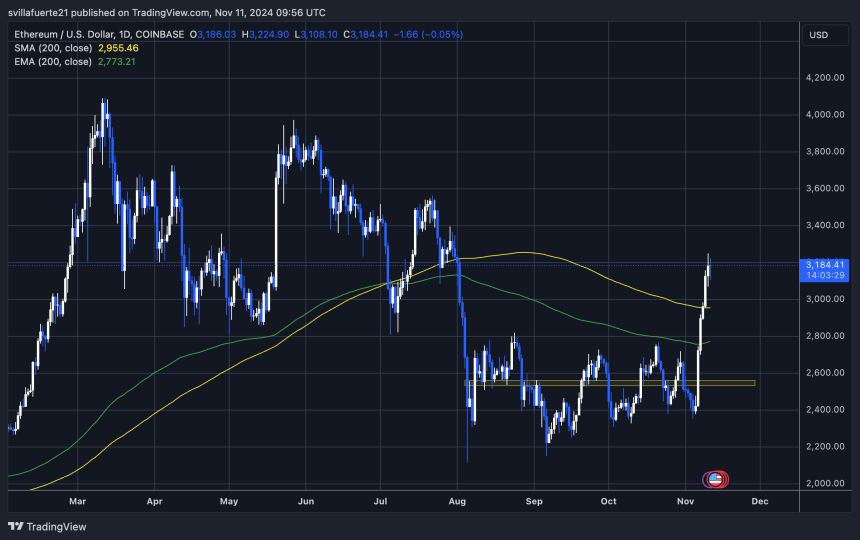
ETH consolidates above $3,000

Key technical levels show that bullish sentiment is likely to strengthen if ETH maintains its position above $2,950, aligned with the 200-day moving average (MA). Holding this critical support level would signal buyers remain in control, setting up ETH for a potential rally toward $3,500 soon. 

However, it’s also possible that ETH could take a few days to build up the momentum needed for its next substantial move as investors assess the recent rally and consider upcoming catalysts.

In the meantime, the market appears optimistic, with analysts noting that maintaining levels above the 200-day MA is crucial for confirming the long-term bullish trend. ETH’s consolidation phase could be the foundation for continuing its upward trajectory.

Featured image from Dall-E, chart from TradingView

Disclaimer: For information purposes only. Past performance is not indicative of future results.
placeholder
Japanese Yen rallies to February 18 high as upbeat wage data and GDP lift BoJ hike betsThe USD/JPY pair declines for the second straight day – also marking the fourth day of a fall in the previous five – and sinks to its lowest level since February 18, around mid-153.00s during the Asian session on Tuesday.
Author  FXStreet
Sep 08, Tue
The USD/JPY pair declines for the second straight day – also marking the fourth day of a fall in the previous five – and sinks to its lowest level since February 18, around mid-153.00s during the Asian session on Tuesday.
placeholder
US dollar clings to nine-week lows near 98.4 as Brent nears $100 and the yen hits a seven-month high — five events to watch todayThe dollar is pinned near nine-week lows even after a blockbuster jobs report, as an oil spike toward $100, a surging yen and China's reflation data crowd the driver's seat. Five key events to watch today: Brent at $99.46, USD/JPY at 154, China CPI/PPI, PBOC gold buying, and Thursday's PPI / Friday's CPI ahead of the September 15-16 FOMC.
Author  Eric Nkando
Sep 09, Wed
The dollar is pinned near nine-week lows even after a blockbuster jobs report, as an oil spike toward $100, a surging yen and China's reflation data crowd the driver's seat. Five key events to watch today: Brent at $99.46, USD/JPY at 154, China CPI/PPI, PBOC gold buying, and Thursday's PPI / Friday's CPI ahead of the September 15-16 FOMC.
placeholder
Brent holds above $100 as tanker attacks tighten supply — but four forces are capping the rallyBrent crude is holding above $100 a barrel for a second session, its first close above the level since late July, as tanker attacks near the Strait of Hormuz squeeze an already tight physical market. Yet the rally has been gradual: 8.3 mb/d of Gulf output is still shut in, diesel is at a record, and forecasts now range from $74 to $100.
Author  Irene Q.
Sep 10, Thu
Brent crude is holding above $100 a barrel for a second session, its first close above the level since late July, as tanker attacks near the Strait of Hormuz squeeze an already tight physical market. Yet the rally has been gradual: 8.3 mb/d of Gulf output is still shut in, diesel is at a record, and forecasts now range from $74 to $100.
placeholder
US August CPI lands tonight: after a 5.4% PPI shock, will the Fed hike on September 16?US August PPI came in at 5.4% year-on-year, above the 5.3% consensus, with core PPI at 4.6%. Traders have pushed the odds of a 25bp Fed hike on September 15-16 to around 70%. Tonight's CPI is the last major inflation print before the decision — here is the full calendar, the consensus numbers, and what a hot versus cool reading would mean for the dollar, yields, gold and stocks.
Author  Irene Q.
Sep 11, Fri
US August PPI came in at 5.4% year-on-year, above the 5.3% consensus, with core PPI at 4.6%. Traders have pushed the odds of a 25bp Fed hike on September 15-16 to around 70%. Tonight's CPI is the last major inflation print before the decision — here is the full calendar, the consensus numbers, and what a hot versus cool reading would mean for the dollar, yields, gold and stocks.
placeholder
Gold Price Forecast: PPI and Oil Prices Fuel Inflation Concerns, Can CPI Change Gold's Direction?As of the Asian session on September 11, gold prices (XAUUSD) remained in weak consolidation today after dropping sharply to near $4,300 on Thursday, with the latest price trading around
Author  TradingKey
Sep 11, Fri
As of the Asian session on September 11, gold prices (XAUUSD) remained in weak consolidation today after dropping sharply to near $4,300 on Thursday, with the latest price trading around
goTop
quote