

GRASS Price Surges Nearly 200% In One Week, Riding High on Airdrop and BTC Rally
The recent price surge in GRASS, which is up 187.99% in the last seven days, appears to be fueled by the success of its airdrop and BTC new all-time highs. These factors, along with the upcoming listing of GRASS on Binance Futures with up to 75x leverage, have created a wave of bullish momentum.
However, the current RSI shows that GRASS is still in overbought territory, suggesting caution may be needed as buying pressure could fade.
GRASS RSI Is Above Overbought Stage
The RSI for GRASS has surged significantly following recent price increases, reaching 71.8, up from 55 just two days ago. This rapid rise indicates strong buying pressure, which has pushed the indicator into an overbought zone.
Such a swift movement highlights that GRASS has been experiencing an intense wave of investor interest. It’s important to remember that GRASS RSI reached roughly 85, days after its airdrop.
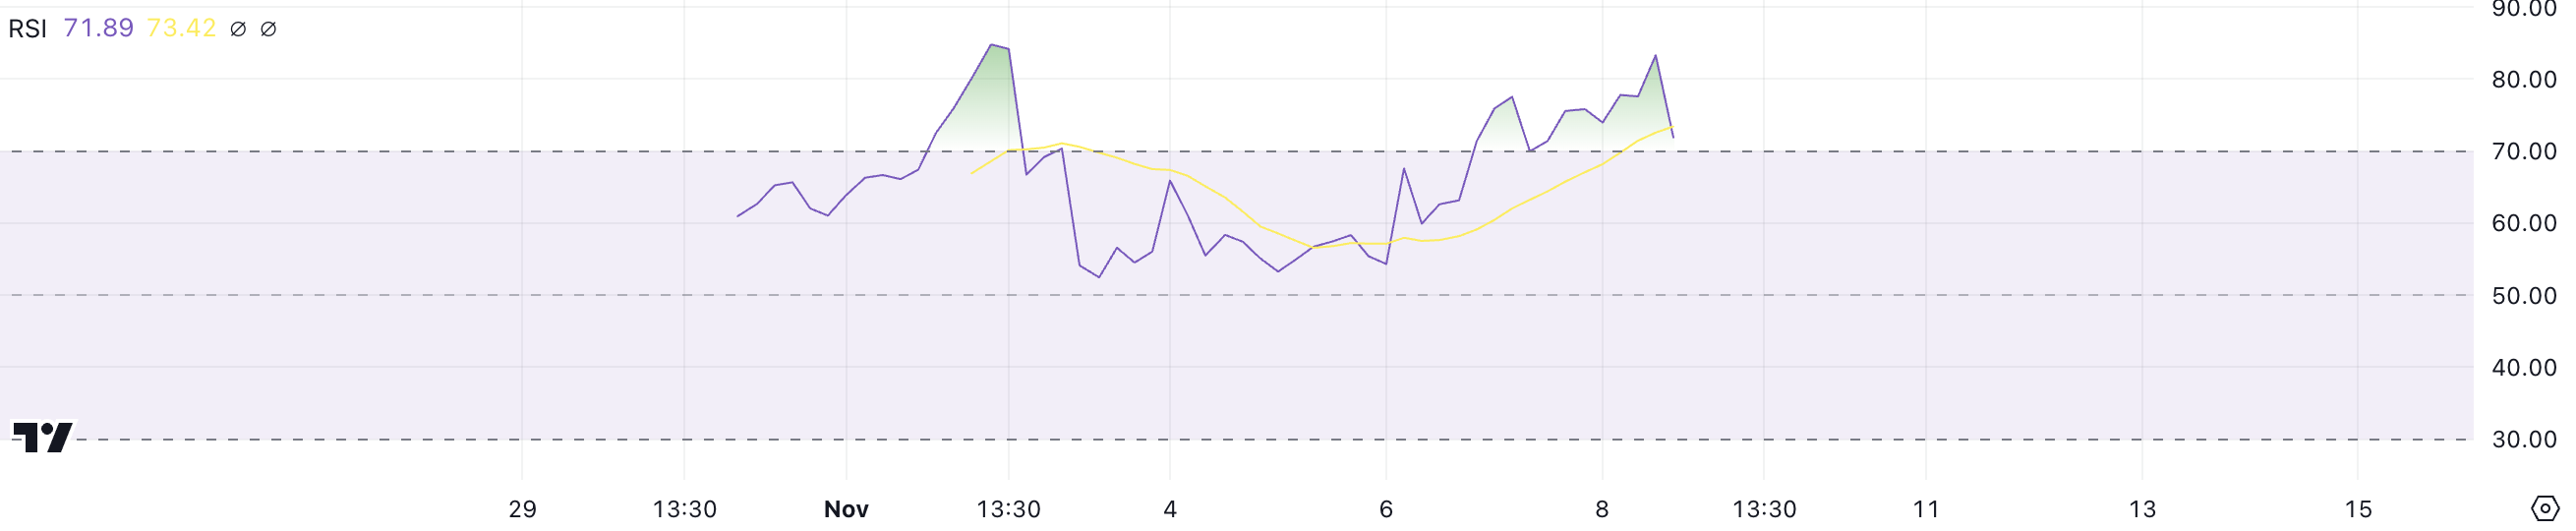 GRASS RSI. Source: TradingView
The Relative Strength Index (RSI) is a momentum indicator that measures the speed and change of price movements. RSI values above 70 typically signal that an asset is overbought, while values below 30 indicate it is oversold. With the current RSI at 71.8, GRASS is in overbought territory, suggesting that the recent enthusiasm may have pushed prices too far, too fast.
However, since RSI has been dropping heavily since yesterday, it could indicate a potential cooling-off period, where the buying momentum is fading, and a price correction might be imminent.
Staked GRASS Is Now Stable
The cumulative staked GRASS has remained stable at 26,600,000 since November 6. This stability follows a slight decrease from its peak earlier in the month, suggesting that staking activity has settled into a consistent pattern.
The recent trends indicate that most of those who were actively staking have now locked in their positions.
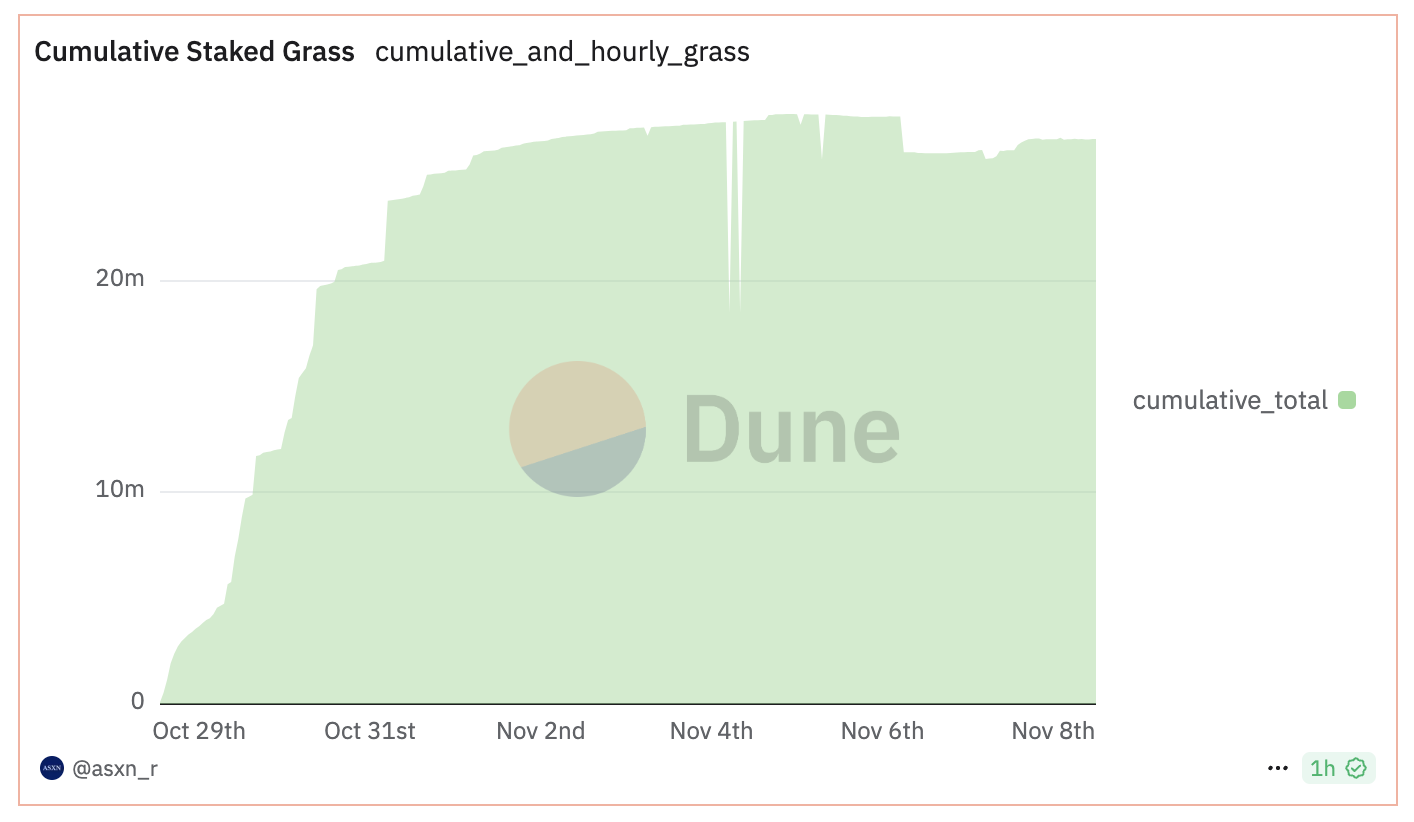 Cumulative Staked GRASS. Source: Dune
Tracking the staked coin metric is crucial because it provides insight into investor confidence and the commitment to holding the asset long-term. A higher amount of staked GRASS suggests that investors are less likely to sell, reducing available supply and potentially increasing price stability. On November 4 and 5, the staked amount approached 28 million but subsequently declined and stabilized at a slightly lower level.
This movement implies that while enthusiasm for staking was strong initially, some participants likely took profits or withdrew, leading to a more stable base of long-term stakers. This current stability may reflect a period of consolidation where committed investors are holding firm.
GRASS Price Prediction: A Potential 28,5% Correction?
Analyzing GRASS Ichimoku Cloud chart shows that the price is well above the cloud, suggesting strong bullish momentum, as the whole Solana ecosystem appears to be pumping.
The first key support zone lies around the upper edge of the cloud, approximately at the $2.9 level, which aligns with where the cloud begins to thicken.
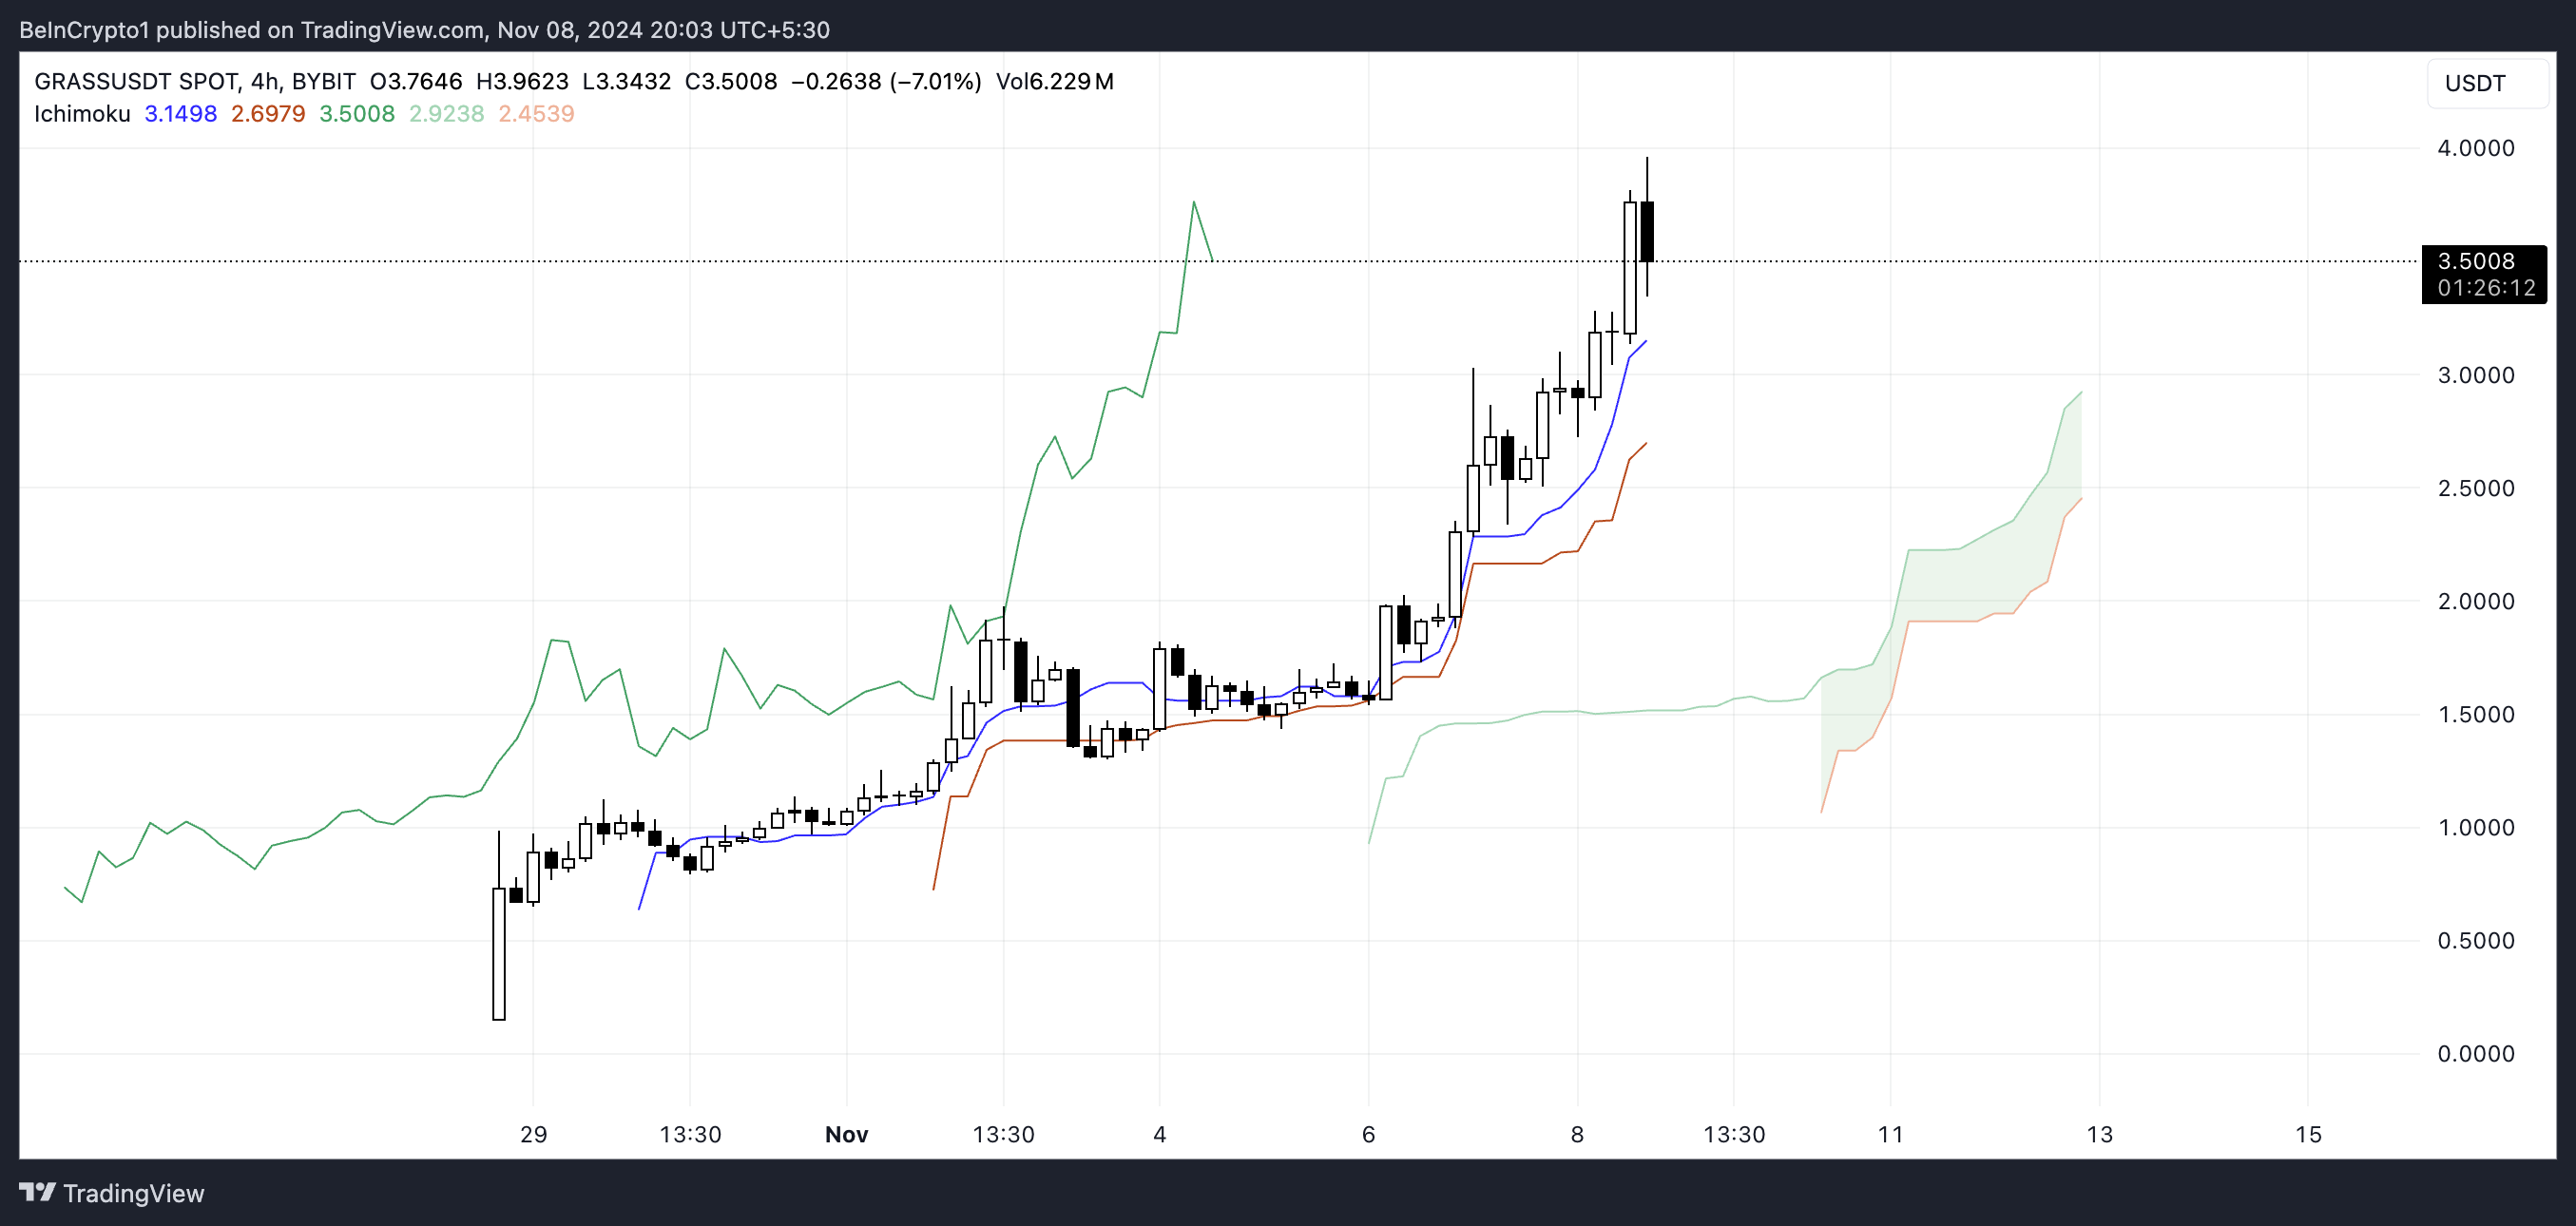 GRASS Ichimoku Cloud Chart. Source: TradingView
If the price declines further, the lower edge of the cloud, around the $2.5 level, will serve as the next significant support. That would mean a potential 28.5% price correction as GRASS becomes one of the coins attracting more attention among newly launched Solana coins.
If BTC continues its strong momentum and the Binance listing brings strong buying pressure, GRASS could continue its uptrend, probably breaking the $4 threshold soon.
Recommended Articles


