

Cardano's ADA and NEON lead $47 million cliff unlocks next week
- ADA, NEON and ENA are among the tokens set for $47 million worth of cliff unlocks next week.
- Cardano's ADA surged over 14% on Friday, stretching its weekly gains above the 20% mark.
- EIGEN, HFT and MAVIA will also see cliff unlocks.
Cardano's ADA and NEON lead the crypto market in another round of cliff unlocks worth $46.9 million next week. The unlocks comes amid extended gains across several cryptocurrencies after Donald Trump emerged as the winner of the US presidential election last Tuesday.
Crypto market set to see supply injection of nearly $47 million
Tokenomist on Friday revealed that several tokens will be adding to their circulating supply between November 11 and 17 next week. The tokens involved include Neon (NEON), Cardano (ADA), Ethena (ENA), Eigenlayer (EIGEN), Hashflow (HFT) and Mavia (MAVIA).
The tokens will see a combined unlock volume of $46.9 million, led by NEON, which will add $21.9 million to its current supply. NEON has unlocked 50% of its total supply and will release 53.9 million NEON tokens to community members, advisors and private investors.
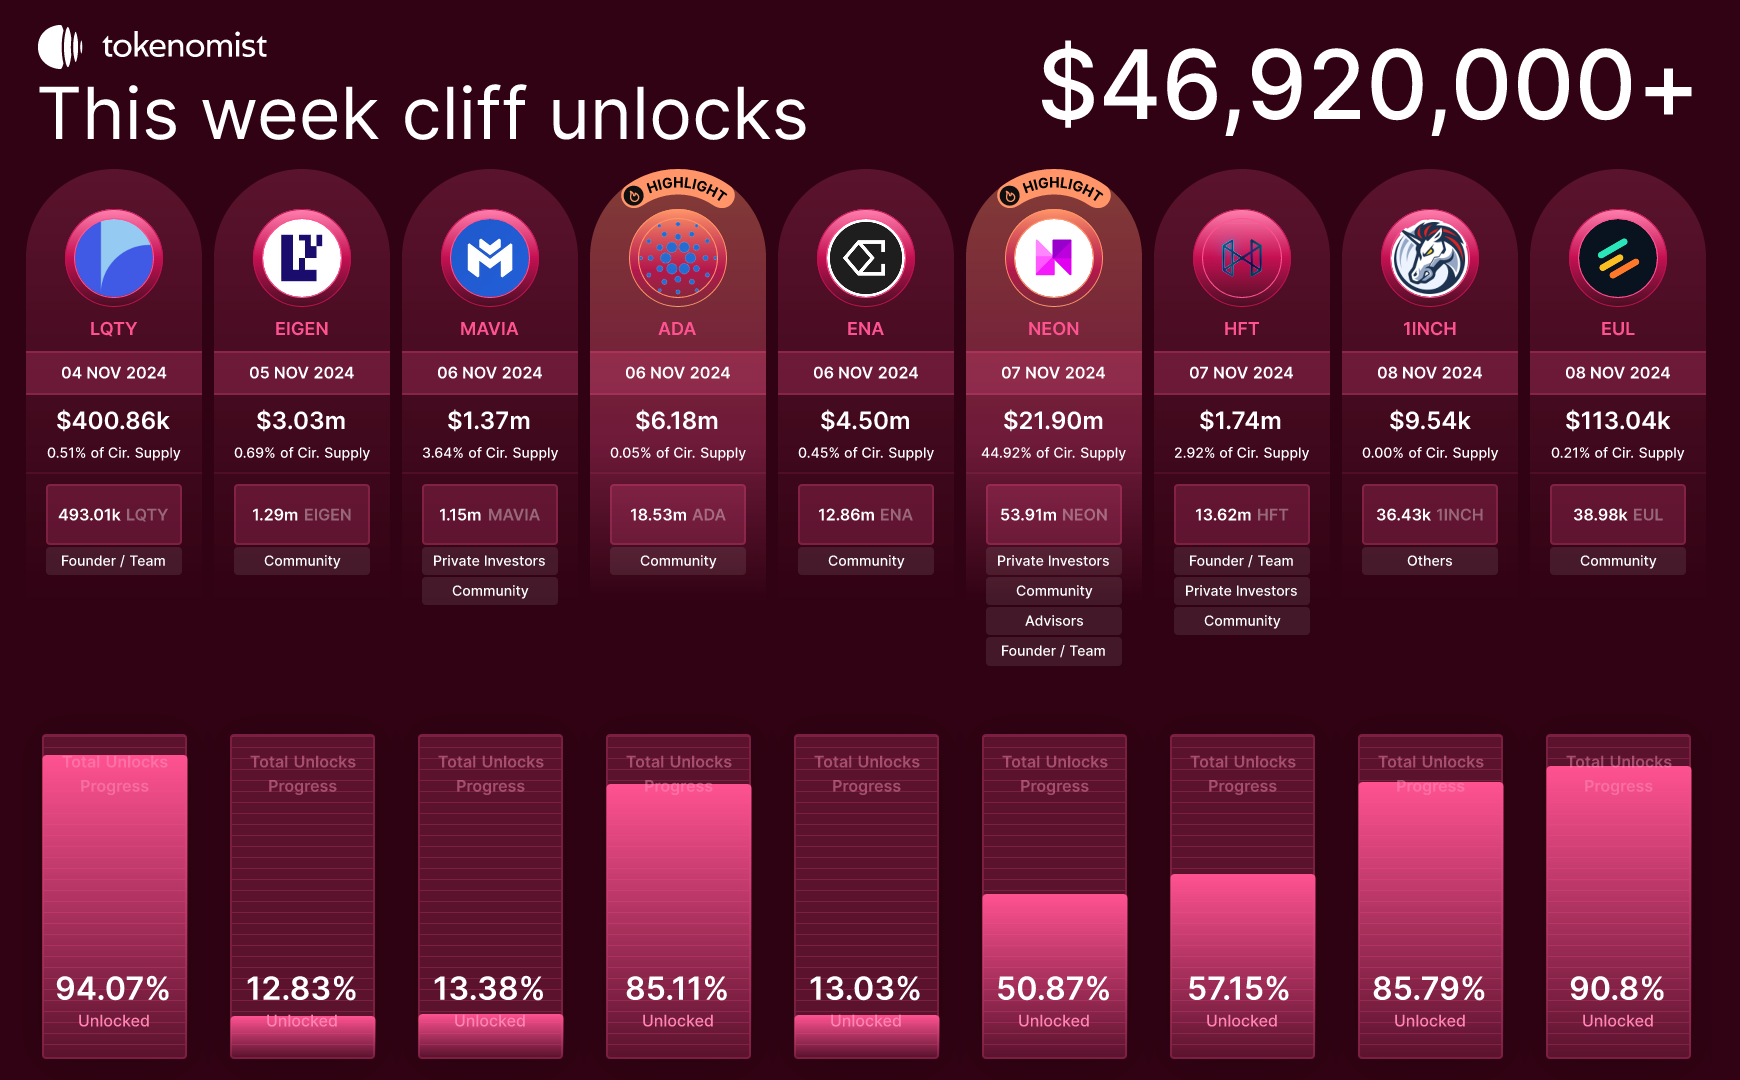
Weekly Cliff Unlocks | Tokenomist
Cardano will add 18 million ADA tokens worth $6 million into circulation, which will be distributed to community members. ADA has seen the most gains in the past 24 hours, with a 14% rise as of the time of writing. This pushed its weekly gains over 20% ahead of next week's supply injection.
Additionally, EIGEN, ENA, HFT and MAVIA will witness unlocks worth $3 million, $4 million, $1.7 million and $1.3 million, respectively. These tokens are currently witnessing declines at the time of writing.
Sector-wise, DeFi will see the highest supply hike amid its extended gains in the past week. According to Crypto Koryo data, the DeFi sector outperformed other sectors following the US presidential election. Potential regulatory clarity from the upcoming Donald Trump administration suggests that the sector may see increased positive sentiment in the coming weeks.
Recommended Articles


