

Ethereum lays out 2024 report after accusations of lack of transparency in treasury management
- The Ethereum Foundation released on Friday a report about its funding and spending activity following accusations of lack of transparency.
- The Ethereum Foundation's treasury stood at $970 million as of October 31, while its ecosystem got $497 million in funding for initiatives in 2022 and 2023.
- Ethereum Foundation introduced a conflict of interest policy in which they declare their members' investments.
The Ethereum Foundation (EF) released its 2024 annual report on Friday, aiming to address accusations of lack of transparency. The report, disclosed by Executive Director Aya Miyaguchi, delves into the foundation’s policies, key areas of operation and a detailed breakdown of its $970 million treasury reserves.
The report follows heightened scrutiny over a 35,000 ETH ($94 million) transaction from the foundation’s treasury to the cryptocurrency exchange Kraken on August 9. The on-chain detection raised concerns about the foundation’s financial transparency. In response, Miyaguchi said that the transaction was part of EF’s “treasury management”, clarifying that such movements do not always imply the immediate sale of the cryptocurrency.
This is part of our treasury management activities. EF has a budget of ~$100m per year, which is largely made up of grants and salaries, and some of the recipients are only able to accept in fiat. This year, there was a long period of time when we were advised not to do any…
— Aya Miyaguchi (ayamiya.eth) (@AyaMiyagotchi) August 24, 2024
Miyaguchi also explained that EF is unable to disclose specific transaction plans due to regulatory issues but emphasized that any future sales would be carefully planned and calculated.
1/ Introducing the Ethereum Foundation Report, 2024 Edition. Learn more about EF, our recent work, Ethereum’s ecosystem of funders, new organizations and policies. The full report is here: https://t.co/koL7Et0n6B pic.twitter.com/uhbzsngaWD
— Aya Miyaguchi (ayamiya.eth) (@AyaMiyagotchi) November 8, 2024
The report shows that the Ethereum Foundation holds 81.3% of its $970.2 million in treasury reserves in cryptocurrency assets, with 99.45% of those crypto assets in Ether (ETH).
Ethereum Foundation leads with $240.3 million in direct funding support
The annual report revealed that all organizations involved in the Ethereum project spent $497 million on project funding, with $240.3 million, or 48.3%, provided by the Ethereum Foundation.
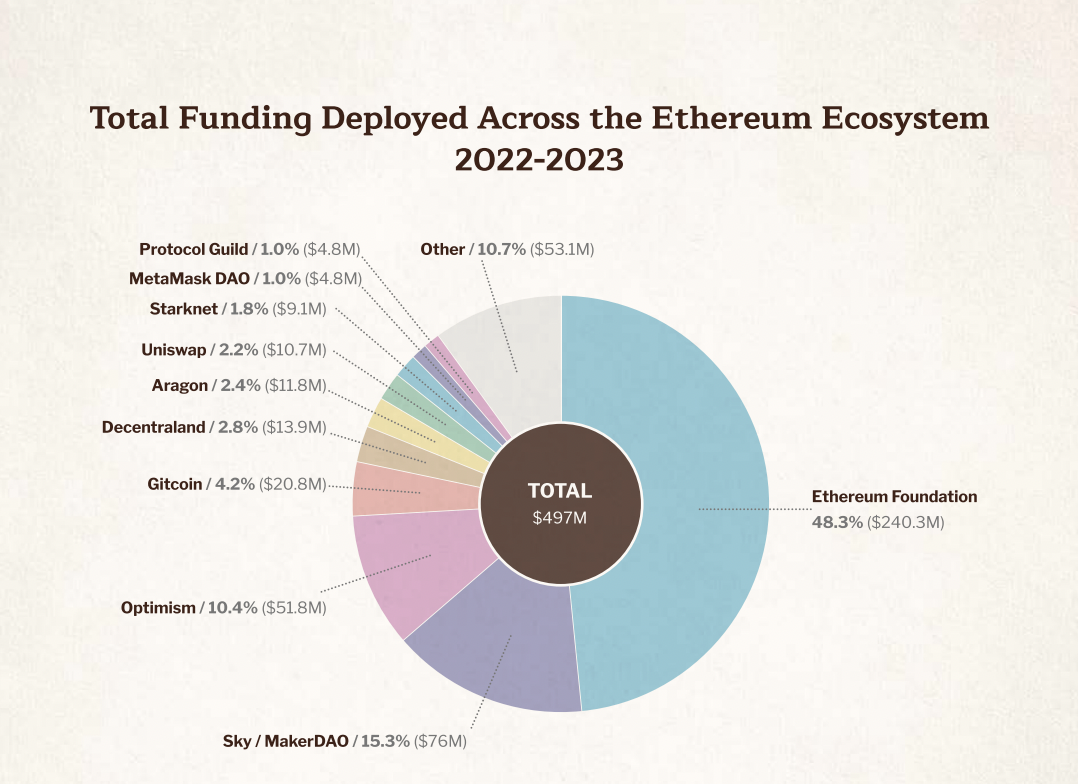
Source: Ethereum Foundation
The rest was raised by other actors like MakerDAO (currently trading under Sky), Optimism, Gitcoin, Decentraland, Aragon, Uniswap, Starknet, MetaMask DAO, and Protocol Guilds, highlighting strong inter-organizational cooperation within the Ethereum ecosystem.
Apart from such investments at the project level, more than $22 billion in treasury reserves are held by various foundations, organizations, and DAOs, including Optimism, Uniswap, Mantle, Arbitrum, Gnosis and Ethereum Name Service. The Ethereum Foundation itself retains $970 million in treasury funds.
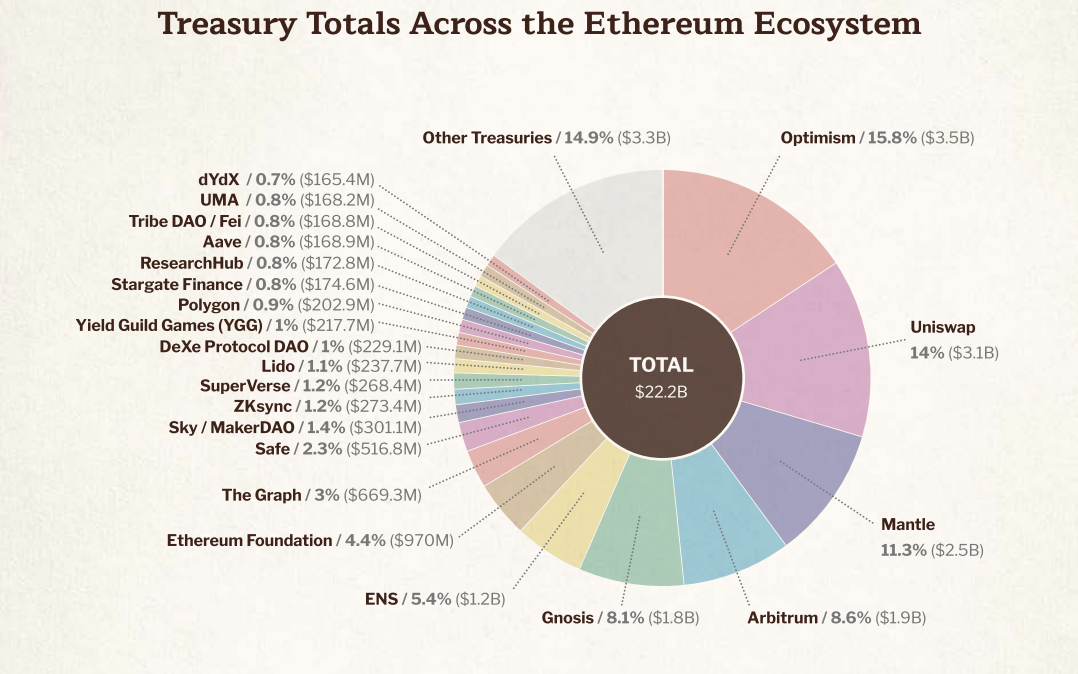
Source: Ethereum Foundation
The report also explained that treasury assets include both liquid and vested assets, although most treasuries mainly consist of projects’ native tokens. In its latest annual report, the Ethereum Foundation announced it will require members to disclose any 'conflicts of interest' for investments exceeding $500,000, except Ether holdings.
The mandate aims to prevent conflicts of interest by ensuring that individuals with substantial exposure to a particular asset are excluded from processes where decisions about such an asset would be made.
Recommended Articles


