


Solana Price Forecast: Investors stake $1.3B SOL amid November winning streak
Meta: Solana Price Forecast: $1.3B staking deposits could spark $210 rally
Solana price breached the $195 level on November 7, extending its weekly time frame gains to 25%, as on-chain data trends suggest key SOL stakeholders are holding out for more gains ahead
Solana price breaches $190, first time in 220 days
Buoyed by Donald Trump's victory at the polls, the global crypto market entered its third consecutive day on an uptrend on November 7, 2024. Amid the ongoing rally, Solana emerged one of the biggest gainers on Thursday, as demand for native memecoins further propelled market demand for SOL.
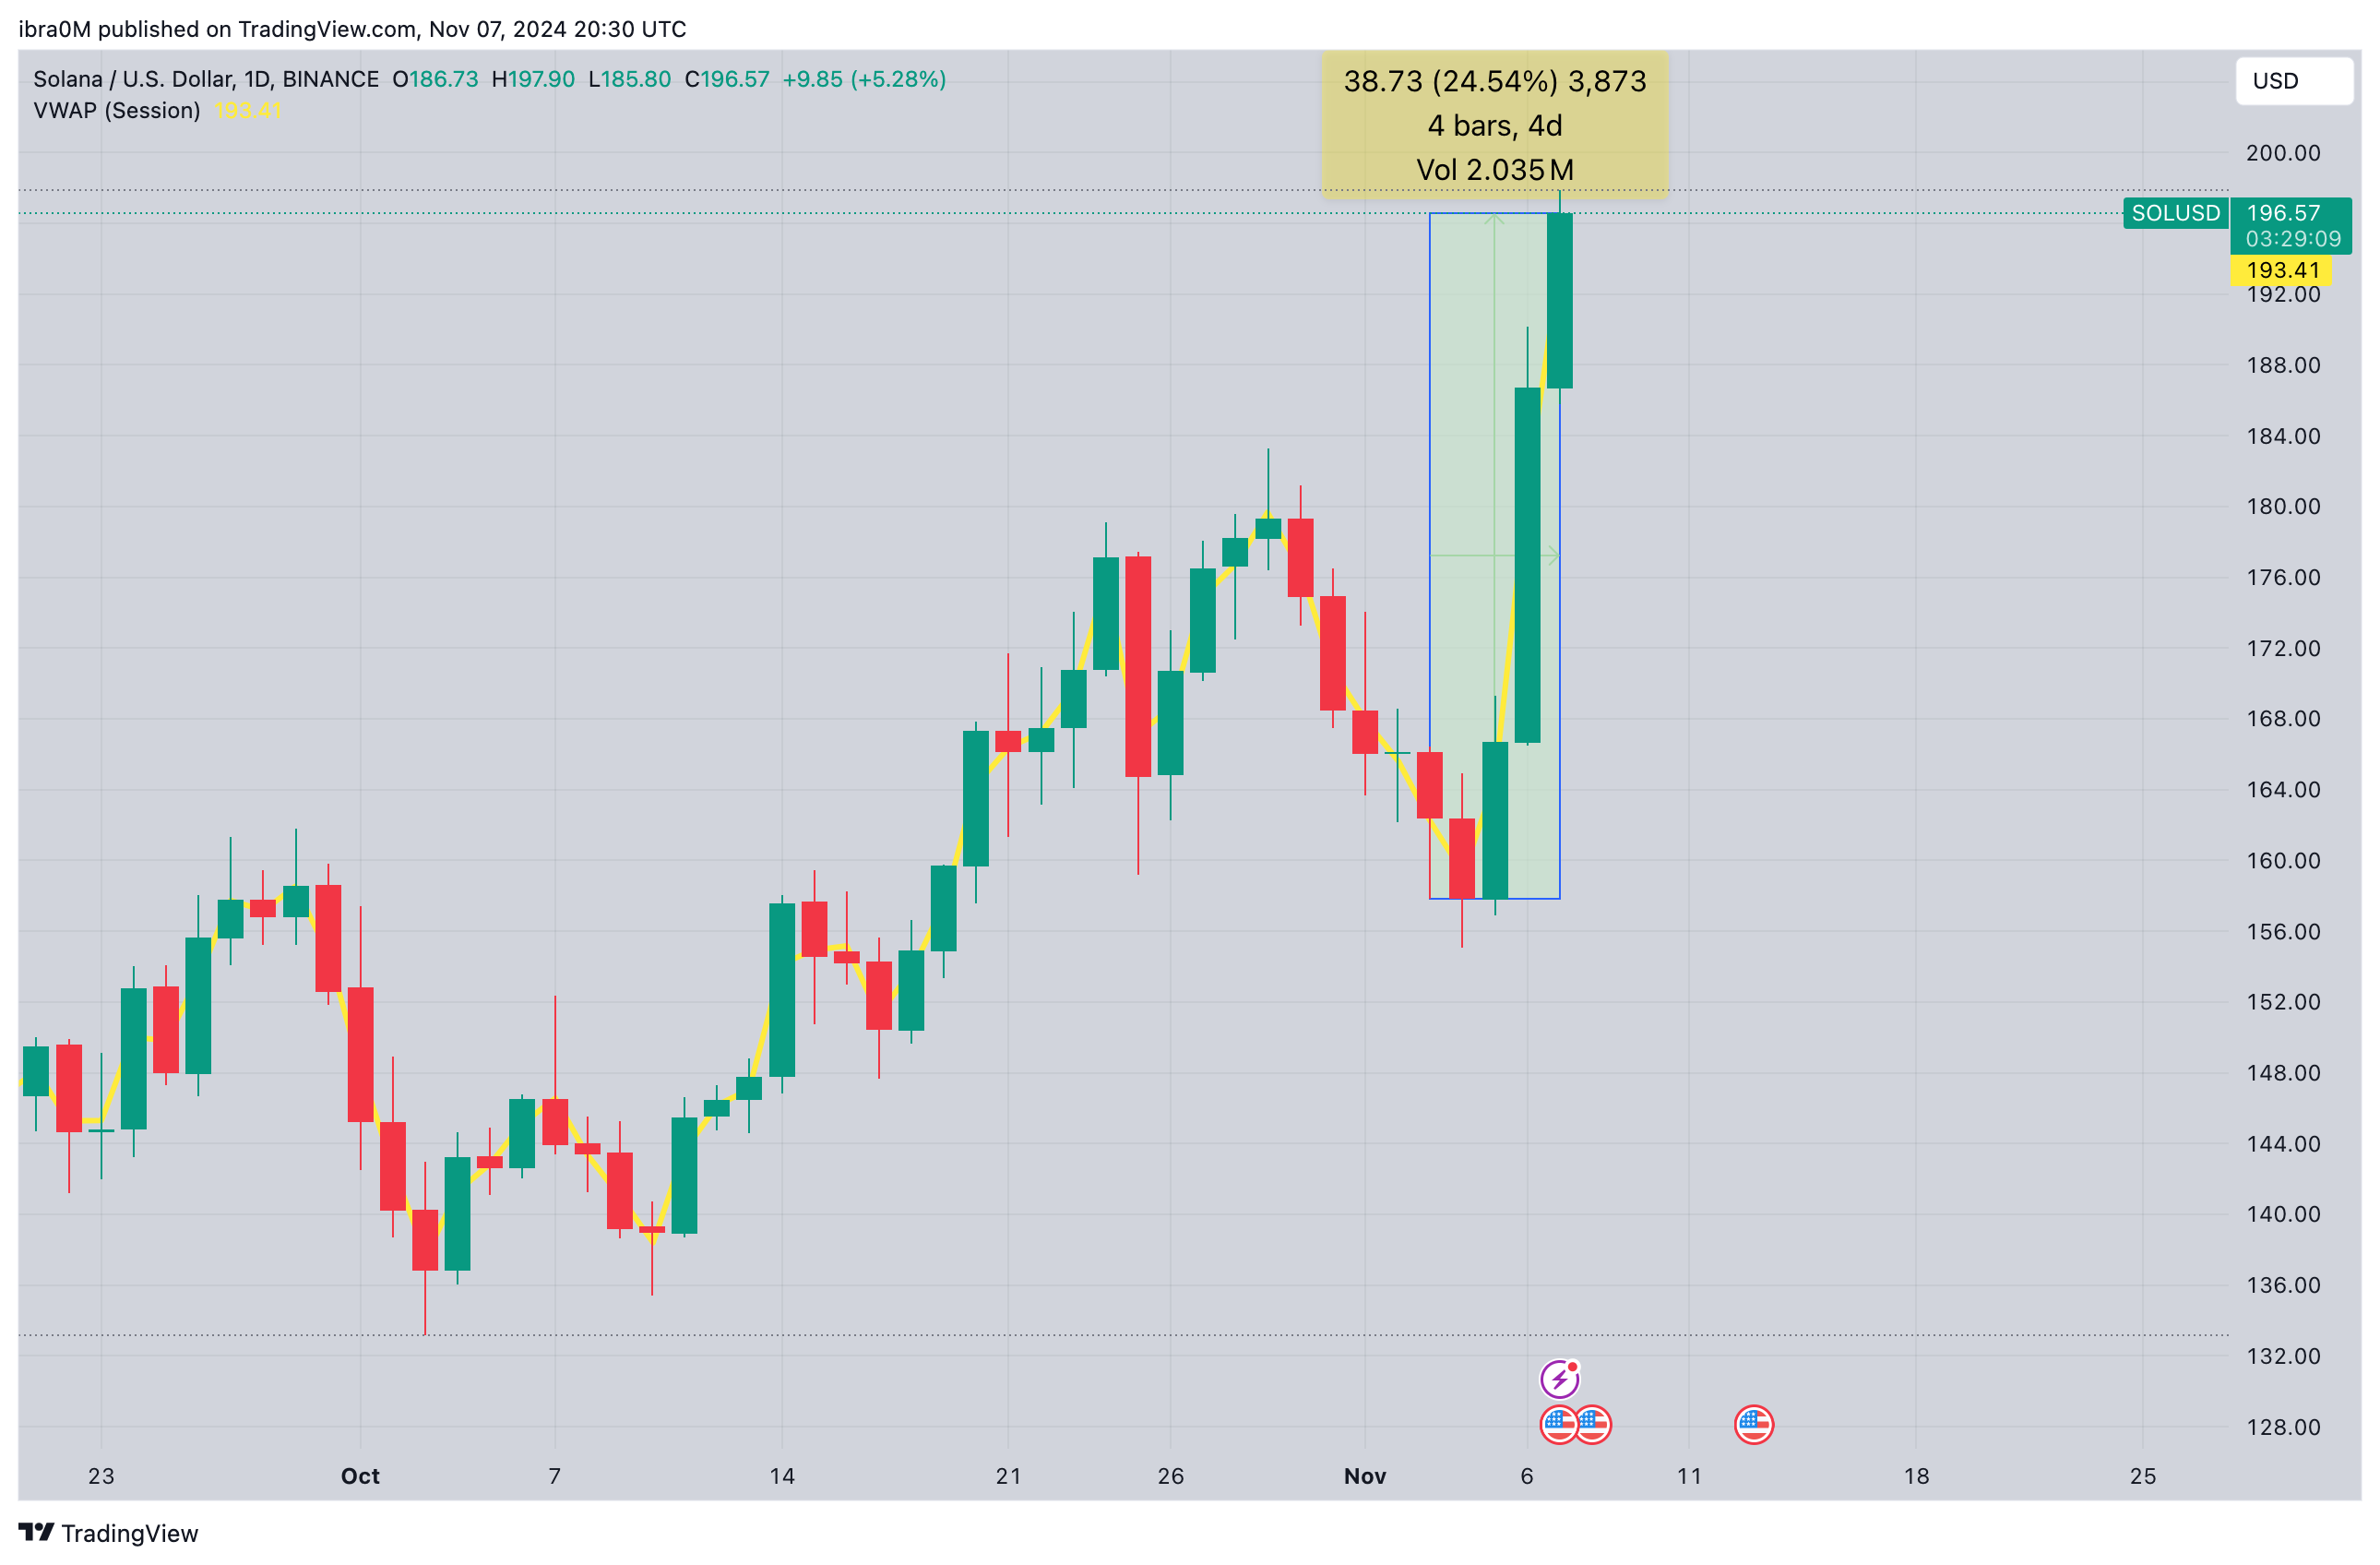
Solana Price Analysis | SOLUSD | November, 7 2024
Solana is trading above $196 on Binance at the time of writing on November 7. Zooming out, the chart also above shows that SOL’s weekly time frame gains have now exceeded 25%, as prices moved from $157 on November 3 to reach the $196 level at the time of publication.
Investors have staked another $1.3B SOL in November
While Solana’s traders are holding onto double-digit unrealized profits, on-chain data trends suggest that the majority of key stakeholders are not looking to cash out early.
In affirmation of this narrative, Solana investors have been spotted staking an unusually high amount of SOL coins since the start of November.
The chart below, culled from StakingRewards.com, tracks the total value of SOL staked, in real-time, across all yield bearing smart-contracts.
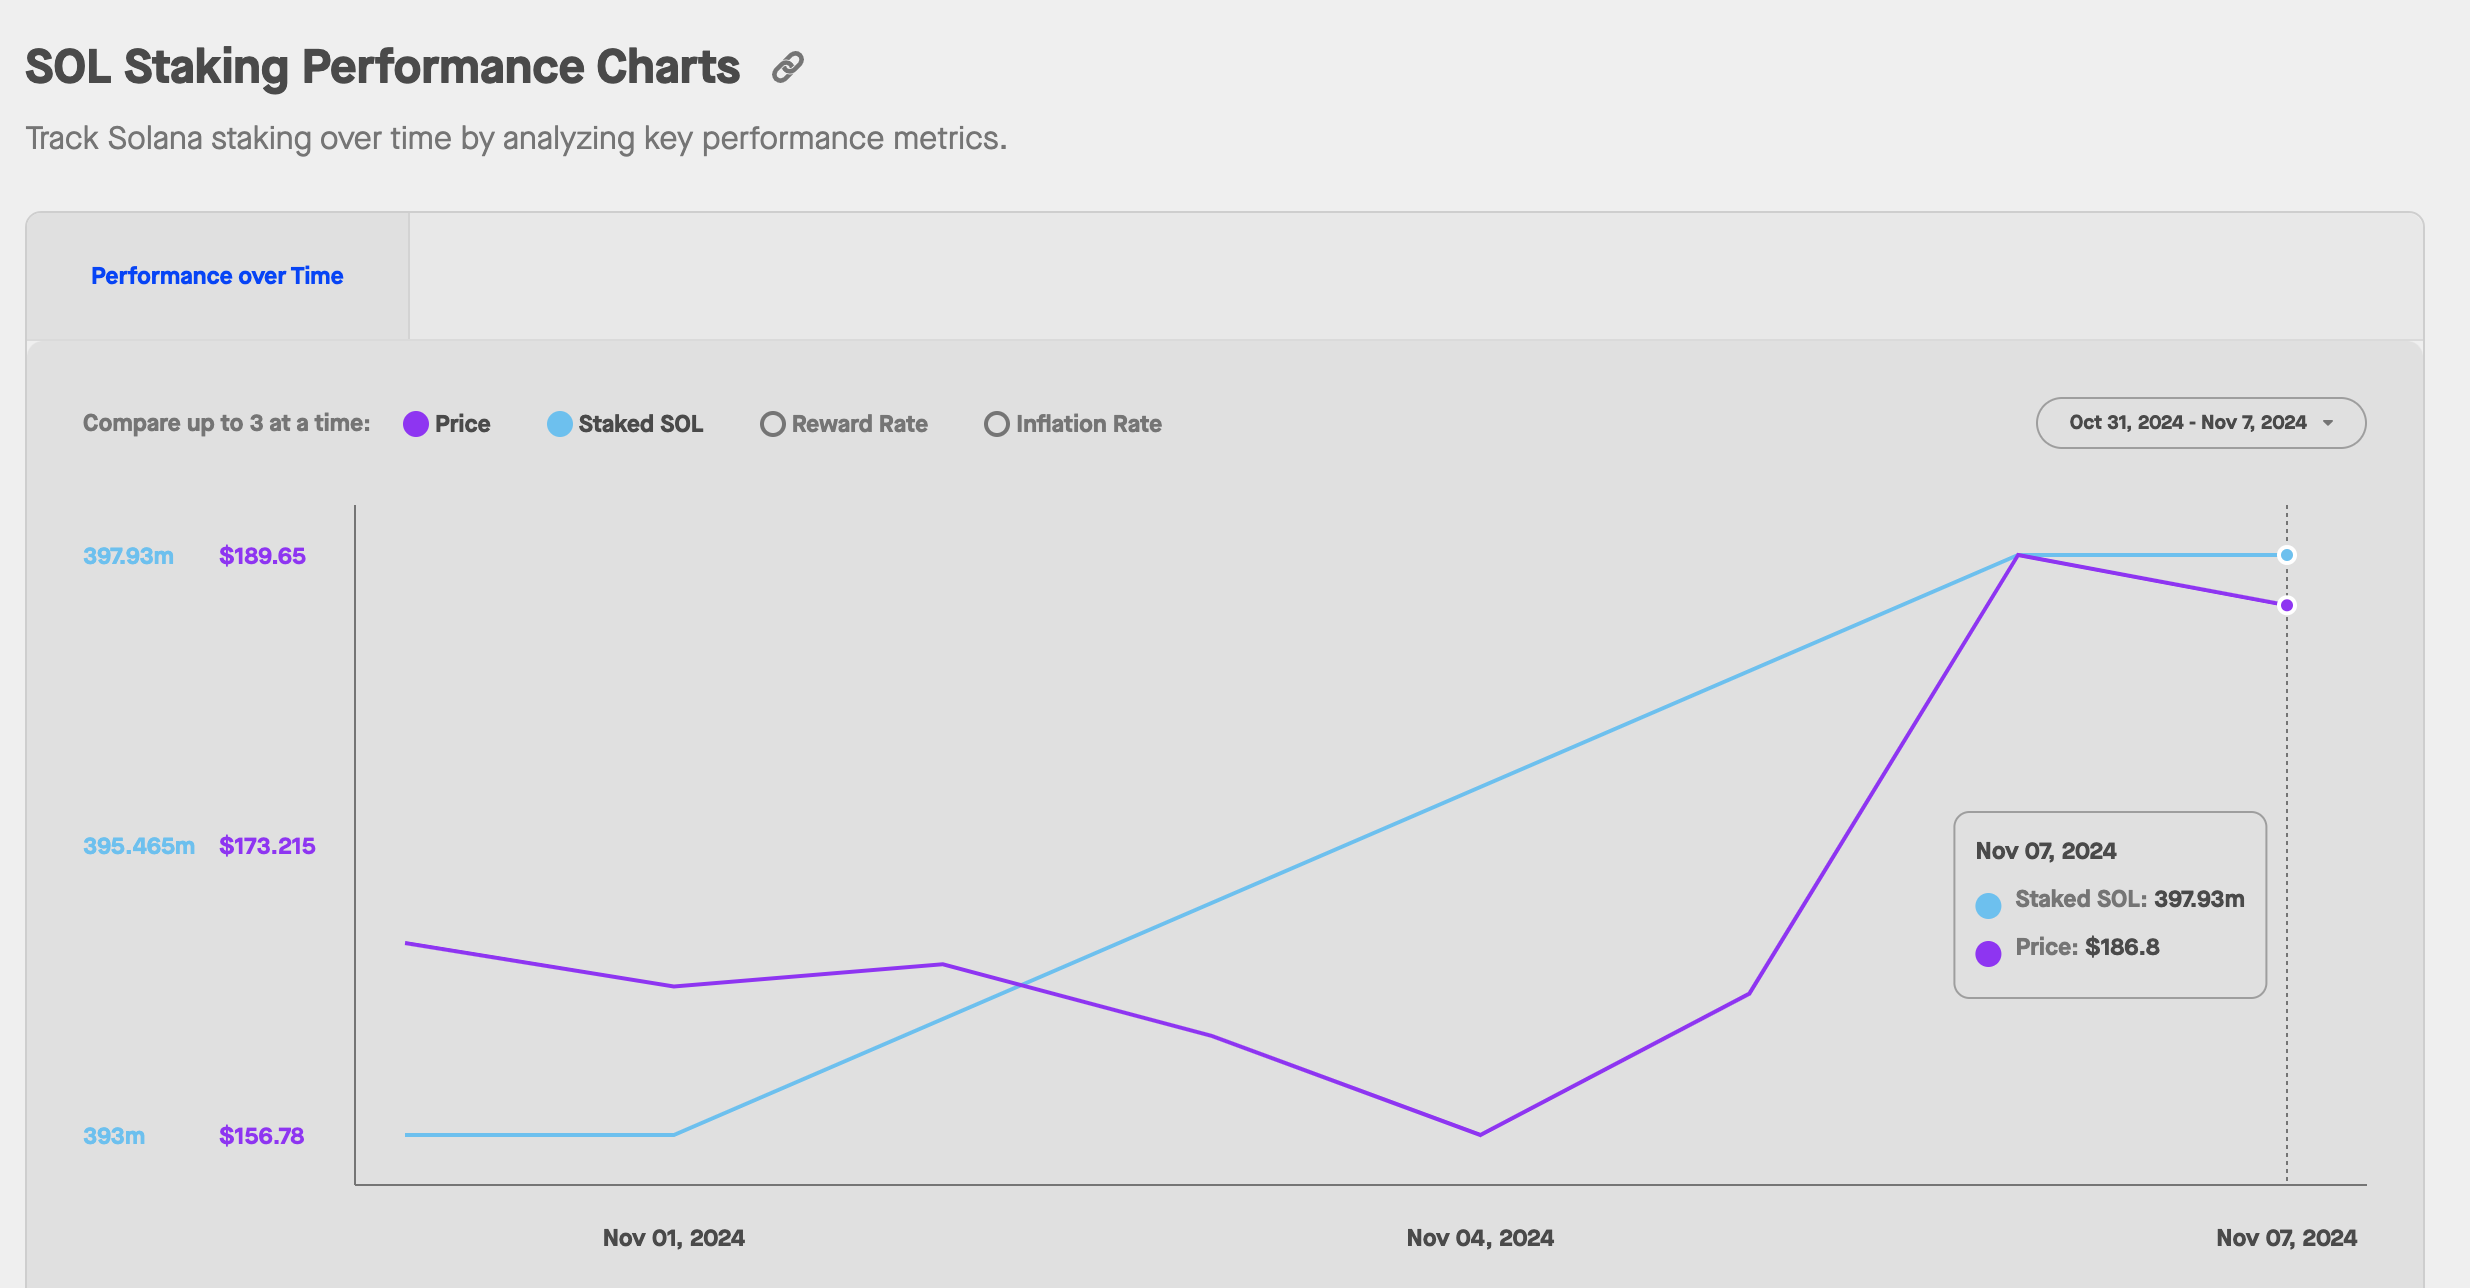 Solana Total Staked Value | November 1 to November 7, 2024 | Sources: SimplyStaking.com
As seen above, Solana total staked value stood at 393 million SOL as of November 1. That figure has now ballooned to 397.93 million at the time of publication on November 7.
This reflects that Solana investors deposited 4 .93 million SOL, valued at $1.3 billion, into smart contracts within the last seven days.
Increased staking during a market-wide rally is often considered a bullish momentum signal for two major reasons. First, by locking over $1.3 billion worth of SOL in smart contracts, it temporarily reduces the supply available to be traded on exchanges.
More importantly, for any Proof-of-Stake network, increased staking deposits enhances the security architecture of the blockchain.
Notably, Solana has a well-documented history of outages during peak market activity. Hence, the additional 4 .93 million SOL staked in the last seven days provides firepower to shore-up network stability.
Lastly, it also signals that Solana’s key stakeholders and node validators are looking to hold out for future gains, rather than cash out at the current price levels.
Solana Price Forecast: $200 breakout in focus
Solana (SOL) is trading near $196 with 5.45% daily time frame gains. Having broken above its Bollinger Band midline, Solana is now trading above its Volume Weighted Average Price (VWAP) on Binance, signaling that buyers are willing to pay higher prices.
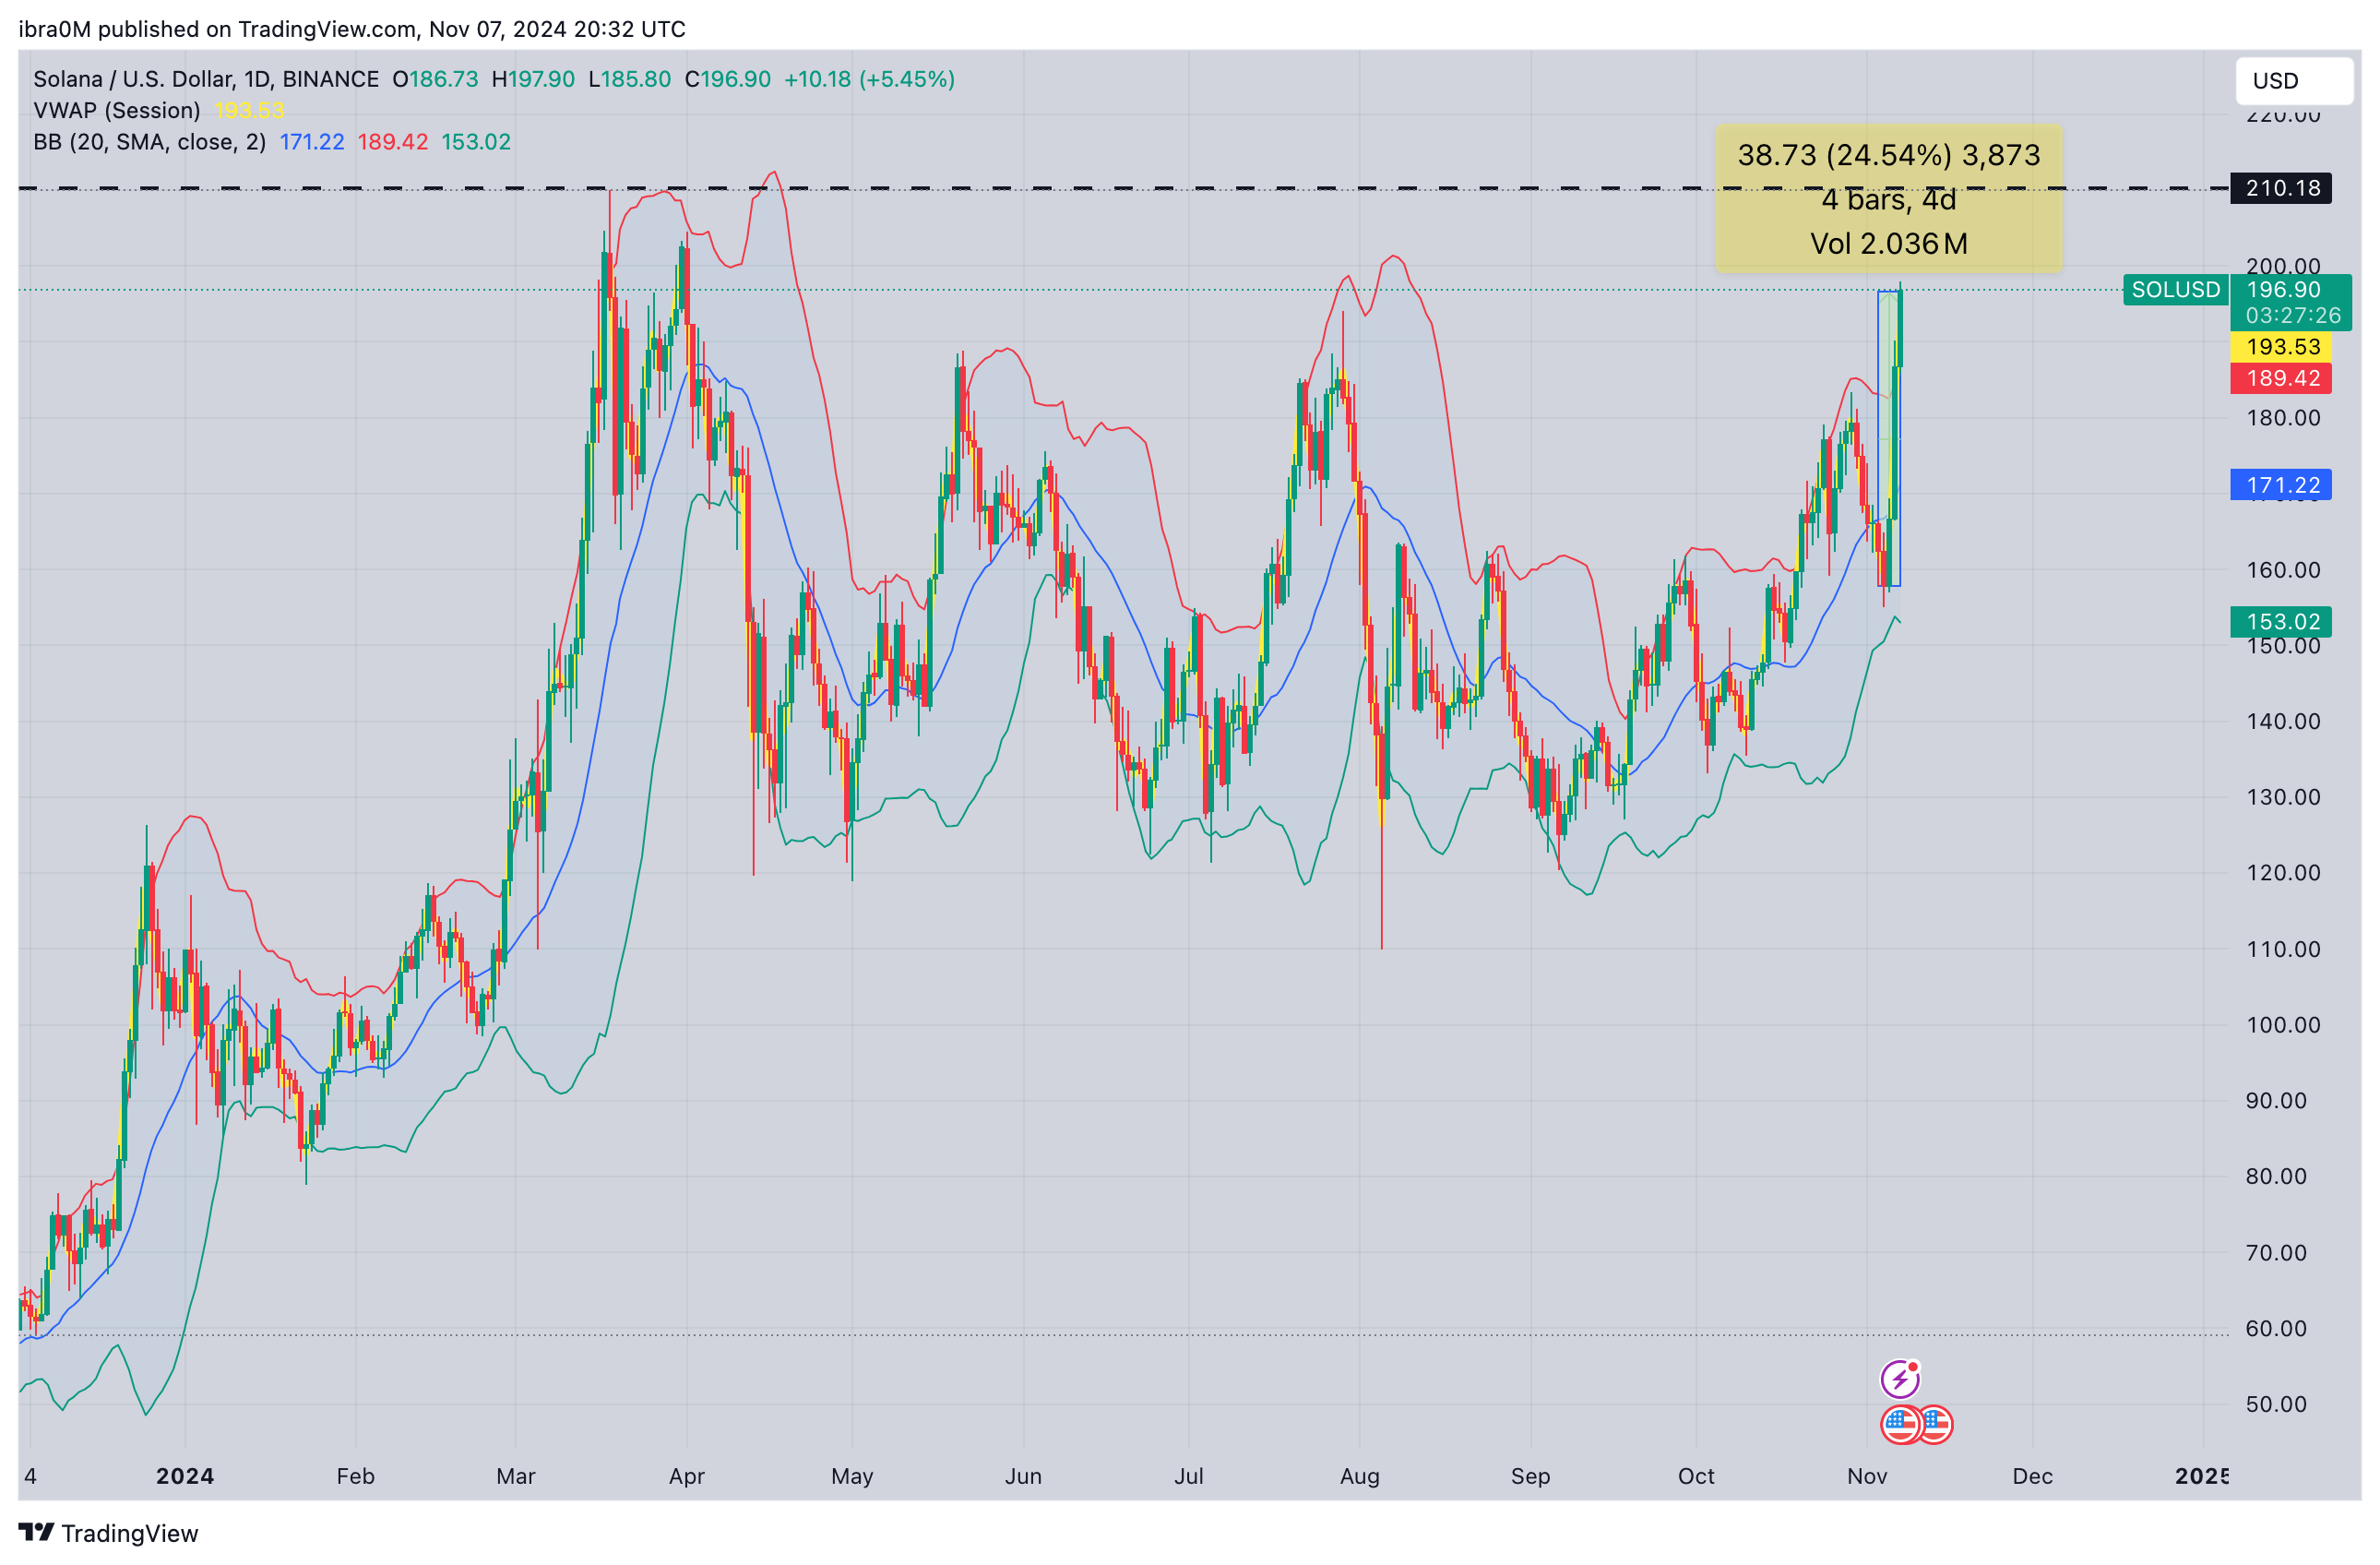 Solana Price Forecast | SOLUSD
In the near term, the $210 zone could pose a major psychological barrier for Solana traders given that previous rallies encountered intense selling pressure around that price level. A successful break above $210 would likely set up SOL for a higher leg up, possibly targeting the $225 range.
Conversely, if SOL faces resistance and reverses, support lies at current VWAP at $189. If that supports the cave, Solana price could find additional cushioning around the $171 area, reinforced by the Bollinger Band’s central moving average.
SOL’s price trajectory is currently bullish with eyes on the $210 breakout. The increasing staked value coupled with a bullish technical setup aligns Solana’s price outlook for potential higher gains if market momentum persists without network outages.
This temporary decline in short-term supply has been pivotal to Solana's rapid 25% rally, amid the global market demand surge that ensued in the aftermath of Trump’s win at the polls.
On-chain staking trends show that Solana investors have deposited another $500 million worth of SOL coins since the start of November.
With Solana price trend above its Volume Weighted Average Price (VWAP) at $188, buyers remain in control. A close above that level could trigger a rapid breakout towards the $200 level.
Recommended Articles


