

XRP aims to tackle key trendline resistance as investors step up buying pressure
- XRP exchange reserves in Binance and Upbit have declined by nearly $13 million.
- In the past three days, investors opened over $123 million worth of XRP positions.
- XRP needs to overcome key descending trendline resistance to stage a rally to $0.6640.
Ripple's XRP is up nearly 3% on Thursday as investors increased their buying pressure in spot and futures exchanges.
XRP buyers could help boost bullish momentum
XRP exchange reserves across the Binance and Upbit crypto exchanges have begun trending downward after rising by nearly 62 million XRP between November 3 and 5. In the past 24 hours, nearly 24 million XRP tokens worth $12.9 million have flowed out of both exchanges. A decrease in an asset's exchange reserve indicates rising buying pressure.
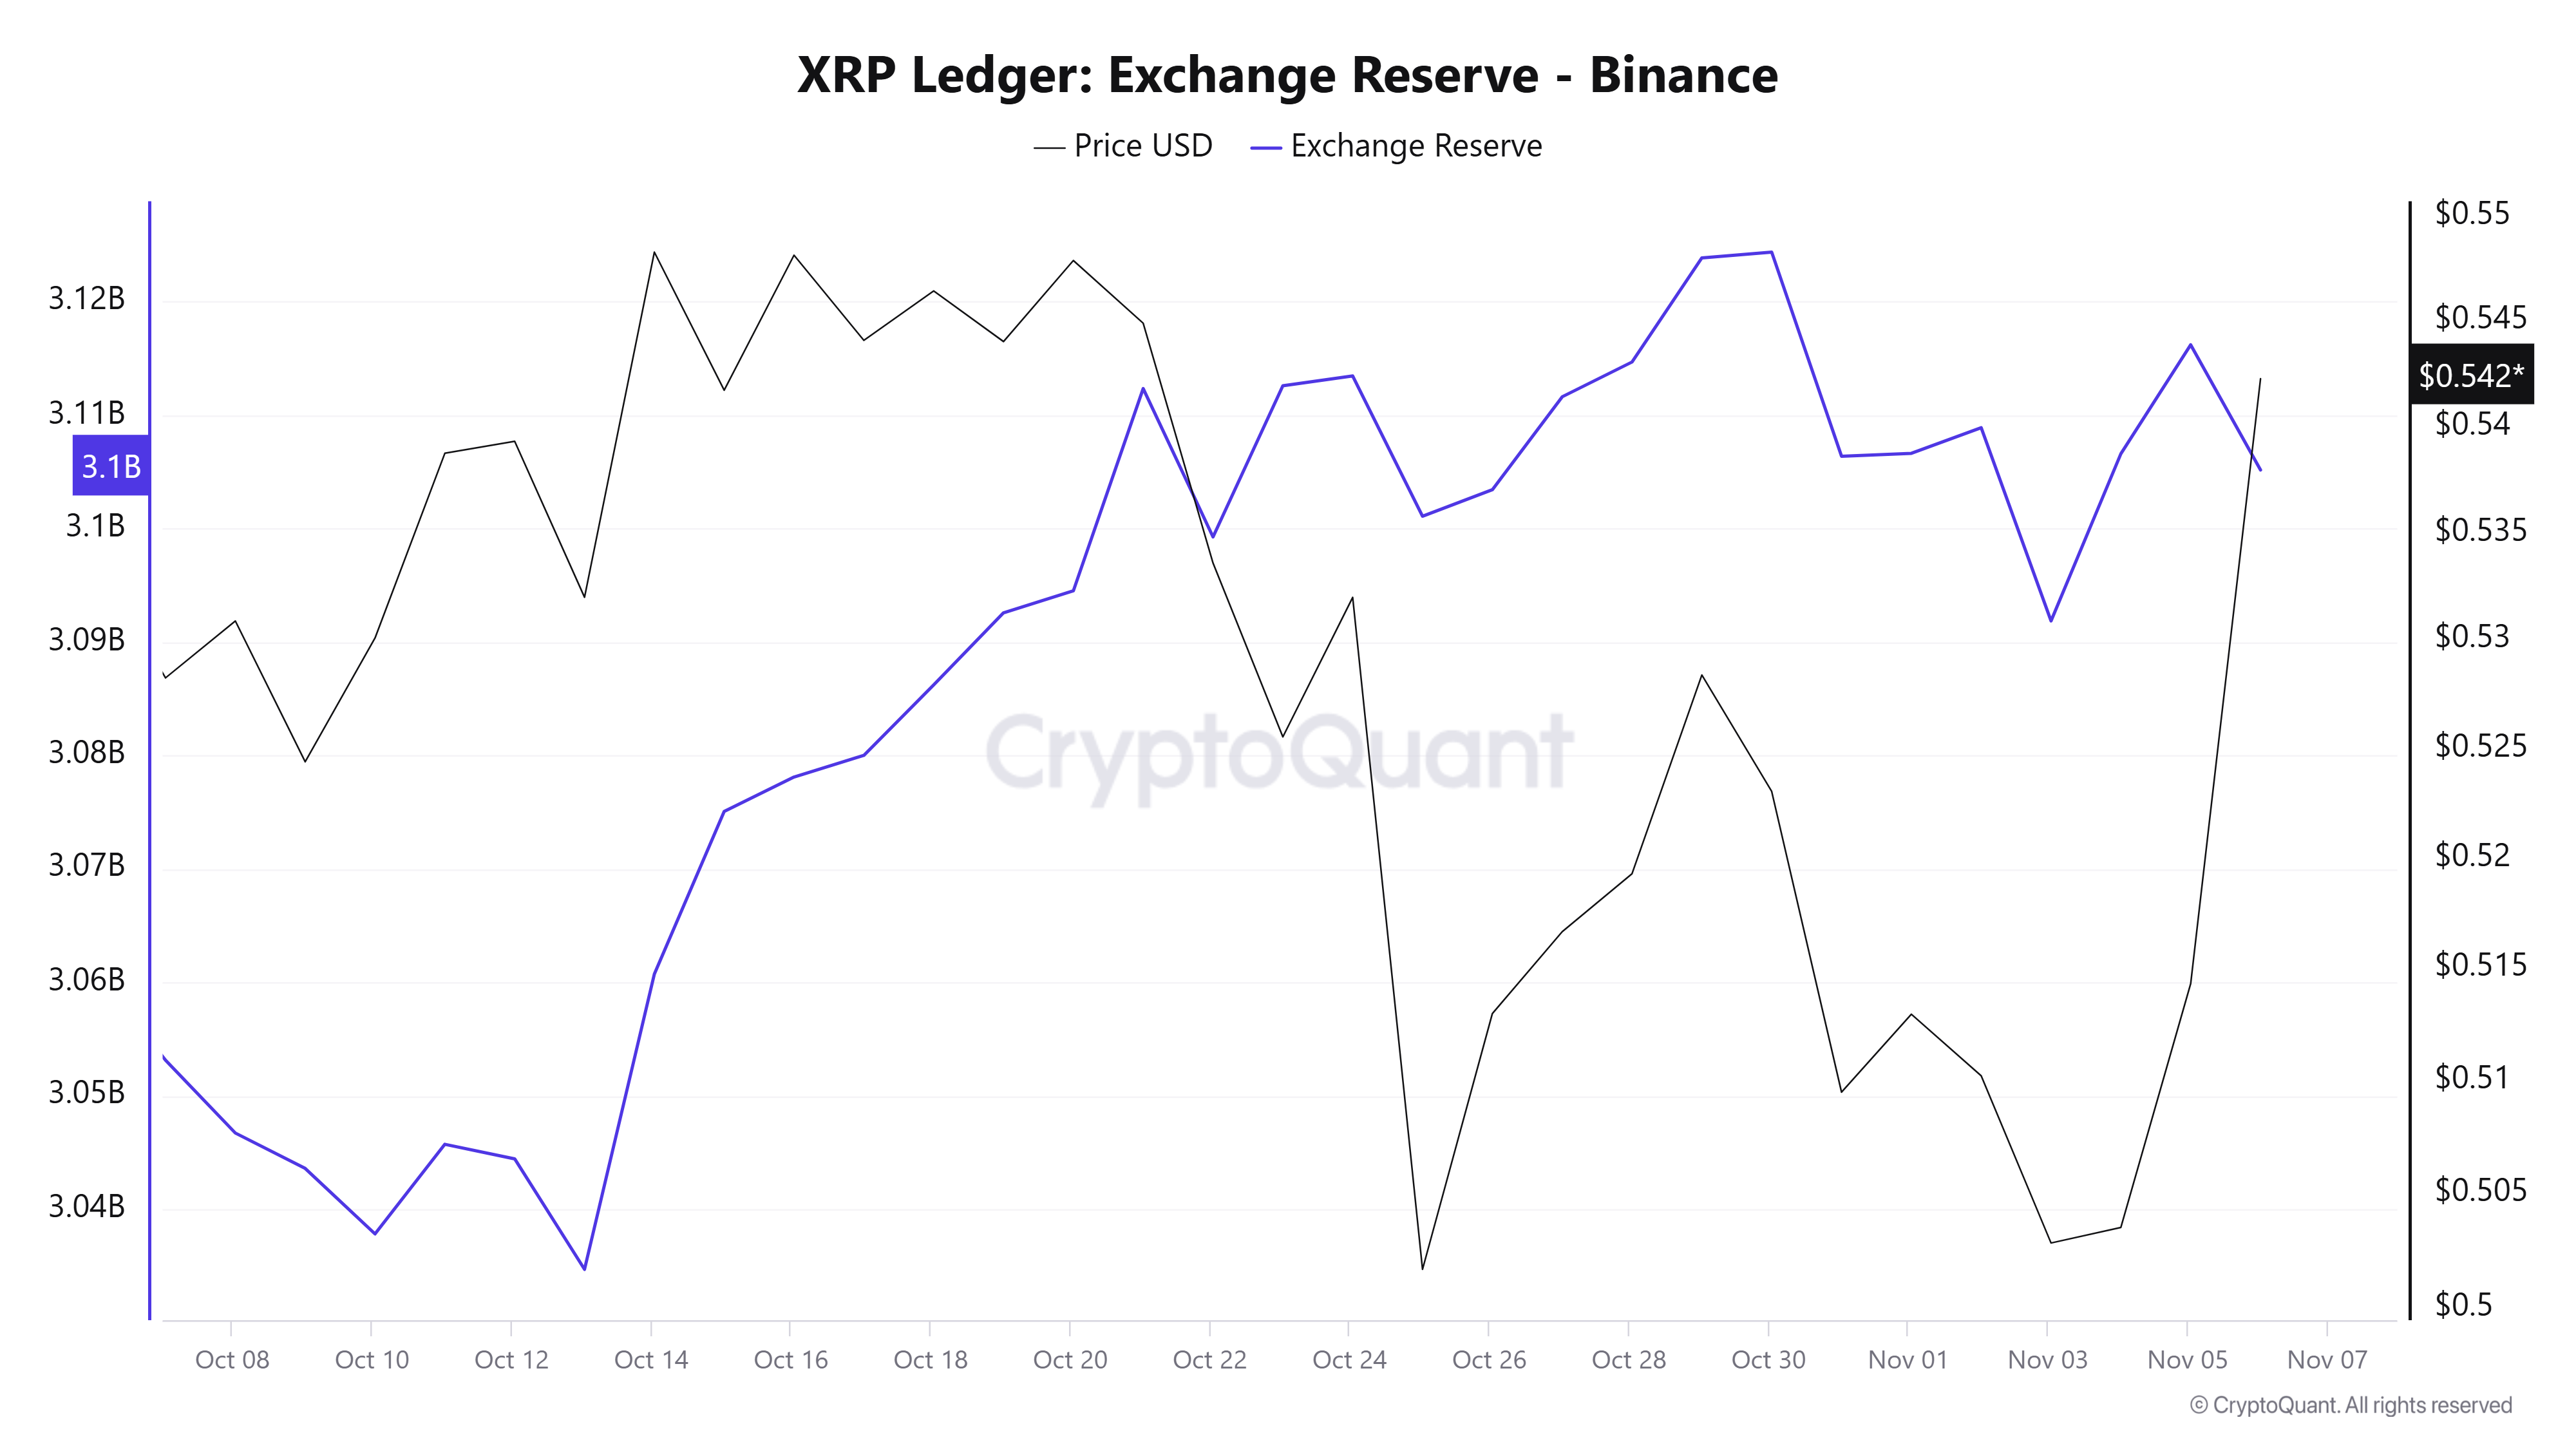
XRP Exchange Reserve - Binance | CryptoQuant
A similar bullish sentiment is visible in XRP's futures open interest, which has increased by $123 million in the past three days. Open interest is the total number of unsettled contracts in a derivatives market. The rising OI shows investors are expecting the XRP uptrend to continue.
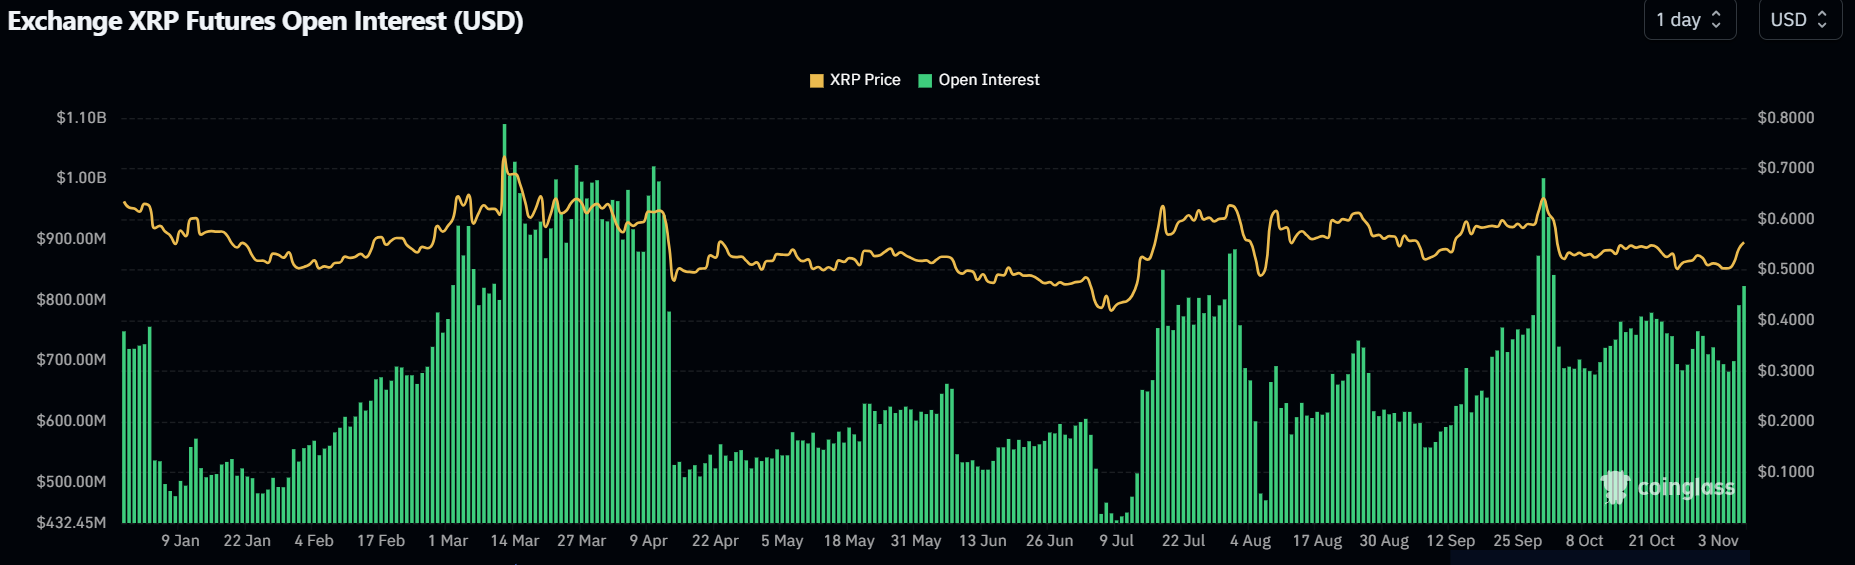
XRP Exchange Open Interest | Coinglass
However, XRP's weighted sentiment has plunged below its neutral level, indicating the cryptocurrency is either seeing negative or low social media sentiment among investors.
 [21.02.54, 07 Nov, 2024]-638666107791732358.png)
XRP Weighted Sentiment | Santiment
Meanwhile, Ripple's CEO Brad Garlinghouse stated in an X post on Thursday that he hopes Democrats hold Securities & Exchange Commission (SEC) Chair Gary Gensler accountable for "ignoring the law."
Ripple technical analysis: XRP could rally to $0.6640 if it overcomes descending trendline resistance
XRP is trading near $0.5560, up over 3%, following $3.18 million in futures liquidations in the past 24 hours. Long and short liquidations accounted for $1.24 million and $1.95 million, respectively.
The remittance token is back below the $0.5608 resistance after seeing a rejection near a descending trendline resistance that extended from March 11.
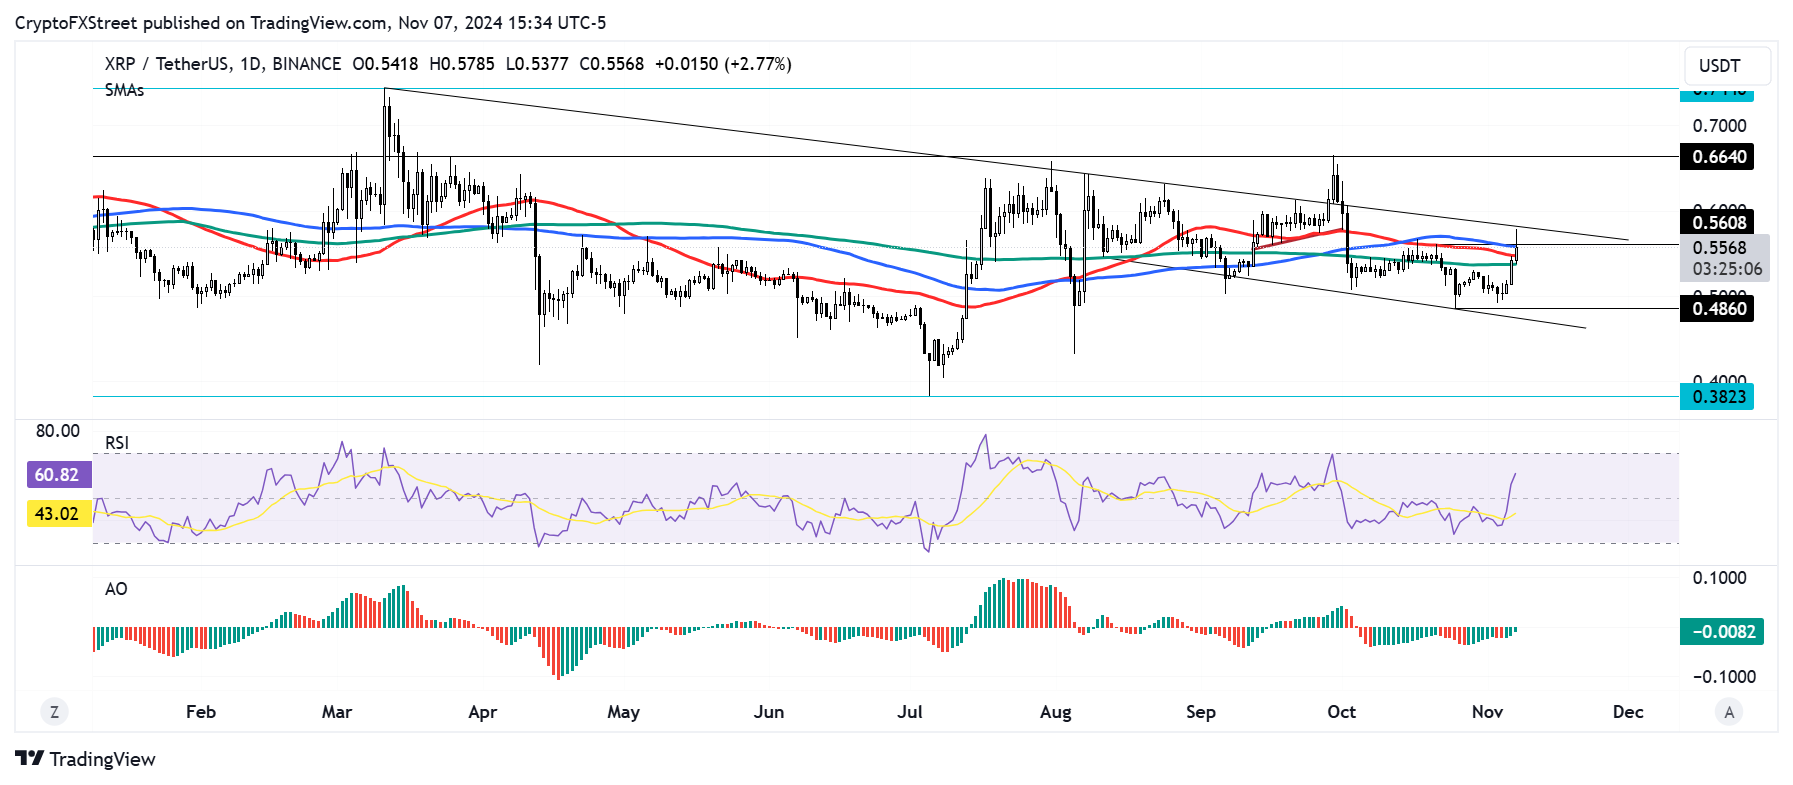
XRP/USDT daily chart
If XRP bounces off the 50-day, 100-day and 200-day Simple Moving Averages (SMAs) convergence, it could rise above $0.5608 and retest the descending trendline resistance near $0.5780. A successful move above this trendline resistance will see XRP rise to tackle the $0.6640 level.
On the other hand, the 50-day, 100-day and 200-day SMA convergence could also serve as resistance and potentially push XRP downward to $0.4860.
The Relative Strength Index (RSI) is above the neutral level after crossing above its moving average yellow line, indicating increased bullish momentum. The bullish momentum will be strengthened if the Awesome Oscillator (AO) crosses above the neutral level.
A daily candlestick close below $0.4860 will invalidate the thesis and cause XRP to decline to $0.4190.
Ripple FAQs
Ripple is a payments company that specializes in cross-border remittance. The company does this by leveraging blockchain technology. RippleNet is a network used for payments transfer created by Ripple Labs Inc. and is open to financial institutions worldwide. The company also leverages the XRP token.
XRP is the native token of the decentralized blockchain XRPLedger. The token is used by Ripple Labs to facilitate transactions on the XRPLedger, helping financial institutions transfer value in a borderless manner. XRP therefore facilitates trustless and instant payments on the XRPLedger chain, helping financial firms save on the cost of transacting worldwide.
XRPLedger is based on a distributed ledger technology and the blockchain using XRP to power transactions. The ledger is different from other blockchains as it has a built-in inflammatory protocol that helps fight spam and distributed denial-of-service (DDOS) attacks. The XRPL is maintained by a peer-to-peer network known as the global XRP Ledger community.
XRP uses the interledger standard. This is a blockchain protocol that aids payments across different networks. For instance, XRP’s blockchain can connect the ledgers of two or more banks. This effectively removes intermediaries and the need for centralization in the system. XRP acts as the native token of the XRPLedger blockchain engineered by Jed McCaleb, Arthur Britto and David Schwartz.
Recommended Articles


