SUI Breaks $2 Barrier, Sets Sights on a New Record

Source Beincrypto

SUI, the native token of the Layer-1 Move-programmed blockchain, has surged over the past 24 hours. Currently trading at $2.20, the token has jumped 18% during this period and is approaching its all-time high of $2.36, last reached on October 12.

BeInCrypto’s readings from the token’s technical setup suggest it appears positioned to extend these double-digit gains further. Here is how. 

SUI Is Everyone’s Favorite

A corresponding spike in trading volume has accompanied SUI’s double-digit price hike. Totaling $2 billion at press time, the token’s trading volume has skyrocketed by 184% over the past 24 hours. 

When a surge in trading volume backs a price rally, it signifies strong market participation and investor confidence. It indicates that a few huge trades do not drive upward price movement but widespread market demand. In such cases, the buying pressure is stronger, and the price movement is less likely to be a temporary fluctuation.

Read More: A Guide to the 10 Best Sui (SUI) Wallets in 2024

SUI Price/Trading Volume
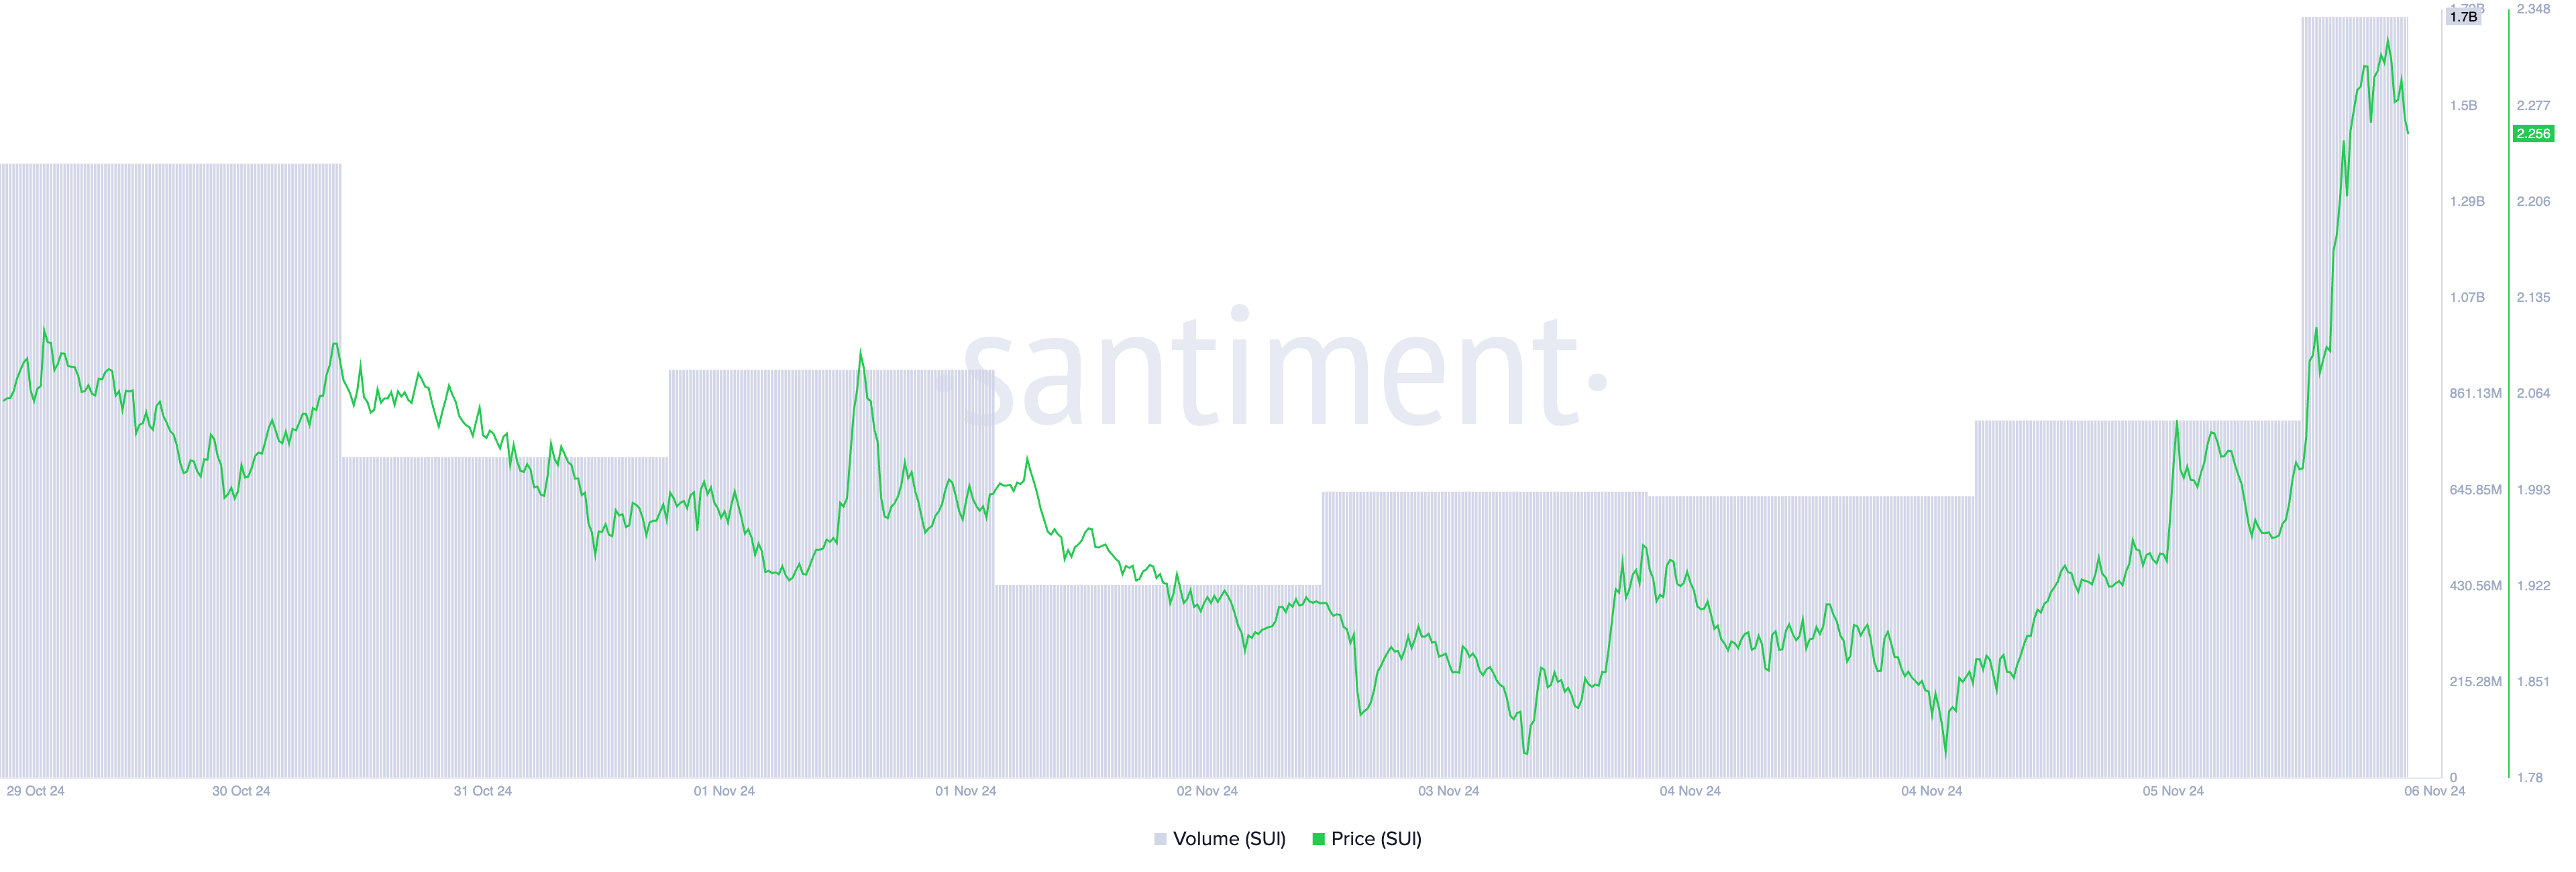
SUI Price/Trading Volume. Source: Santiment

Moreover, the SUI token’s rising open interest confirms the uptick in market activity over the past 24 hours. According to Coinglass’ data, SUI’s open interest has increased by 27% during that period and currently stands at $556 million. 

Open interest refers to the total number of outstanding contracts — such as futures or options — that have not been settled or closed. A rise in open interest suggests that traders are adding to their positions.

When combined with a rising price, it indicates that the market is not simply driven by a few large traders but by increasing participation from buyers and sellers. This scenario suggests that the SUI price rally has solid backing, which further strengthens the bullish sentiment and can lead to a continuation of the trend.

SUI Open Interest.
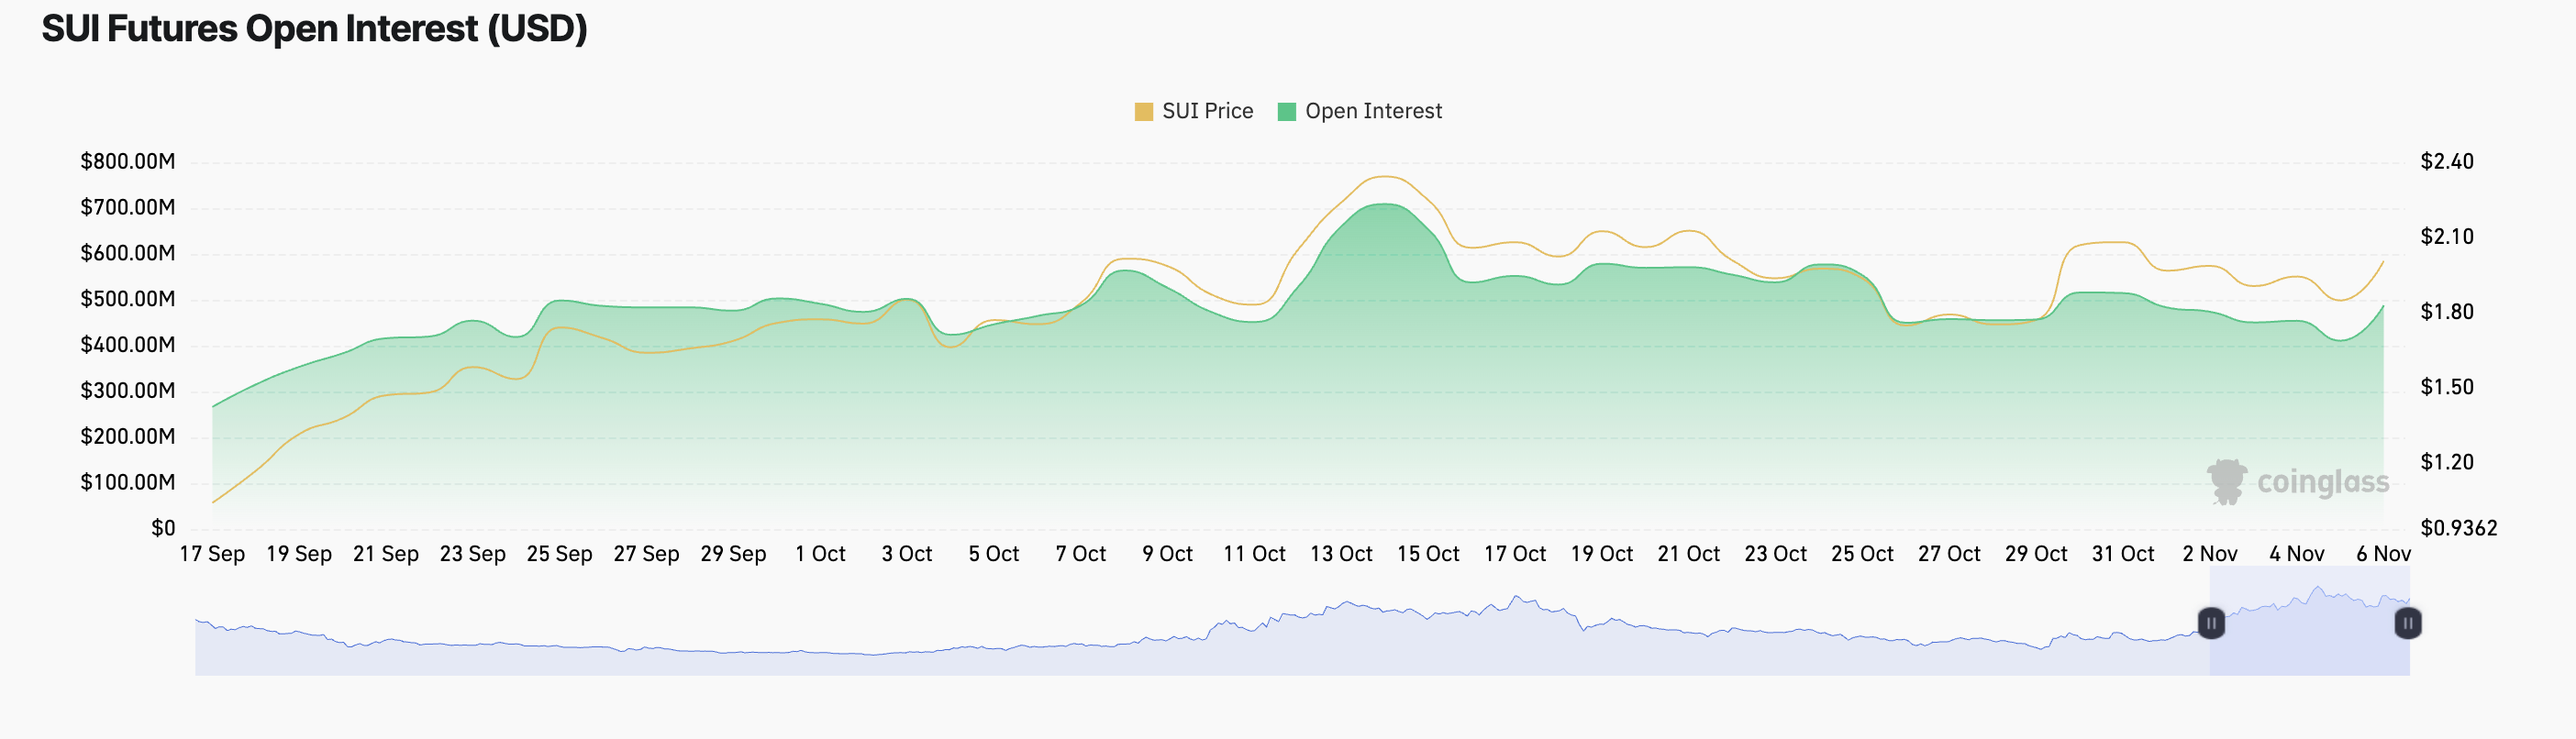
SUI Open Interest. Source: Coinglass

SUI Price Prediction: Will Coin Surpass Resistance?

SUI’s Relative Strength Index (RSI) on the SUI/USD one-day chart supports a continued bullish outlook. Currently, the RSI sits at 60.77, signaling increased buying pressure over selling, as the metric reflects an asset’s overbought or oversold status.

At press time, SUI trades at $2.20, just 7% below its all-time high of $2.36. If current momentum holds, SUI’s rally may push it to surpass this peak. 

Read More: Everything You Need to Know About the Sui Blockchain

SUI Price Analysis.
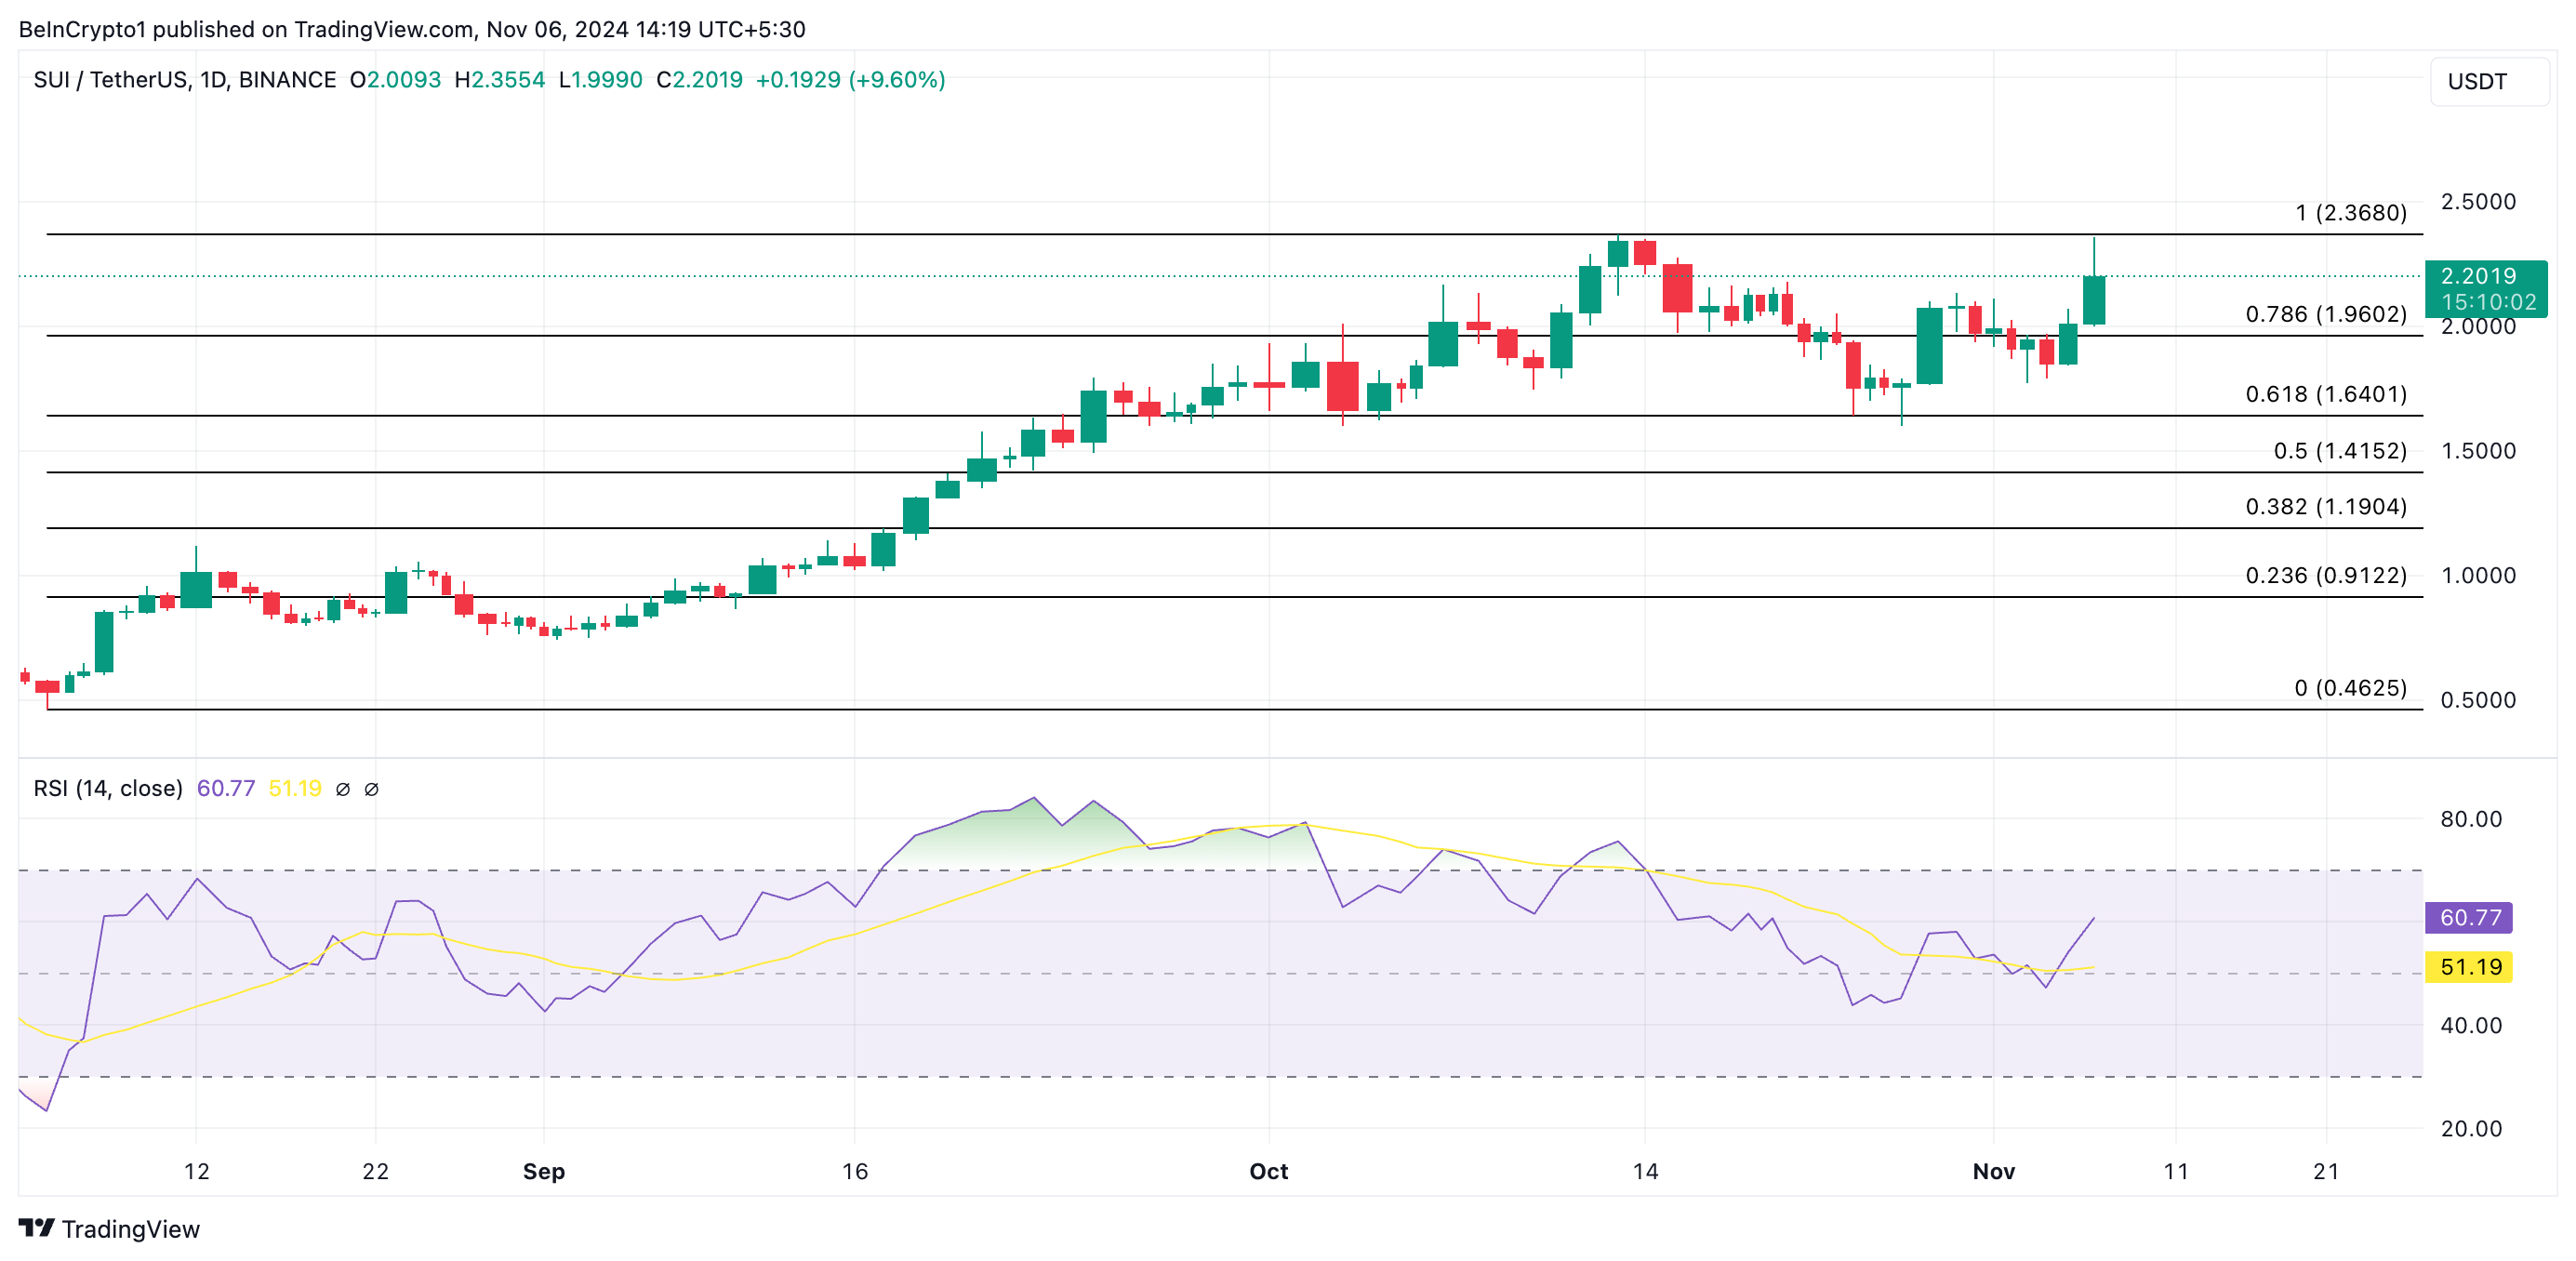
SUI Price Analysis. Source: TradingView

However, if traders begin selling to lock in gains, the upward trend may stall, potentially leading to a downtrend. In such a scenario, SUI could decline toward the $1.64 markZ

Disclaimer: For information purposes only. Past performance is not indicative of future results.
placeholder
Fed Chair Candidate: What Would a Hassett Nomination Mean for U.S. Stocks?1. IntroductionOver the past month, investors' expectations for a Federal Reserve interest rate cut in December first cooled and then reignited. These fluctuating expectations have directly triggered
Author  TradingKey
12 hours ago
1. IntroductionOver the past month, investors' expectations for a Federal Reserve interest rate cut in December first cooled and then reignited. These fluctuating expectations have directly triggered
placeholder
Avalanche Coils for a Big Move as Wolfe Wave Pattern TightensAvalanche (AVAX) is trading near $13.06 as a Wolfe Wave pattern and key weekly trendline converge, with BeLaunch eyeing a $11–$8 accumulation zone and drawing parallels to the September 2023 setup — a combination that suggests a major breakout could be approaching once the current coil finally snaps.
Author  Mitrade
16 hours ago
Avalanche (AVAX) is trading near $13.06 as a Wolfe Wave pattern and key weekly trendline converge, with BeLaunch eyeing a $11–$8 accumulation zone and drawing parallels to the September 2023 setup — a combination that suggests a major breakout could be approaching once the current coil finally snaps.
placeholder
AUD/USD holds steady below 0.6550 as traders await Australian GDP releaseThe AUD/USD pair trades on a flat note near 0.6540 during the early Asian trading hours on Tuesday. Weaker-than-expected US economic data and rising US interest rate cut expectations in December drag the US Dollar (USD) lower against the Australian Dollar (AUD).
Author  FXStreet
21 hours ago
The AUD/USD pair trades on a flat note near 0.6540 during the early Asian trading hours on Tuesday. Weaker-than-expected US economic data and rising US interest rate cut expectations in December drag the US Dollar (USD) lower against the Australian Dollar (AUD).
placeholder
U.S. PCE and 'Mini Jobs' Data in Focus as Salesforce (CRM) and Snowflake (SNOW) Report Earnings 【The week ahead】 TradingKey - US stocks rebounded last week, ending a three-week slide, on rising expectations for a Federal Reserve rate cut in December. The market is now poised for further gains. This week, the Fe
Author  TradingKey
Yesterday 10: 12
 TradingKey - US stocks rebounded last week, ending a three-week slide, on rising expectations for a Federal Reserve rate cut in December. The market is now poised for further gains. This week, the Fe
placeholder
Crypto Market Outlook: Bitcoin, Ethereum, and XRP Tumble as BoJ Hawkishness Sparks Risk-Off RoutBitcoin slides below $87,000, Ethereum leans on $2,800 support and XRP hovers around $2.00 as December opens with a risk-off tone, leaving BTC eyeing $80,600–$74,508, ETH exposed to $2,111 and XRP to $1.90 unless buyers can turn key levels into a base for a rebound.
Author  Mitrade
Yesterday 06: 52
Bitcoin slides below $87,000, Ethereum leans on $2,800 support and XRP hovers around $2.00 as December opens with a risk-off tone, leaving BTC eyeing $80,600–$74,508, ETH exposed to $2,111 and XRP to $1.90 unless buyers can turn key levels into a base for a rebound.
goTop
quote