

PONKE’s 32% Crash in 24 Hours—Why It’s Not a Bearish Sign
PONKE’s price recently experienced significant fluctuations, marked by a 32% drop from its recent high. This decline, fueled by profit-taking sentiment among investors, has halted PONKE’s attempt to establish a new all-time high (ATH).
Despite this setback, the altcoin is showing signs of resilience and may still have the potential for a strong rebound.
PONKE Has Potential
The Ichimoku Cloud, a technical indicator that helps predict future price movements and identify trends, is signaling a bullish outcome for PONKE. This cloud, when positioned below the candlesticks, suggests that the asset is experiencing upward pressure, which could lead to further gains. The Ichimoku Cloud consists of several components that generate support and resistance levels, measure momentum, and provide a forecast for possible trend reversals.
For PONKE, the cloud is currently situated below the price candles, indicating underlying support. This setup has historically signaled macro-level growth for assets, regardless of short-term price dips.
Read More: How to Buy Solana Meme Coins: A Step-By-Step Guide
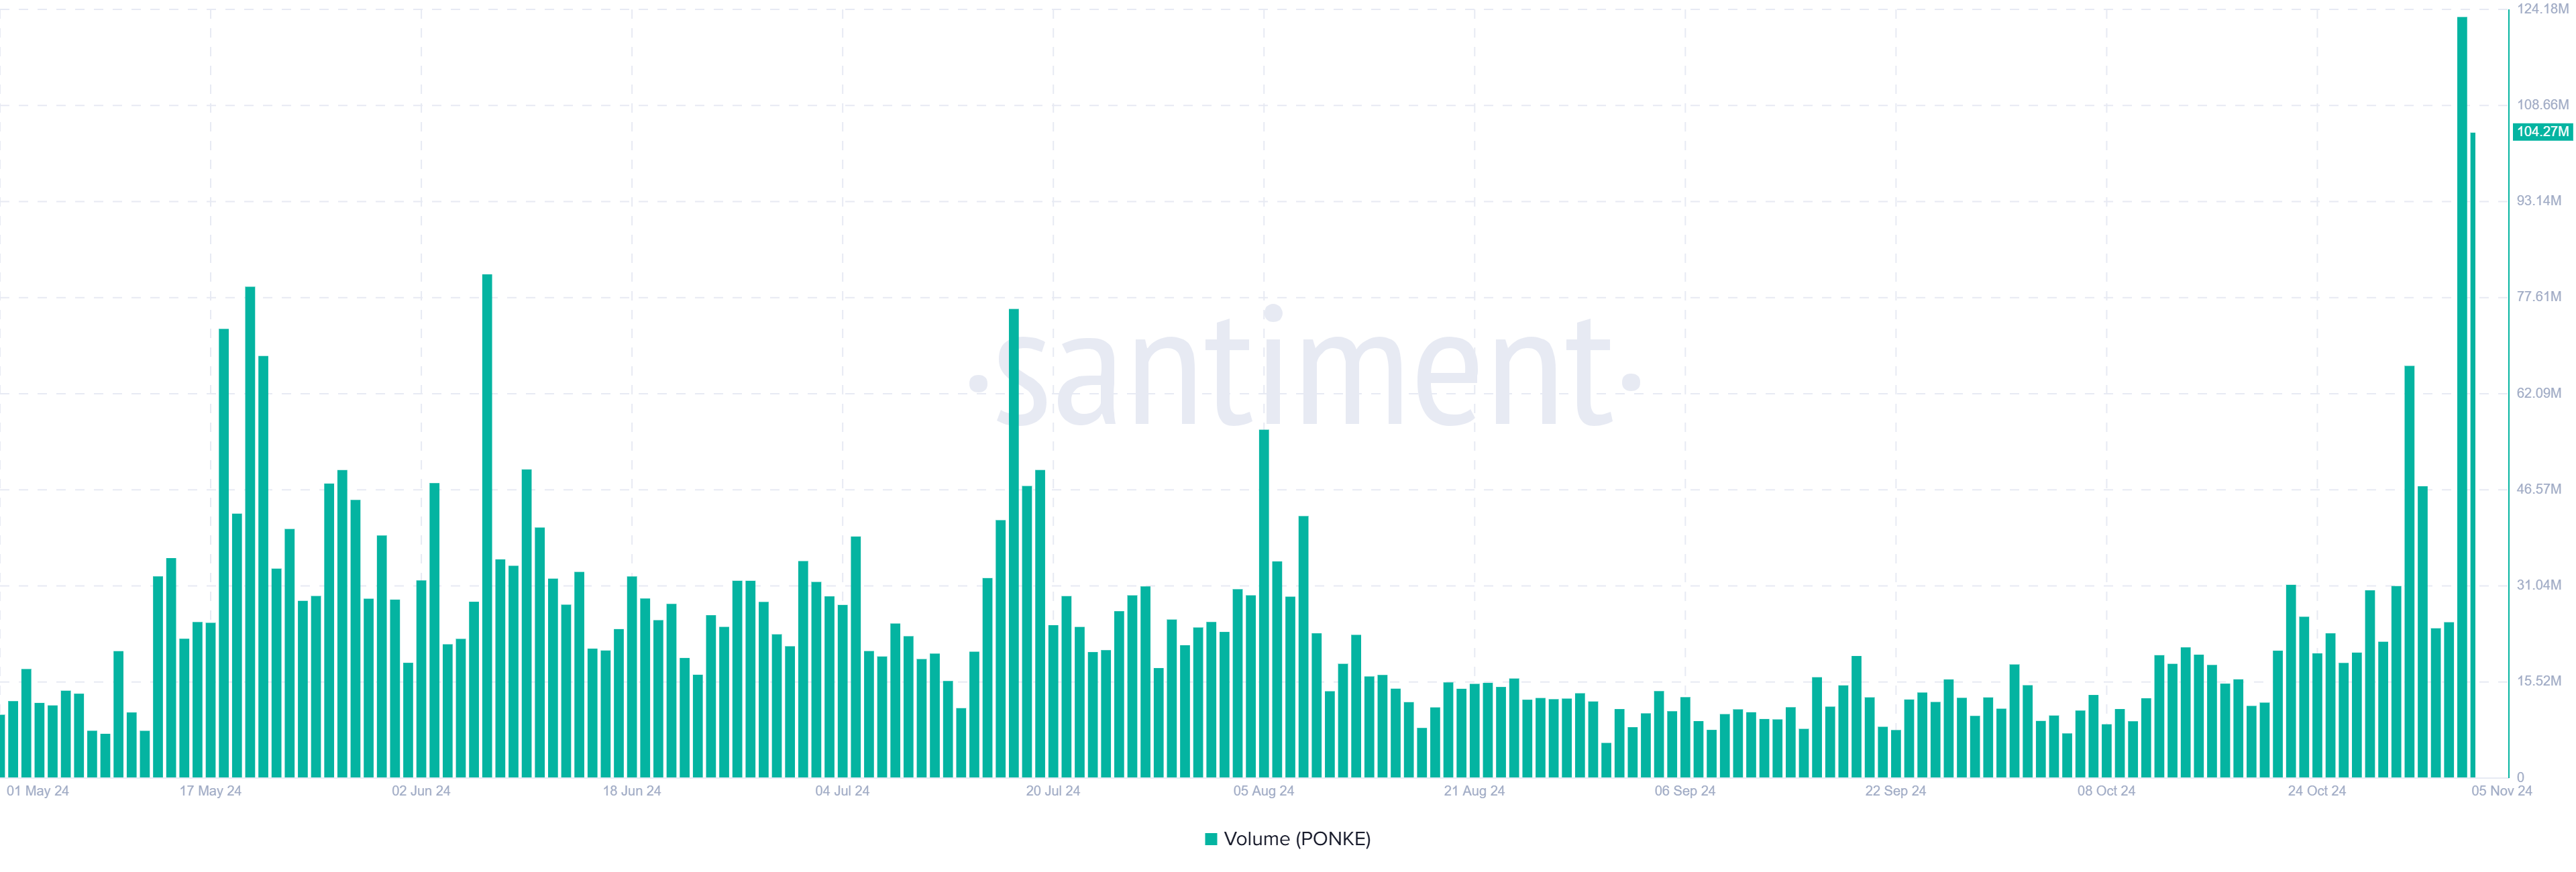 PONKE Transaction Volume. Source: Santiment
PONKE’s macro momentum also looks promising, as indicated by recent transaction volume data. Following Monday’s 32% drop, transaction volume surged by 54% over the past 24 hours. Despite this increase in volume, PONKE’s price has stabilized rather than declined further, which implies that the majority of transactions are driven by buying interest.
Increased transaction volume amid price stability is generally a positive indicator, as it suggests accumulating interest rather than a sell-off. For PONKE, this trend supports the case for a potential rebound, further bolstered by its Ichimoku Cloud position.
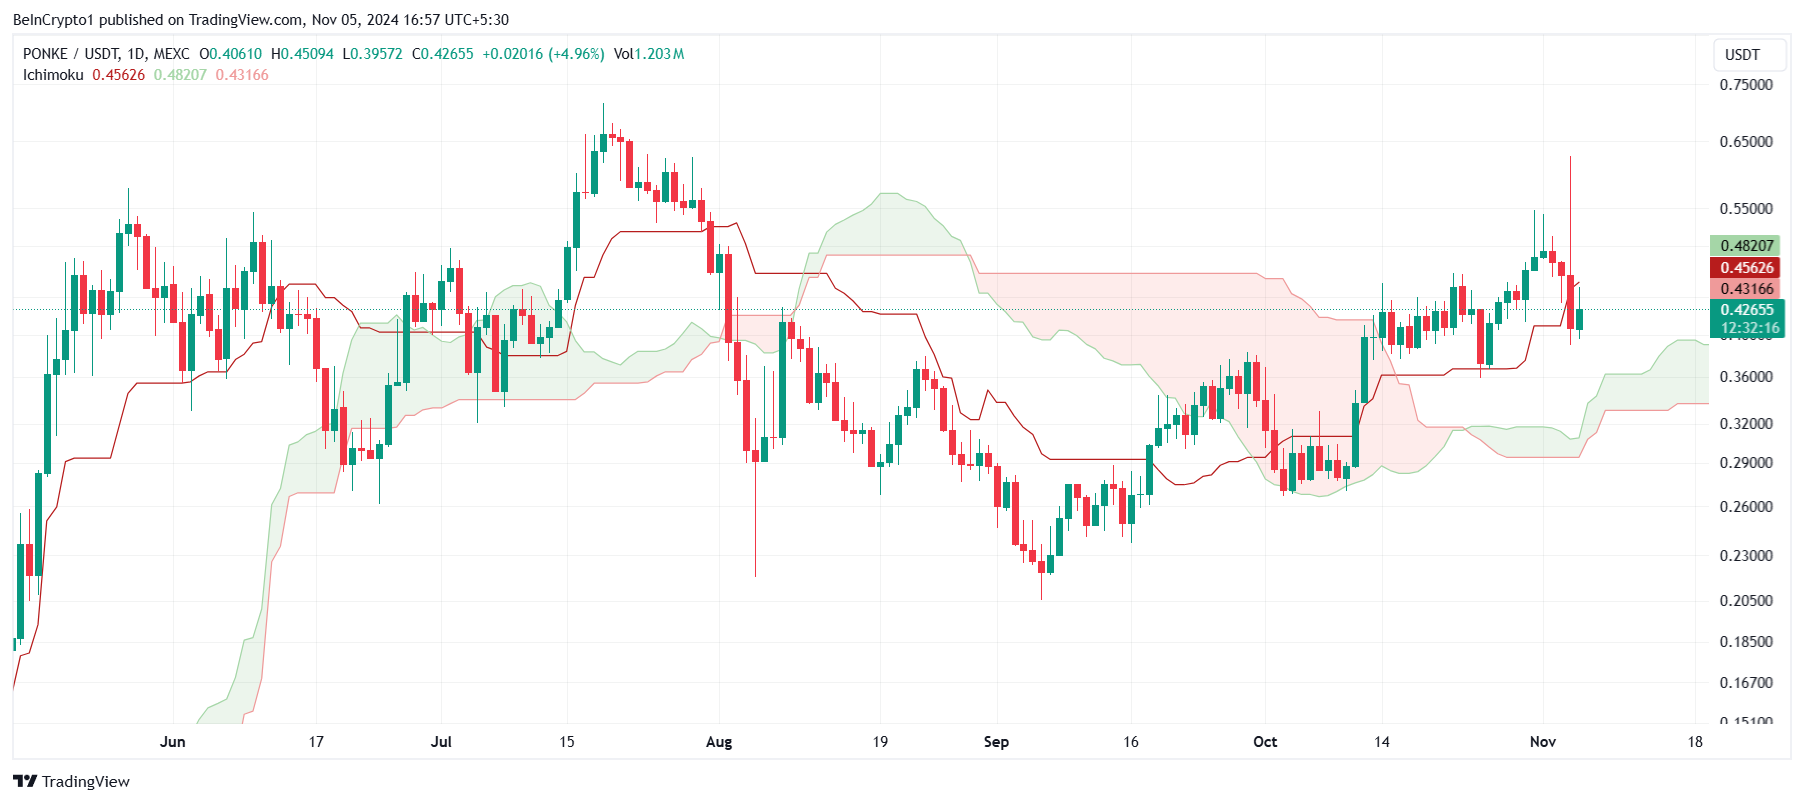 PONKE Ichimoku Cloud. Source: TradingView
PONKE Price Prediction: Aiming High
PONKE’s price is currently at $0.425, down 32% from Monday’s high, having failed to secure the $0.503 level as support. The inability to establish a new ATH and maintain $0.503 as a support level has introduced short-term caution among meme coin traders.
Historically, PONKE has shown resilience after similar pullbacks, with July’s rally being a notable exception. Given the positive factors from the Ichimoku Cloud and transaction volume, a recovery could be on the horizon. If the meme coin flips $0.503 into support, it may be poised to target a new ATH beyond $0.714.
Read More: What Are Meme Coins?
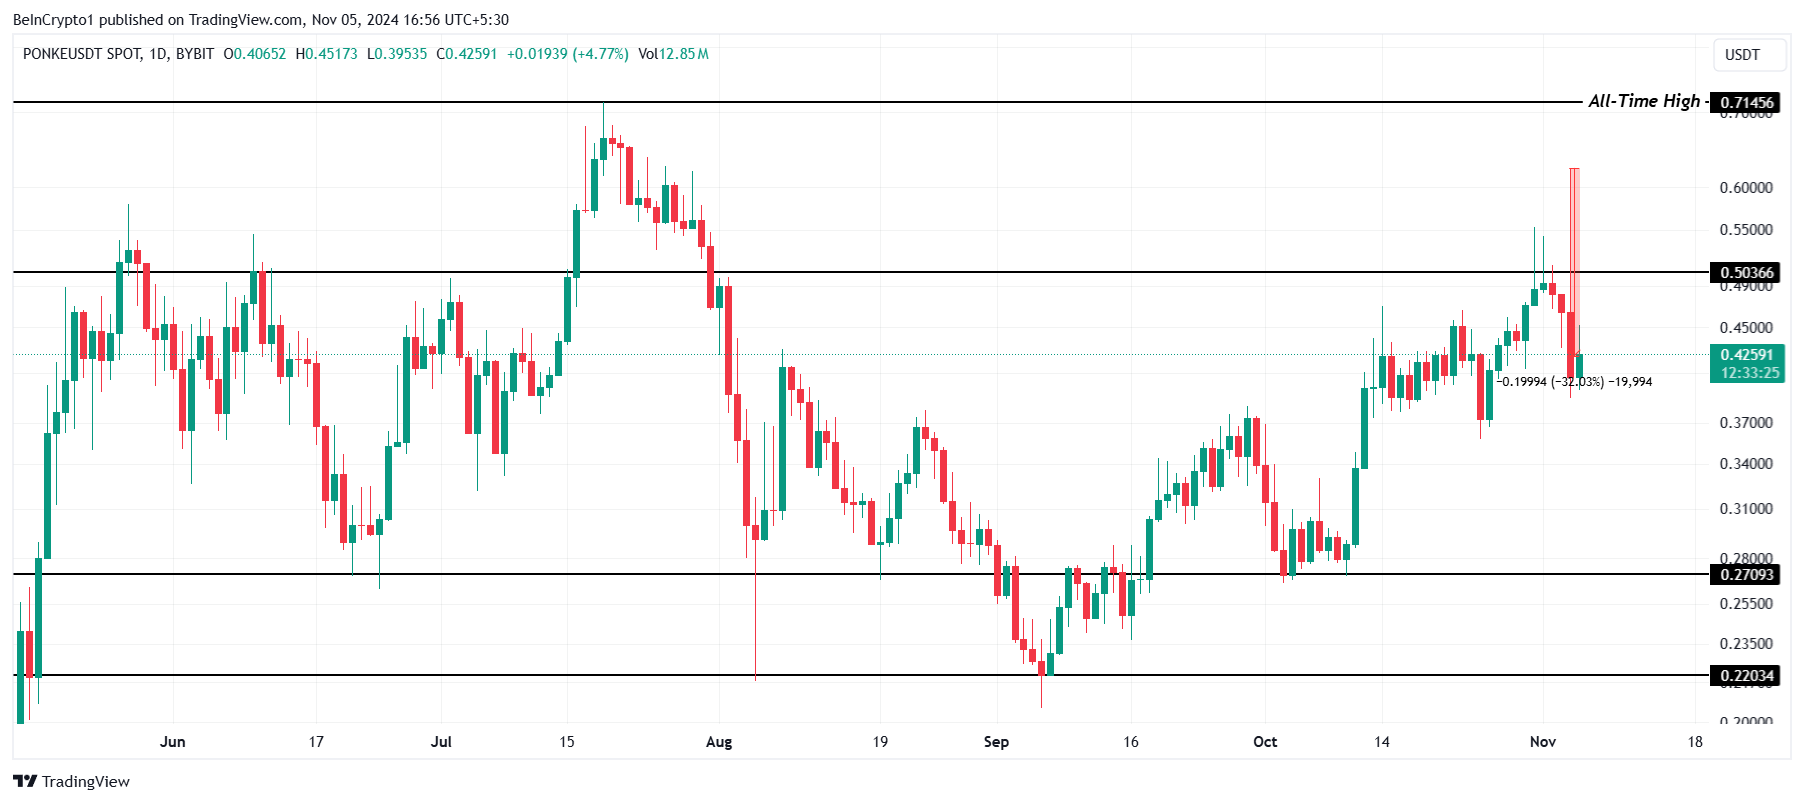 PONKE Price Analysis. Source: TradingView
However, if PONKE fails to breach $0.503 and turn it into support, the asset could enter a period of consolidation. Should profit-taking continue, a drop toward $0.270 could occur, which would invalidate the bullish outlook and shift market sentiment more conservatively.
Recommended Articles


