

Dogecoin Analyst Reveals Buying Opportunities At Lower Prices – Details

Source Newsbtc

Dogecoin (DOGE) is currently trading at a pivotal level following a 17% retrace from its recent highs around $0.179. This pullback has brought DOGE to a significant demand zone, catching the attention of top analyst Daan, who recently shared a technical analysis identifying this level as an opportunity for accumulation. According to Daan, the current support zone could act as a launchpad if buying pressure intensifies, positioning DOGE for a potential rebound.

However, the upcoming days are expected to bring heightened volatility and uncertainty, primarily due to the approaching US election and its anticipated impact on financial markets. As broader market sentiment often influences Dogecoin, this period could present swings in price as traders adjust to both political developments and economic responses.

The key now is whether Dogecoin can hold above this demand zone. If buyers step in and support builds, a recovery could see DOGE reattempt recent highs or push even further. 

Conversely, failing to hold this level might lead to a deeper retrace. Investors are closely watching this area, recognizing that Dogecoin’s next moves will be shaped by internal technicals and external market conditions in the days ahead.

Dogecoin At Key Levels 

Crypto analyst Daan recently shared a detailed technical analysis on X, highlighting that Dogecoin is approaching what he sees as prime accumulation levels. With DOGE trading around the $0.151 mark, Daan notes that this price point has acted as a resistance zone for several weeks, making it a key area for potential buying. 
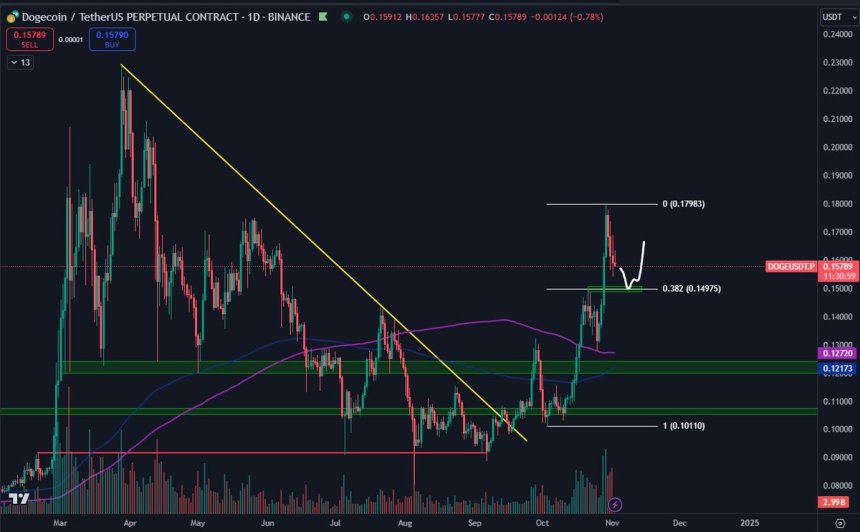
Dogecoin demand levels to accumulate

In his analysis, Daan points out that the upcoming US election adds a significant layer of uncertainty to the market, dubbing it a “toss-up” for short-term price direction. He explains that the election outcome could impact both traditional and crypto markets, which may lead to temporary downward pressure or a surprising upward movement depending on results and broader market sentiment. Yet, for Dogecoin specifically, he believes that if the price continues to decline to these strategic levels, the risk/reward ratio could be favorable for buyers looking to “take a punt.”

Daan also notes that Monday could bring further opportunities if DOGE dips lower, though he advises caution due to the likely volatility in the coming days. The analyst emphasizes that while these are risky conditions, the chance to accumulate DOGE at historically significant levels may pay off if the broader market sentiment aligns favorably post-election.

Ultimately, the coming days for Dogecoin look to be both volatile and uncertain, and whether it holds the $0.151 mark or dips further could set the stage for the coin’s next move. Investors watching DOGE closely are mindful of both the technical setup and external market factors, hoping for a possible rebound in this tumultuous environment.

DOGE Technical View

Dogecoin is currently trading at a key level of $0.151, where previous supply has now shifted to a crucial demand zone. This level will be essential for bulls looking to regain momentum and push DOGE toward new highs. Holding above $0.151 is vital for establishing a foundation that could propel the price higher, providing the market confidence needed for a potential upward trend.
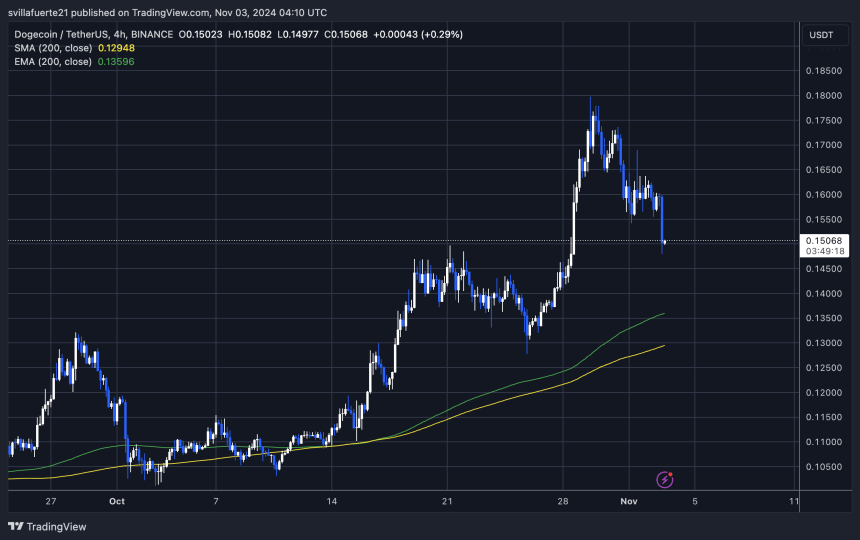
DOGE testing crucial level at $0.15

However, if DOGE fails to sustain this level, it could trigger a pullback toward the next major demand zone around $0.135. This lower level has acted as support in the past and could serve as a crucial point for accumulation if selling pressure increases.

The coming days will reveal whether buyers can defend this $0.151 zone or if a deeper correction is on the horizon. Breaking above current levels would give DOGE the bullish push needed to test higher resistance zones and potentially establish a stronger uptrend. Conversely, losing support here would signal that sellers are still in control, setting DOGE up for a retest of lower demand levels. As volatility remains high, traders are closely monitoring these critical support and resistance points.

Featured image from Dall-E, chart from TradingView

Disclaimer: For information purposes only. Past performance is not indicative of future results.
placeholder
Gold Price Analysis Today | Forex Gold Analysis | XAU/USD Analysis - November 11, 2026Get the latest gold price analysis, forex gold insights, and XAU/USD analysis for November 11, 2026. Read on for the details.
Author  Mitrade
Nov 11, Wed
Get the latest gold price analysis, forex gold insights, and XAU/USD analysis for November 11, 2026. Read on for the details.
placeholder
Bitcoin lost its 200-day average — but the exit started three sessions before the CPIBitcoin fell 2.5% to about $73,400 on 11 November, an 11-week low, breaking its 200-day moving average near $73,100. The 24-hour liquidation tally reached $632 to $705 million, roughly 82% of it longs. But spot ETF outflows began three sessions earlier and USDT's market cap has shrunk $6.6 billion in 60 days — the leveraged length left before the inflation print did. A double top at 81,890 and 81,080 leaves a measured target of 69,366.
Author  Suzie
Nov 11, Wed
Bitcoin fell 2.5% to about $73,400 on 11 November, an 11-week low, breaking its 200-day moving average near $73,100. The 24-hour liquidation tally reached $632 to $705 million, roughly 82% of it longs. But spot ETF outflows began three sessions earlier and USDT's market cap has shrunk $6.6 billion in 60 days — the leveraged length left before the inflation print did. A double top at 81,890 and 81,080 leaves a measured target of 69,366.
placeholder
Gold Extends Slide Below $4,000 as Rising US Inflation, Fed December Hike Bets Pressure Prices On November 12, gold prices (XAUUSD) extended their recent losses, falling further below $4,000 in early Asian trading to hit an intraday low near $3,968, marking a third consecutive day
Author  TradingKey
Yesterday 02: 00
On November 12, gold prices (XAUUSD) extended their recent losses, falling further below $4,000 in early Asian trading to hit an intraday low near $3,968, marking a third consecutive day
placeholder
Nvidia slid 7.7% after hours while AMD and Broadcom rose — the AI trade changed hands, it didn't breakNvidia closed Wednesday at 173.73, up 2.87%, then fell as much as 8.1% to 159.44 after reports that its board was preparing for a possible leadership change. The same session, the Philadelphia Semiconductor Index rose 5.7% with all 30 components higher, CoreWeave jumped 24.7% on 168% revenue growth, and Micron added 11.9%. If AI demand were being repriced, AMD and Broadcom would not be bid. This is a governance discount on one name, and 204.54 — the 200-day average — is the level that settles it.
Author  Irene Q.
Yesterday 02: 45
Nvidia closed Wednesday at 173.73, up 2.87%, then fell as much as 8.1% to 159.44 after reports that its board was preparing for a possible leadership change. The same session, the Philadelphia Semiconductor Index rose 5.7% with all 30 components higher, CoreWeave jumped 24.7% on 168% revenue growth, and Micron added 11.9%. If AI demand were being repriced, AMD and Broadcom would not be bid. This is a governance discount on one name, and 204.54 — the 200-day average — is the level that settles it.
placeholder
Gold closed below $4,000 again — the ETF crowd and central banks stayed, the momentum money leftSpot gold is trading near $3,999, its third consecutive lower daily low, after a 5.00% 10-year yield and a 102.85 dollar index raised the odds of a December hike to 87%. But the selling is not coming from the strategic holders: managed-money net longs fell to 324 tonnes, a 21-week low, and Goldman Sachs attributes roughly 95% of five weeks of selling to non-reportable positions. ETFs still hold a record 4,256 tonnes and central banks bought 321 tonnes in Q3. The table below sets the triggers, directions and levels.
Author  Irene Q.
Yesterday 03: 20
Spot gold is trading near $3,999, its third consecutive lower daily low, after a 5.00% 10-year yield and a 102.85 dollar index raised the odds of a December hike to 87%. But the selling is not coming from the strategic holders: managed-money net longs fell to 324 tonnes, a 21-week low, and Goldman Sachs attributes roughly 95% of five weeks of selling to non-reportable positions. ETFs still hold a record 4,256 tonnes and central banks bought 321 tonnes in Q3. The table below sets the triggers, directions and levels.
goTop
quote