

SHIB Price Likely Bound for Correction Despite 10% Hike in October
In October, Shiba Inu’s (SHIB) price increased by 10%, driving speculation that the token could extend this rally. But as November began, things seemed to have changed.
As of this writing, SHIB’s price is $0.000018. Here is why the cryptocurrency’s value could be lower within the next few weeks.
Investor Interaction with Shiba Inu Drops
Throughout most of last month, Shiba Inu’s Daily Active Addresses (DAA) divergence stayed positive, reflecting steady price growth alongside increased user interaction. The price DAA metric gauges how user engagement correlates with SHIB’s price performance. When both rise together, it indicates that active user involvement is bolstering the price trend.
However, recent data from Santiment shows a shift, with the price DAA divergence falling by 20%. This drop suggests a decline in active addresses engaging with SHIB, a trend historically linked to price drops. If this decrease in DAA persists, Shiba Inu may face further declines, potentially testing support levels below $0.000018.
Read more: 12 Best Shiba Inu (SHIB) Wallets in 2024
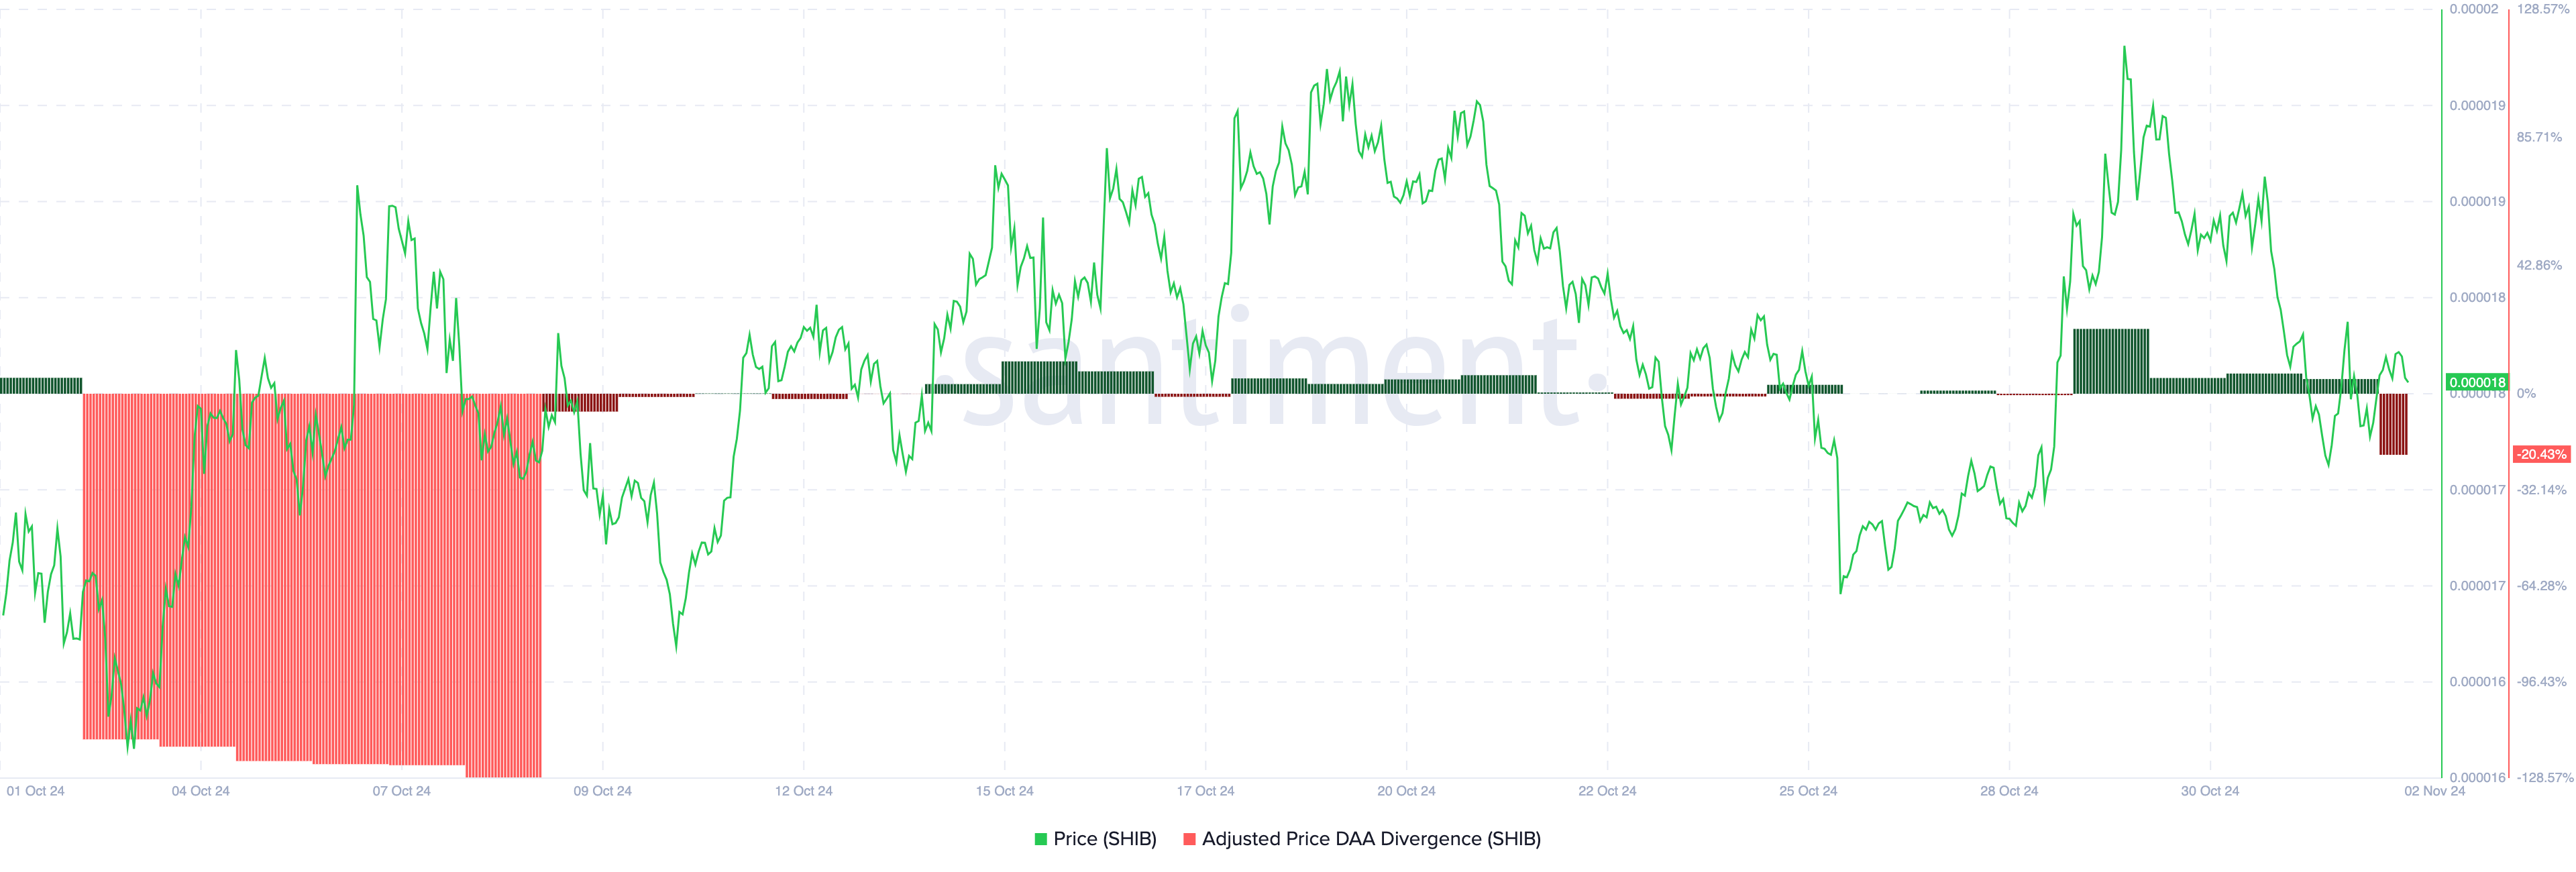 Shiba Inu Price DAA Divergence. Source: Santiment
In addition, on-chain data from IntoTheBlock indicates a decrease in Shiba Inu’s Coins Holding Time over the past week. This metric reflects the average duration that SHIB coins are held before being sold.
A decline in Coins Holding Time suggests that SHIB investors are becoming more active in selling rather than holding onto them for longer periods.
This trend can be interpreted as a sign of weakening investor confidence, indicating that holders may be looking to liquidate their positions amid a perceived lack of upward momentum. If this pattern continues, it could further exert downward pressure on SHIB’s price, especially with the previously mentioned drop in active addresses.
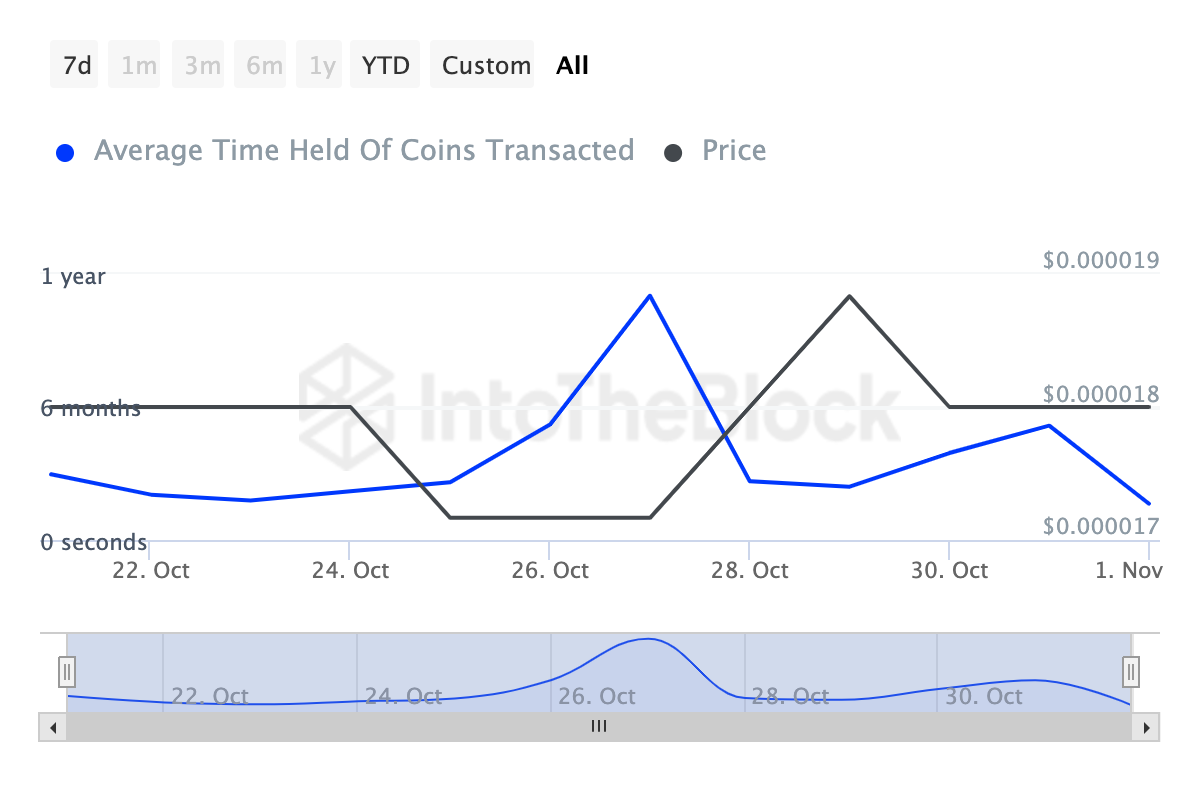 Shiba Inu Coins Holding Time. Source: IntoTheBlock
SHIB Price Prediction: Buyers Trapped, Decline Ahead
On the daily chart, SHIB’s price broke out of a descending triangle pattern on October 29. This breakout is often seen as a bullish signal, suggesting that the price could potentially trend upward.
However, SHIB’s price has fallen back into the descending triangle pattern, indicating that the initial breakout surge may have been a fakeout.
A fakeout occurs when the price briefly moves above a resistance level or pattern only to reverse quickly, trapping buyers who anticipated further gains. Furthermore, the Relative Strength Index (RSI) reading has also dropped, indicating a decline in bullish momentum.
Read more: Shiba Inu (SHIB) Price Prediction 2024/2025/2030
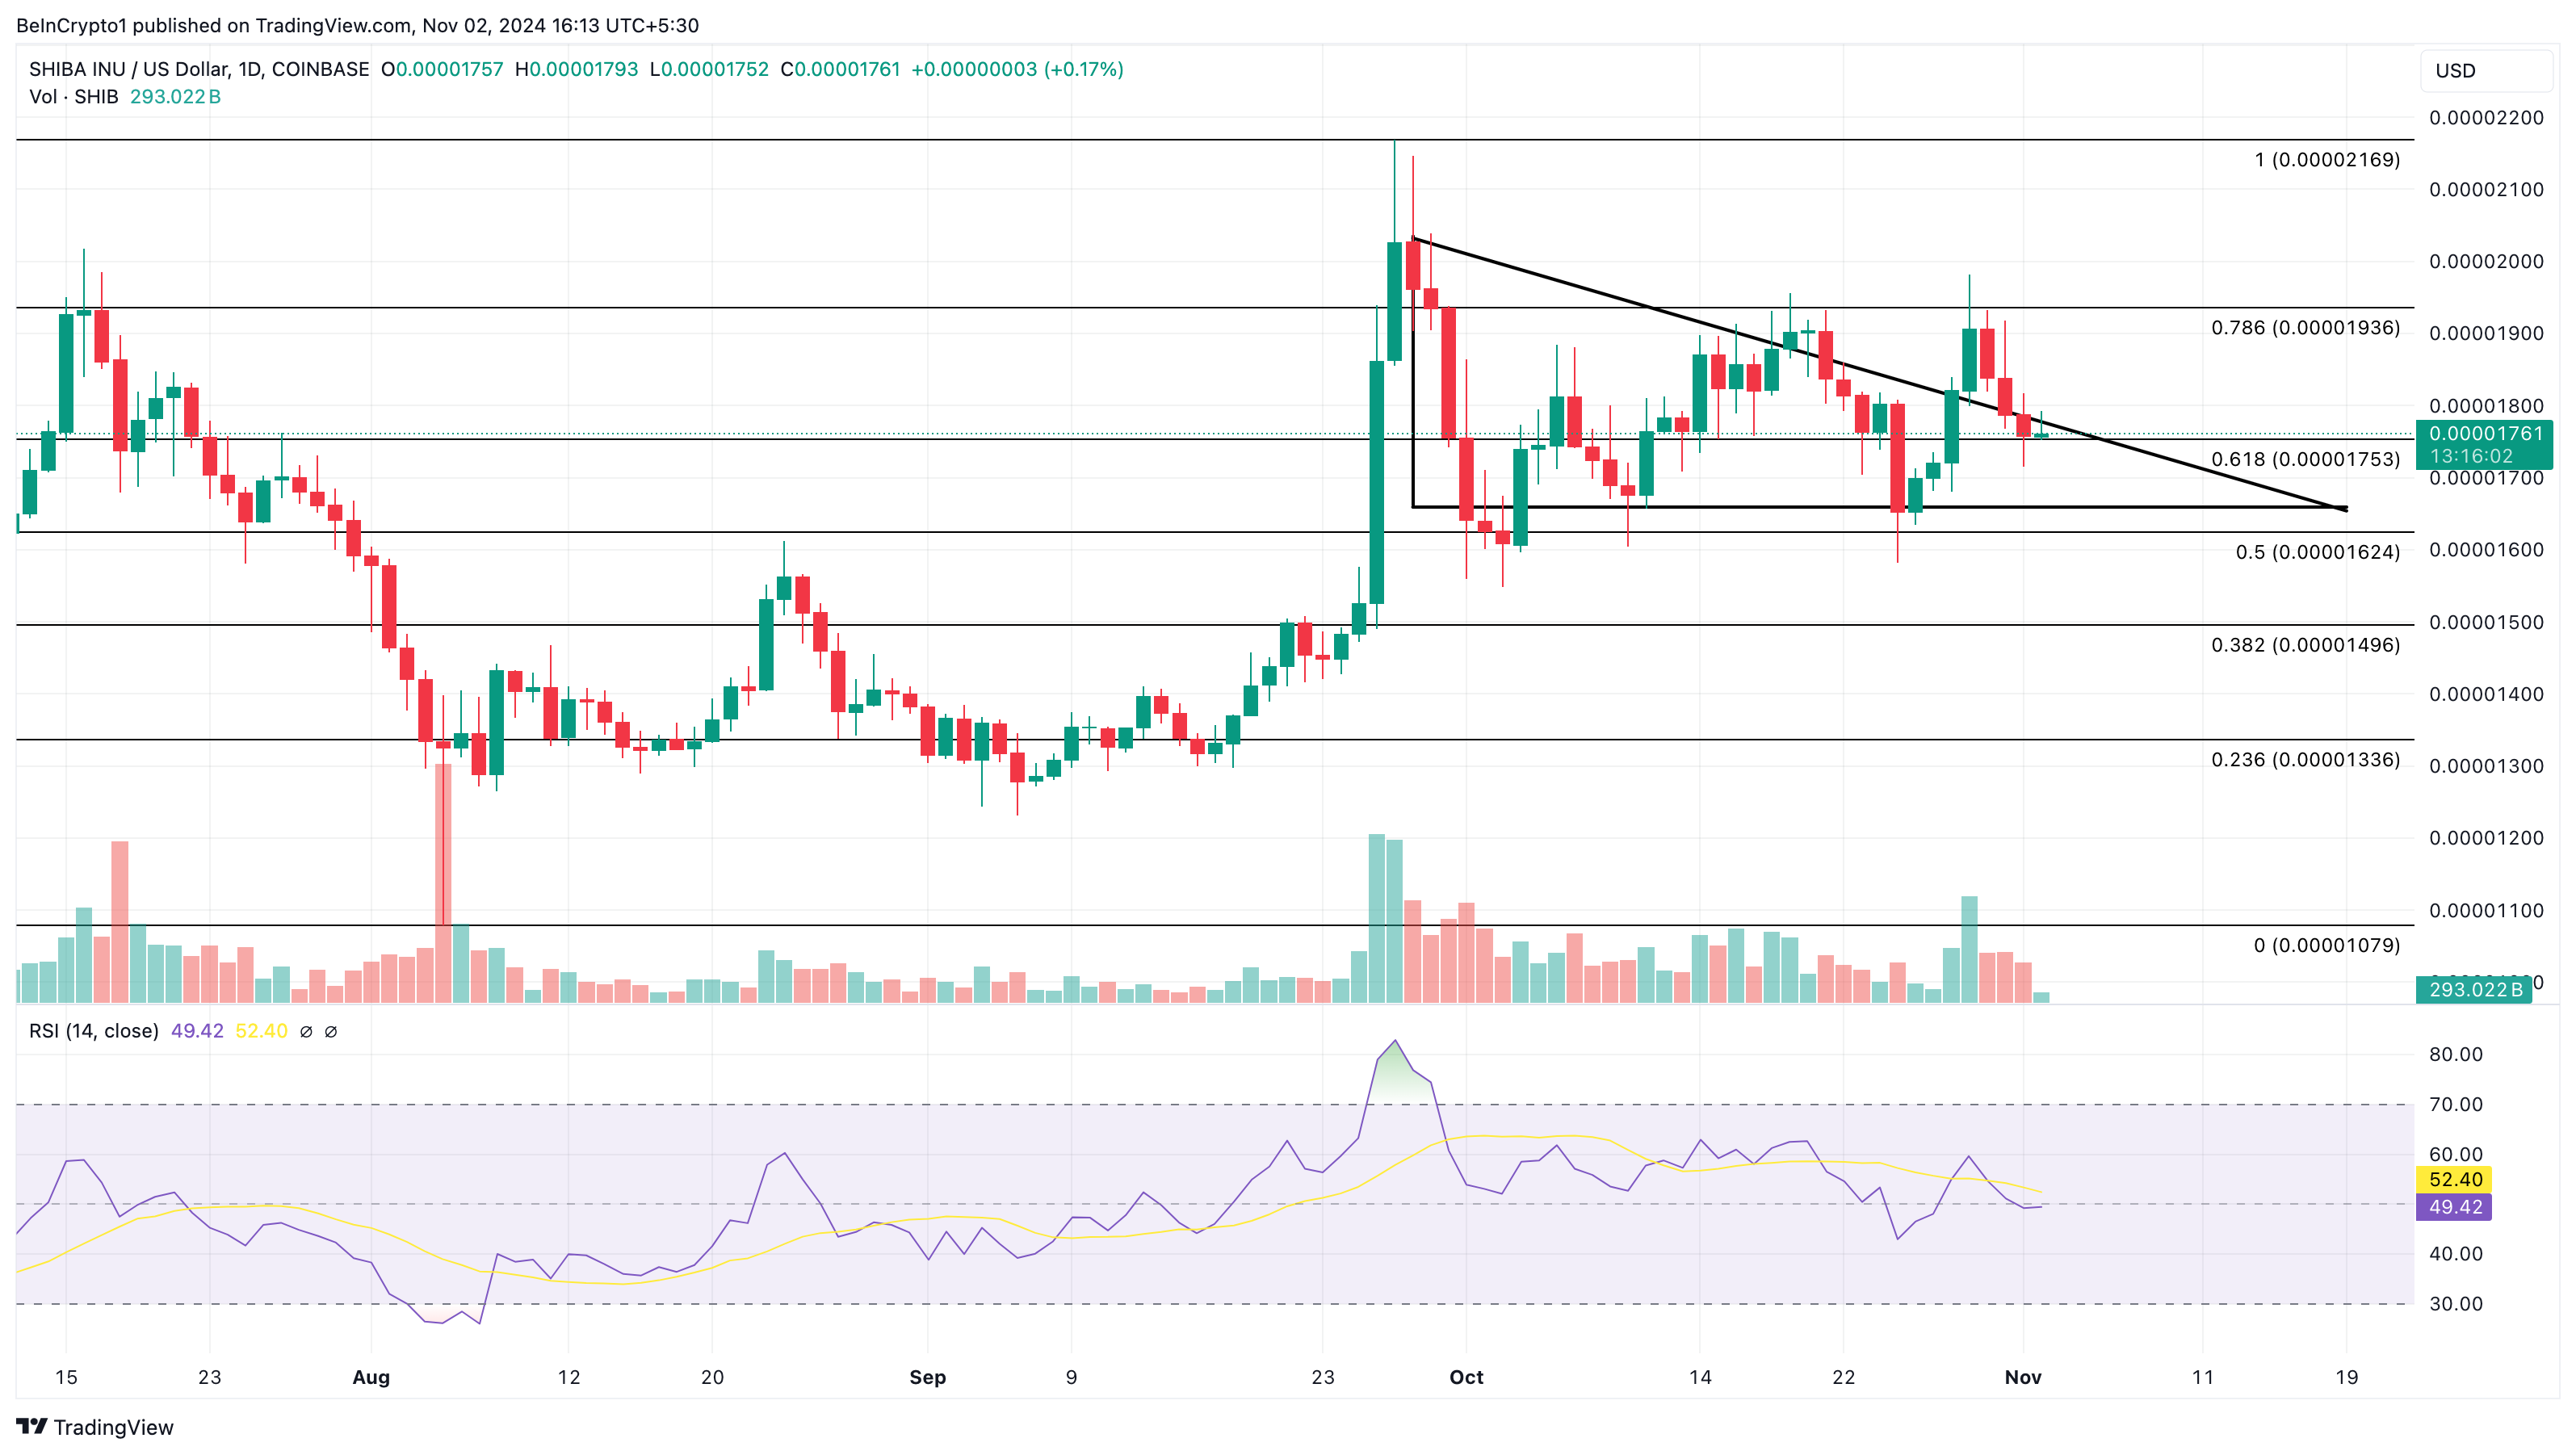 Shiba Inu Daily Analysis. Source: TradngView
As it stands, the price might decrease to $0.000015, and SHIB investors might have to cope with losses. However, if the token rises above the triangle pattern again, the value might climb to $0.000022.
Recommended Articles


