

Solana Price Forecast: SOL risks decline as volume in decentralized exchanges drops sharply
Solana price today: $175
- Solana trades broadly unchanged on Thursday, having hit a low of $173 earlier in the day.
- The DEX volume in the Solana ecosystem has dropped significantly, suggesting less activity.
- SOL risks a drop to support at $167 if a correction ensues.
Solana (SOL) price is nearly unchanged on Thursday after declining on Wednesday, putting an end to a four-day streak of gains. The altcoin rallied alongside Bitcoin (BTC) as the largest cryptocurrency chased its previous all-time high of $73,777. Post the correction, the outlook for Solana turns bleak and the altcoin could extend losses and sweep liquidity at the $167 support level, technical and on-chain indicators show.
Solana DEX volume drops sharply, likely driver of losses
Solana DEX volume represents the total volume traded across decentralized exchanges in the SOL ecosystem. DEX volume observed a significant decline from $13.3 billion in the week starting October 21 to $1.8 billion in the week starting October 28, according to Dune Analytics data.
Typically, a decline in DEX volume is indicative of either traders losing interest in the ecosystem or a loss in demand. This could negatively impact the token’s price as the chain’s utility drops.
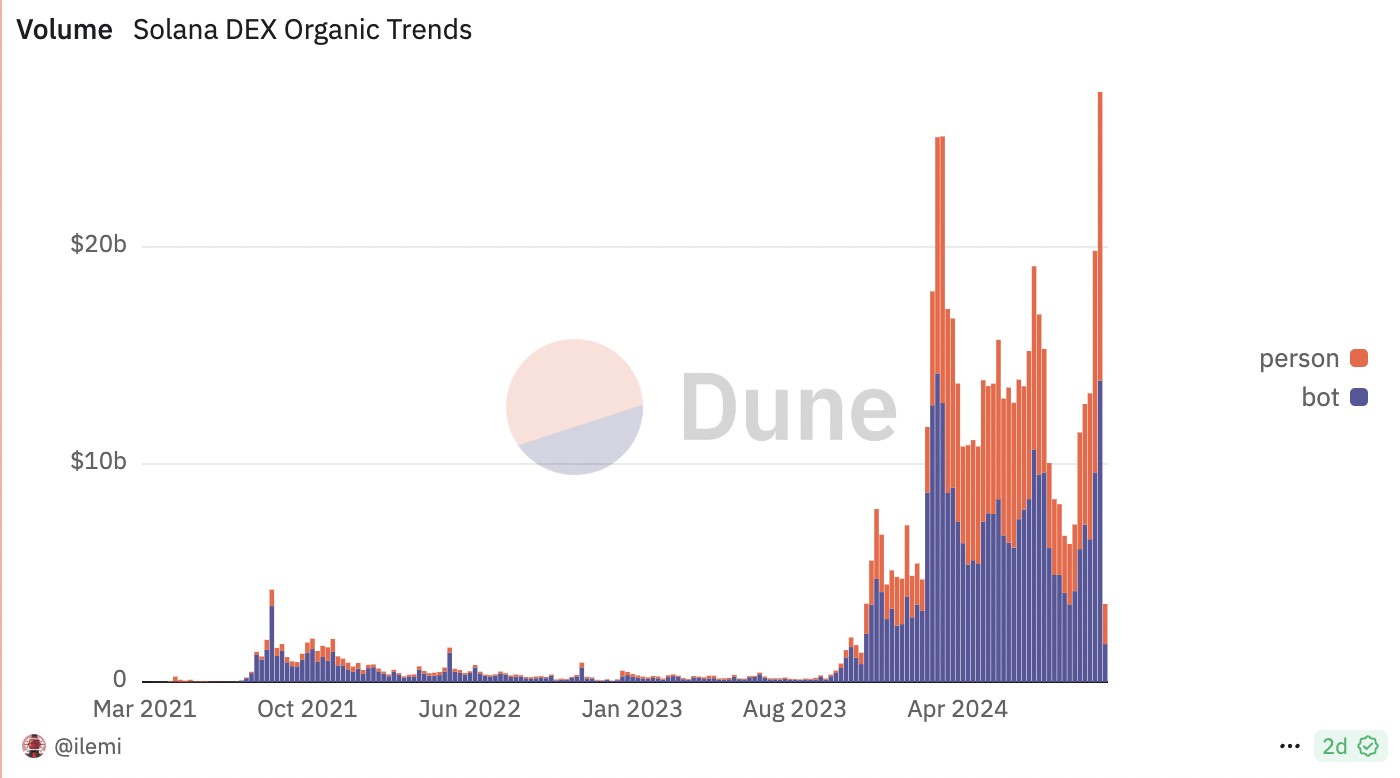
Solana DEX Organic Trends. Source: Dune Analytics.
Even as DEX volume declines, when compared to other blockchains, Solana leads, followed closely by its competitor Ethereum, according to data from Dune Analytics.
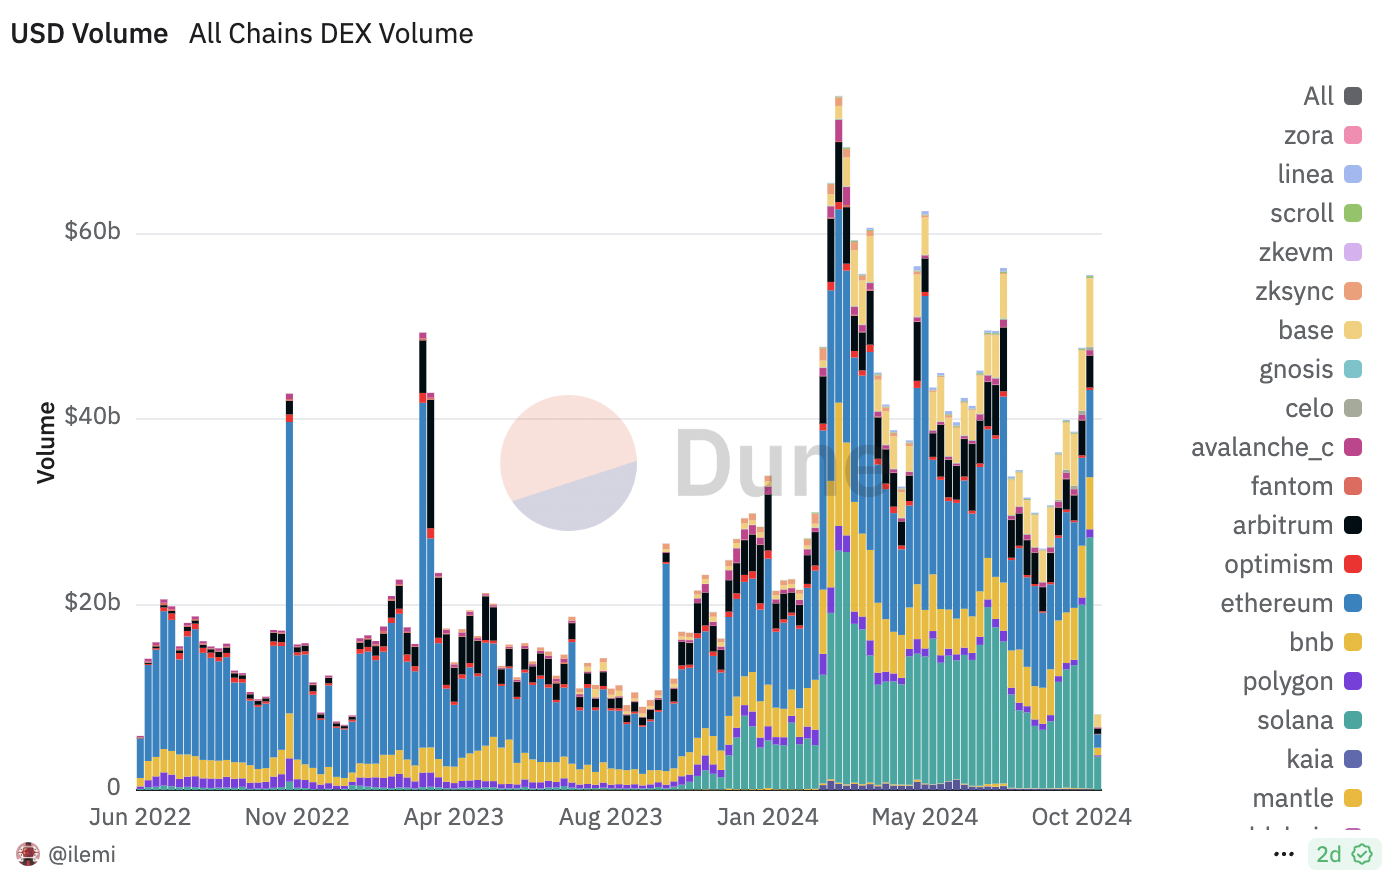
All chains DEX volume. Source: Dune Analytics
Solana Price Forecast: SOL could dip nearly 5%
Solana has been in an upward trend since October 3, forming higher highs and higher lows, as seen in the 8-hour price chart below. While the uptrend looks firm, the recent correction casts some doubts over its continuity as prices have failed to produce a higher high since the October 29 peak.
The momentum indicator Moving Average Convergence Divergence (MACD) signals a potential decline in SOL price. The MACD line (blue) has recently crossed below the signal line (red) above the zero line, providing a sell signal. Moreover, red histogram bars under the neutral line are getting longer, showing underlying negative momentum.
Meanwhile, the RSI reads 54 – slightly above the neutral level – giving little insight into the underlying weakness or strength of the trend. If a correction unfolds, Solana could find first support at $167.42, a level that aligns with the 10-day Exponential Moving Average (EMA) and the upper boundary of the Fair Value Gap (FVG). This would mark a nearly 5% decline in Solana’s price from the current level.
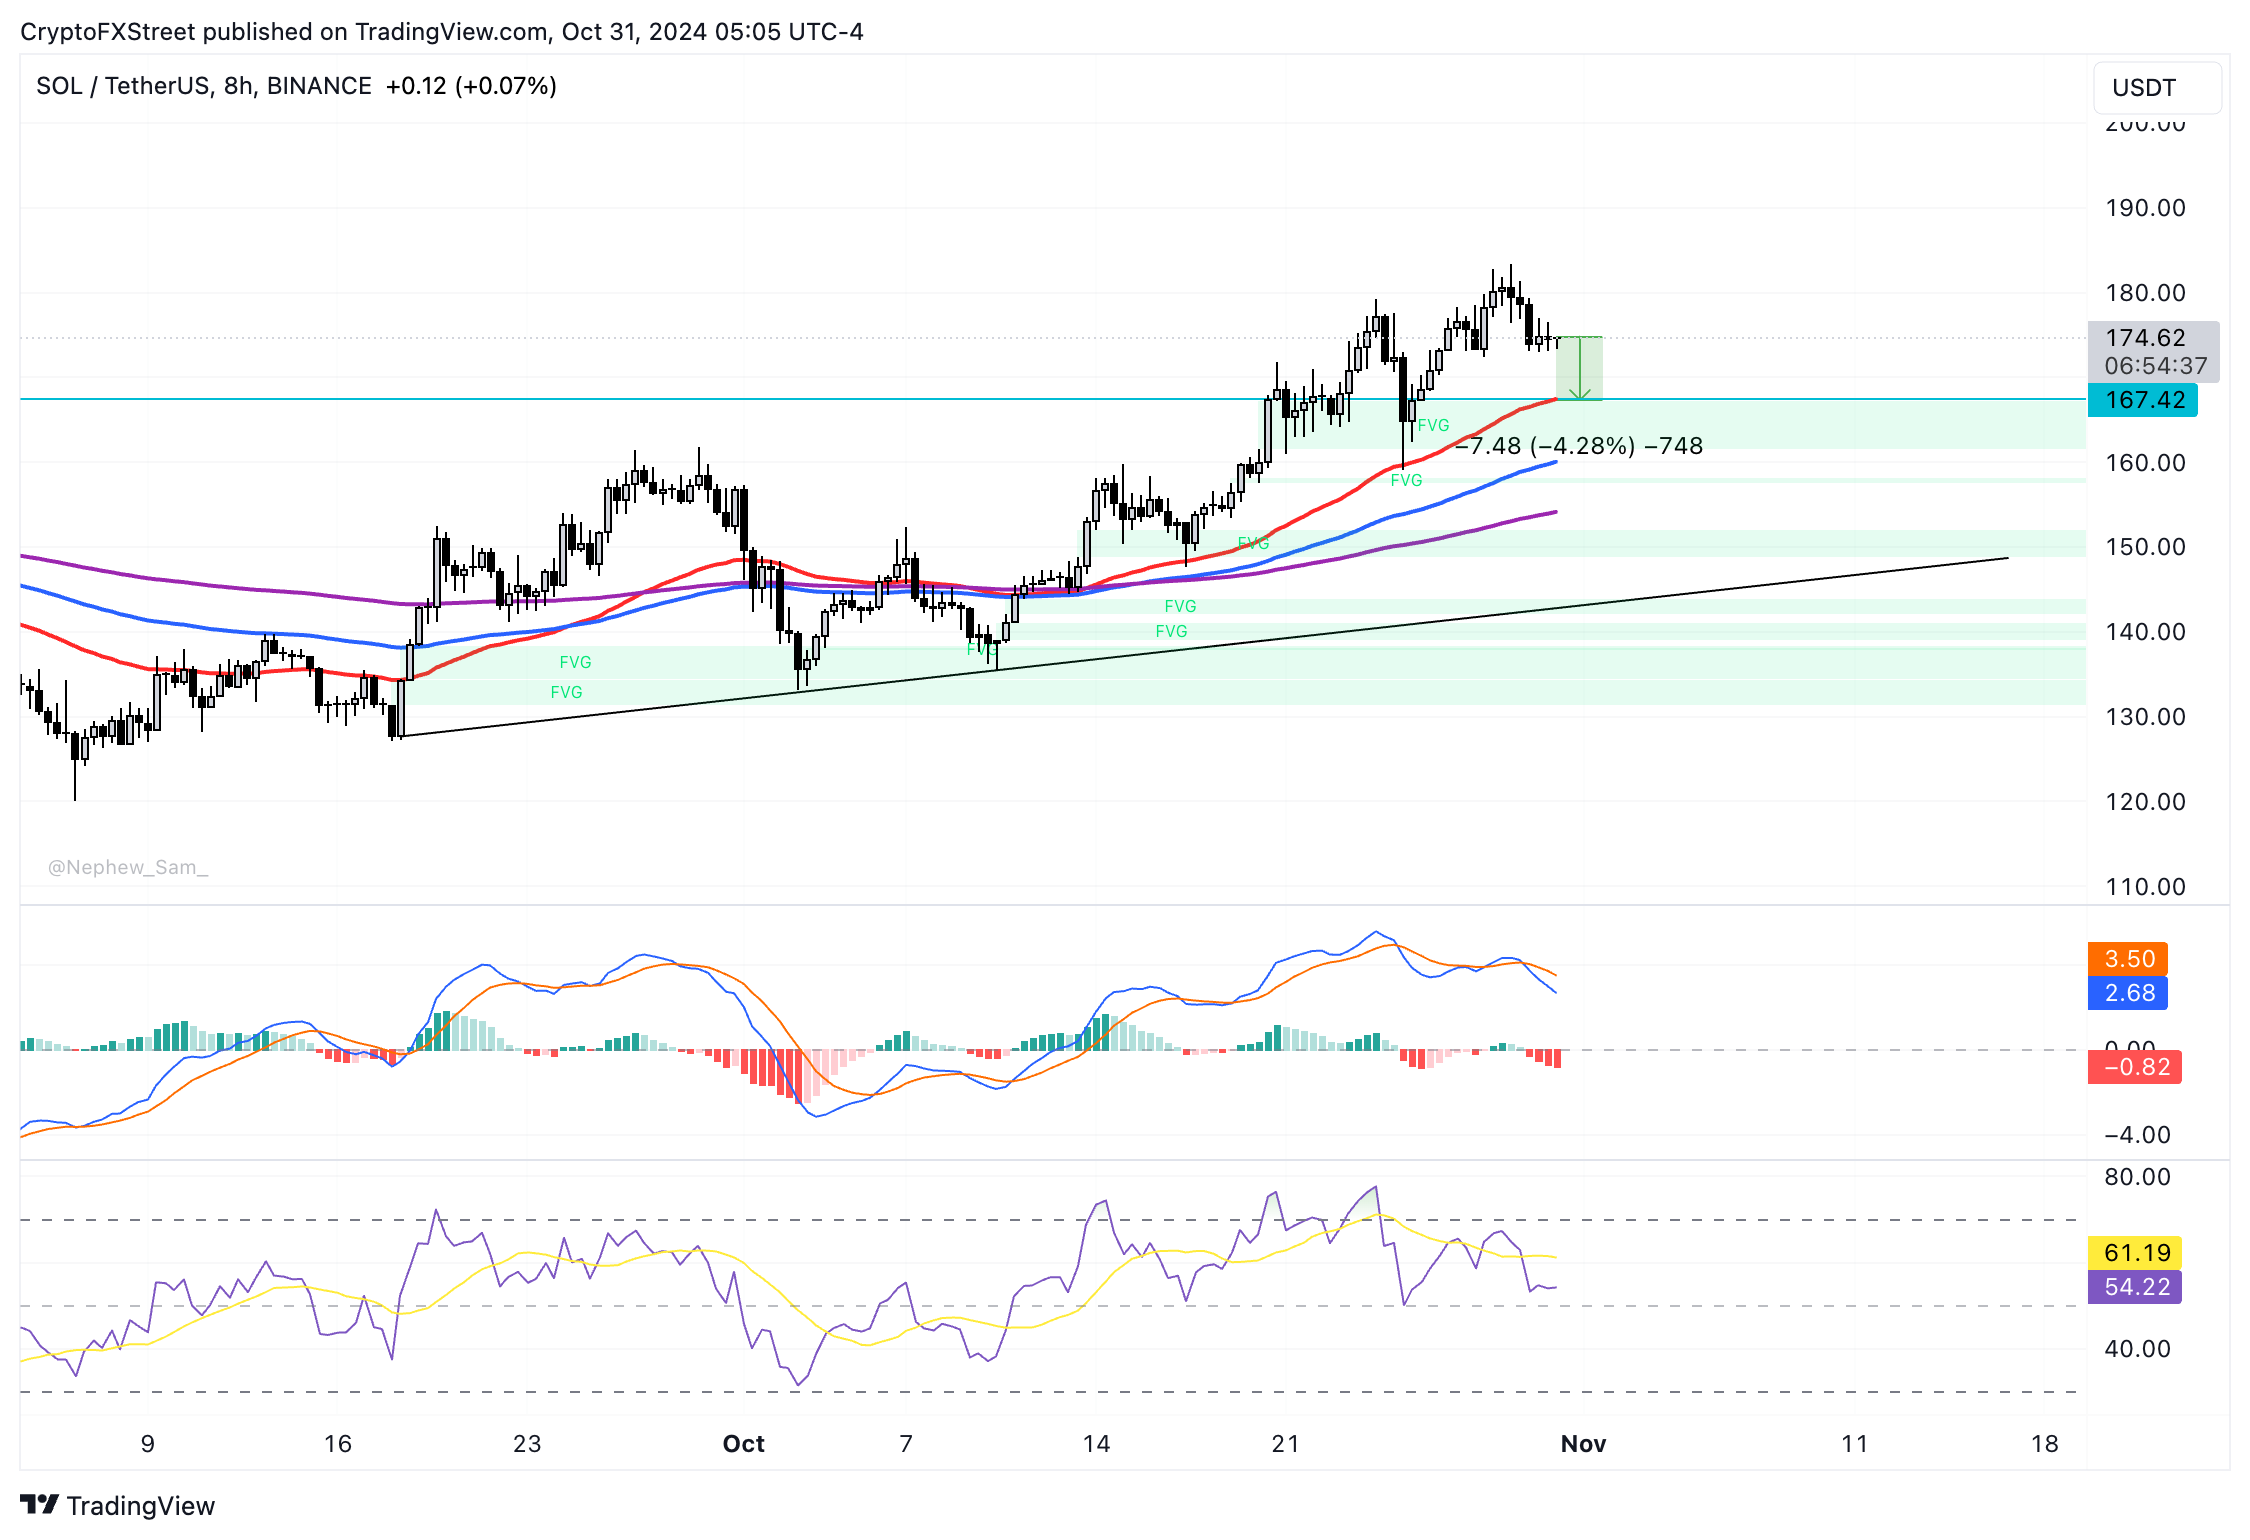
SOL/USDT 8-hour price chart
If Solana sees a daily candlestick close above $180, a psychologically important level for the altcoin, it could invalidate the bearish thesis. In this case, SOL could test the resistance at the October 29 high of $183.
Recommended Articles


