

XRP rallies ahead of Ripple Swell 2024, its annual conference for new technology
- XRP gains over 2% on Monday, trades above $0.5400.
- Ripple Swell, the annual conference held for the payment firm’s partners and clients, is scheduled for October 15 and 16.
- XRP eyes return to $0.60, the key psychological barrier for the altcoin.
Ripple (XRP) trades above $0.5400 early on Monday. The altcoin added over 2% to its value on the day, ahead of a key event. Ripple, a cross-border payment remittance firm, is gearing up for its annual conference called Ripple Swell.
The event is held for partners and clients of the firm and focuses on showcasing new developments and technology introduced by Ripple.
XRP holders watch the event closely for announcements and updates on the stablecoin project Ripple USD (RUSD) and the firm’s custody solutions.
Daily Digest Market Movers: Ripple Swell is likely the catalyst behind XRP gains
- Ripple Swell is the firm’s annual flagship event where executives talk about the latest updates in Ripple’s services and new products.
- In last year’s event, Ripple announced that the firm is preparing to serve Small and Medium Business Enterprises (SMEs). A panel of experts confirmed that Dubai, an emirate of the United Arab Emirates (UAE), is emerging as a hub and that crypto plays a crucial role in sustainability and climate finance.
- Ripple Swell is scheduled for October 15 and 16 in Miami.
- This year, XRP holders keep their eyes peeled for the announcement of the stablecoin RUSD’s launch date, new partnerships for digital asset custody solutions, and executives’ stance on the Security & Exchange Commission’s (SEC) recent appeal in a lawsuit.
- Ripple filed a counter appeal to the SEC after deliberation, and its Chief Legal Officer and CEO slammed the US financial regulator for their approach to crypto regulation.
Technical analysis: XRP eyes return to $0.60
XRP is in an upward trend that started on July 5, 2024. The XRP/USDT daily chart shows that the altcoin could climb nearly 10% to $0.60, a psychologically important level. XRP faces resistance at the upper boundary of the Fair Value Gap (FVG) between $0.5778 and $0.5445.
The Relative Strength Index (RSI) is at 46, which is close to 50, the neutral level.
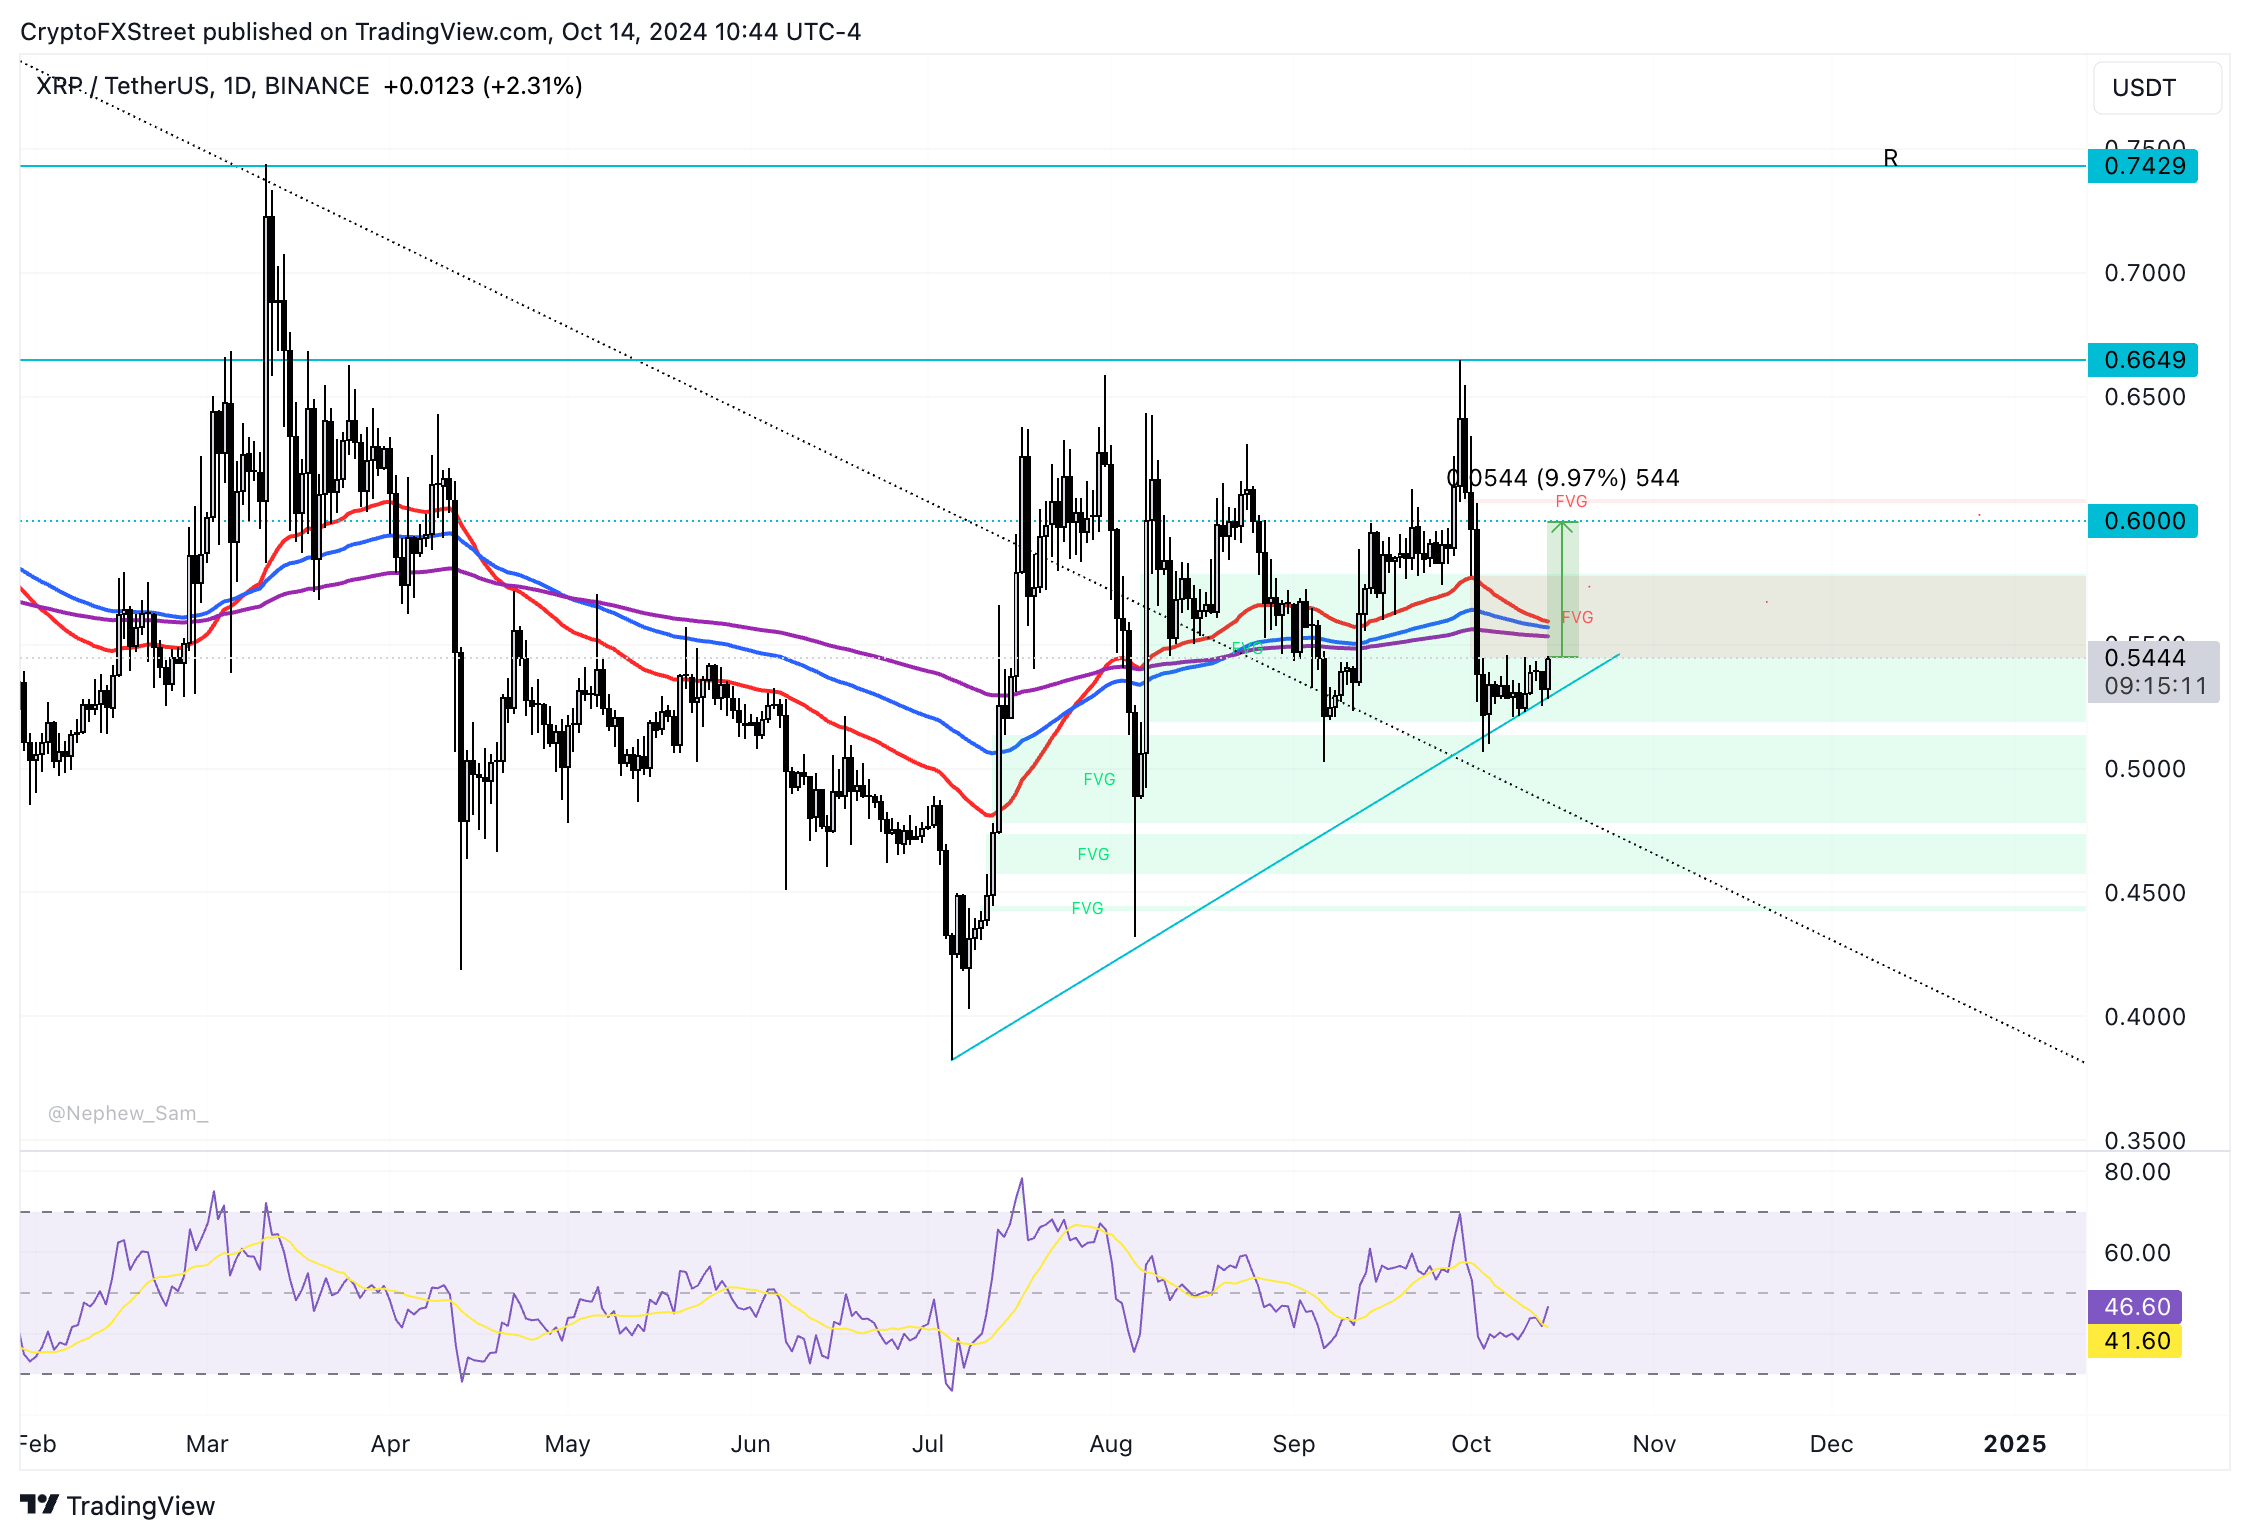
XRP/USDT daily chart
If there is a correction in XRP, the altcoin could sweep liquidity at $0.5188, the lower boundary of the FVG on the daily chart. The October 3 low of $0.5068 is another key support level for Ripple.
Bitcoin, altcoins, stablecoins FAQs
Bitcoin is the largest cryptocurrency by market capitalization, a virtual currency designed to serve as money. This form of payment cannot be controlled by any one person, group, or entity, which eliminates the need for third-party participation during financial transactions.
Altcoins are any cryptocurrency apart from Bitcoin, but some also regard Ethereum as a non-altcoin because it is from these two cryptocurrencies that forking happens. If this is true, then Litecoin is the first altcoin, forked from the Bitcoin protocol and, therefore, an “improved” version of it.
Stablecoins are cryptocurrencies designed to have a stable price, with their value backed by a reserve of the asset it represents. To achieve this, the value of any one stablecoin is pegged to a commodity or financial instrument, such as the US Dollar (USD), with its supply regulated by an algorithm or demand. The main goal of stablecoins is to provide an on/off-ramp for investors willing to trade and invest in cryptocurrencies. Stablecoins also allow investors to store value since cryptocurrencies, in general, are subject to volatility.
Bitcoin dominance is the ratio of Bitcoin's market capitalization to the total market capitalization of all cryptocurrencies combined. It provides a clear picture of Bitcoin’s interest among investors. A high BTC dominance typically happens before and during a bull run, in which investors resort to investing in relatively stable and high market capitalization cryptocurrency like Bitcoin. A drop in BTC dominance usually means that investors are moving their capital and/or profits to altcoins in a quest for higher returns, which usually triggers an explosion of altcoin rallies.
Recommended Articles


