Solana (SOL) Eyes $210 as It Approaches Make-or-Break Resistance Zone

Source Beincrypto

Solana’s price has maintained an upward trend in recent days, fueled by increased demand for the popular altcoin. Currently trading at $148.06, SOL has risen by 2% in the past week despite broader market stagnation.

This uptrend has brought SOL to a key resistance level at $148.16, which it is now attempting to break. If Solana manages to surpass this resistance, it could spark a rally toward $210 and beyond. But how soon can this breakout occur?

Solana Witnesses Uptick In Demand

Solana’s Relative Strength Index (RSI) is in an upward trend at 53.93 as of this writing. This indicator measures the coin’s oversold and overbought market conditions.

It ranges between 0 and 100, with values above 70 suggesting that the asset is overbought and due for a correction. On the other hand, values below 30 indicate that the asset is oversold and may soon witness a rebound. 

An RSI reading of 53.93 indicates that SOL buyers are gradually gaining strength, which could cause its price to maintain its uptrend. 

Read more: Solana vs. Ethereum: An Ultimate Comparison

Solana RSI
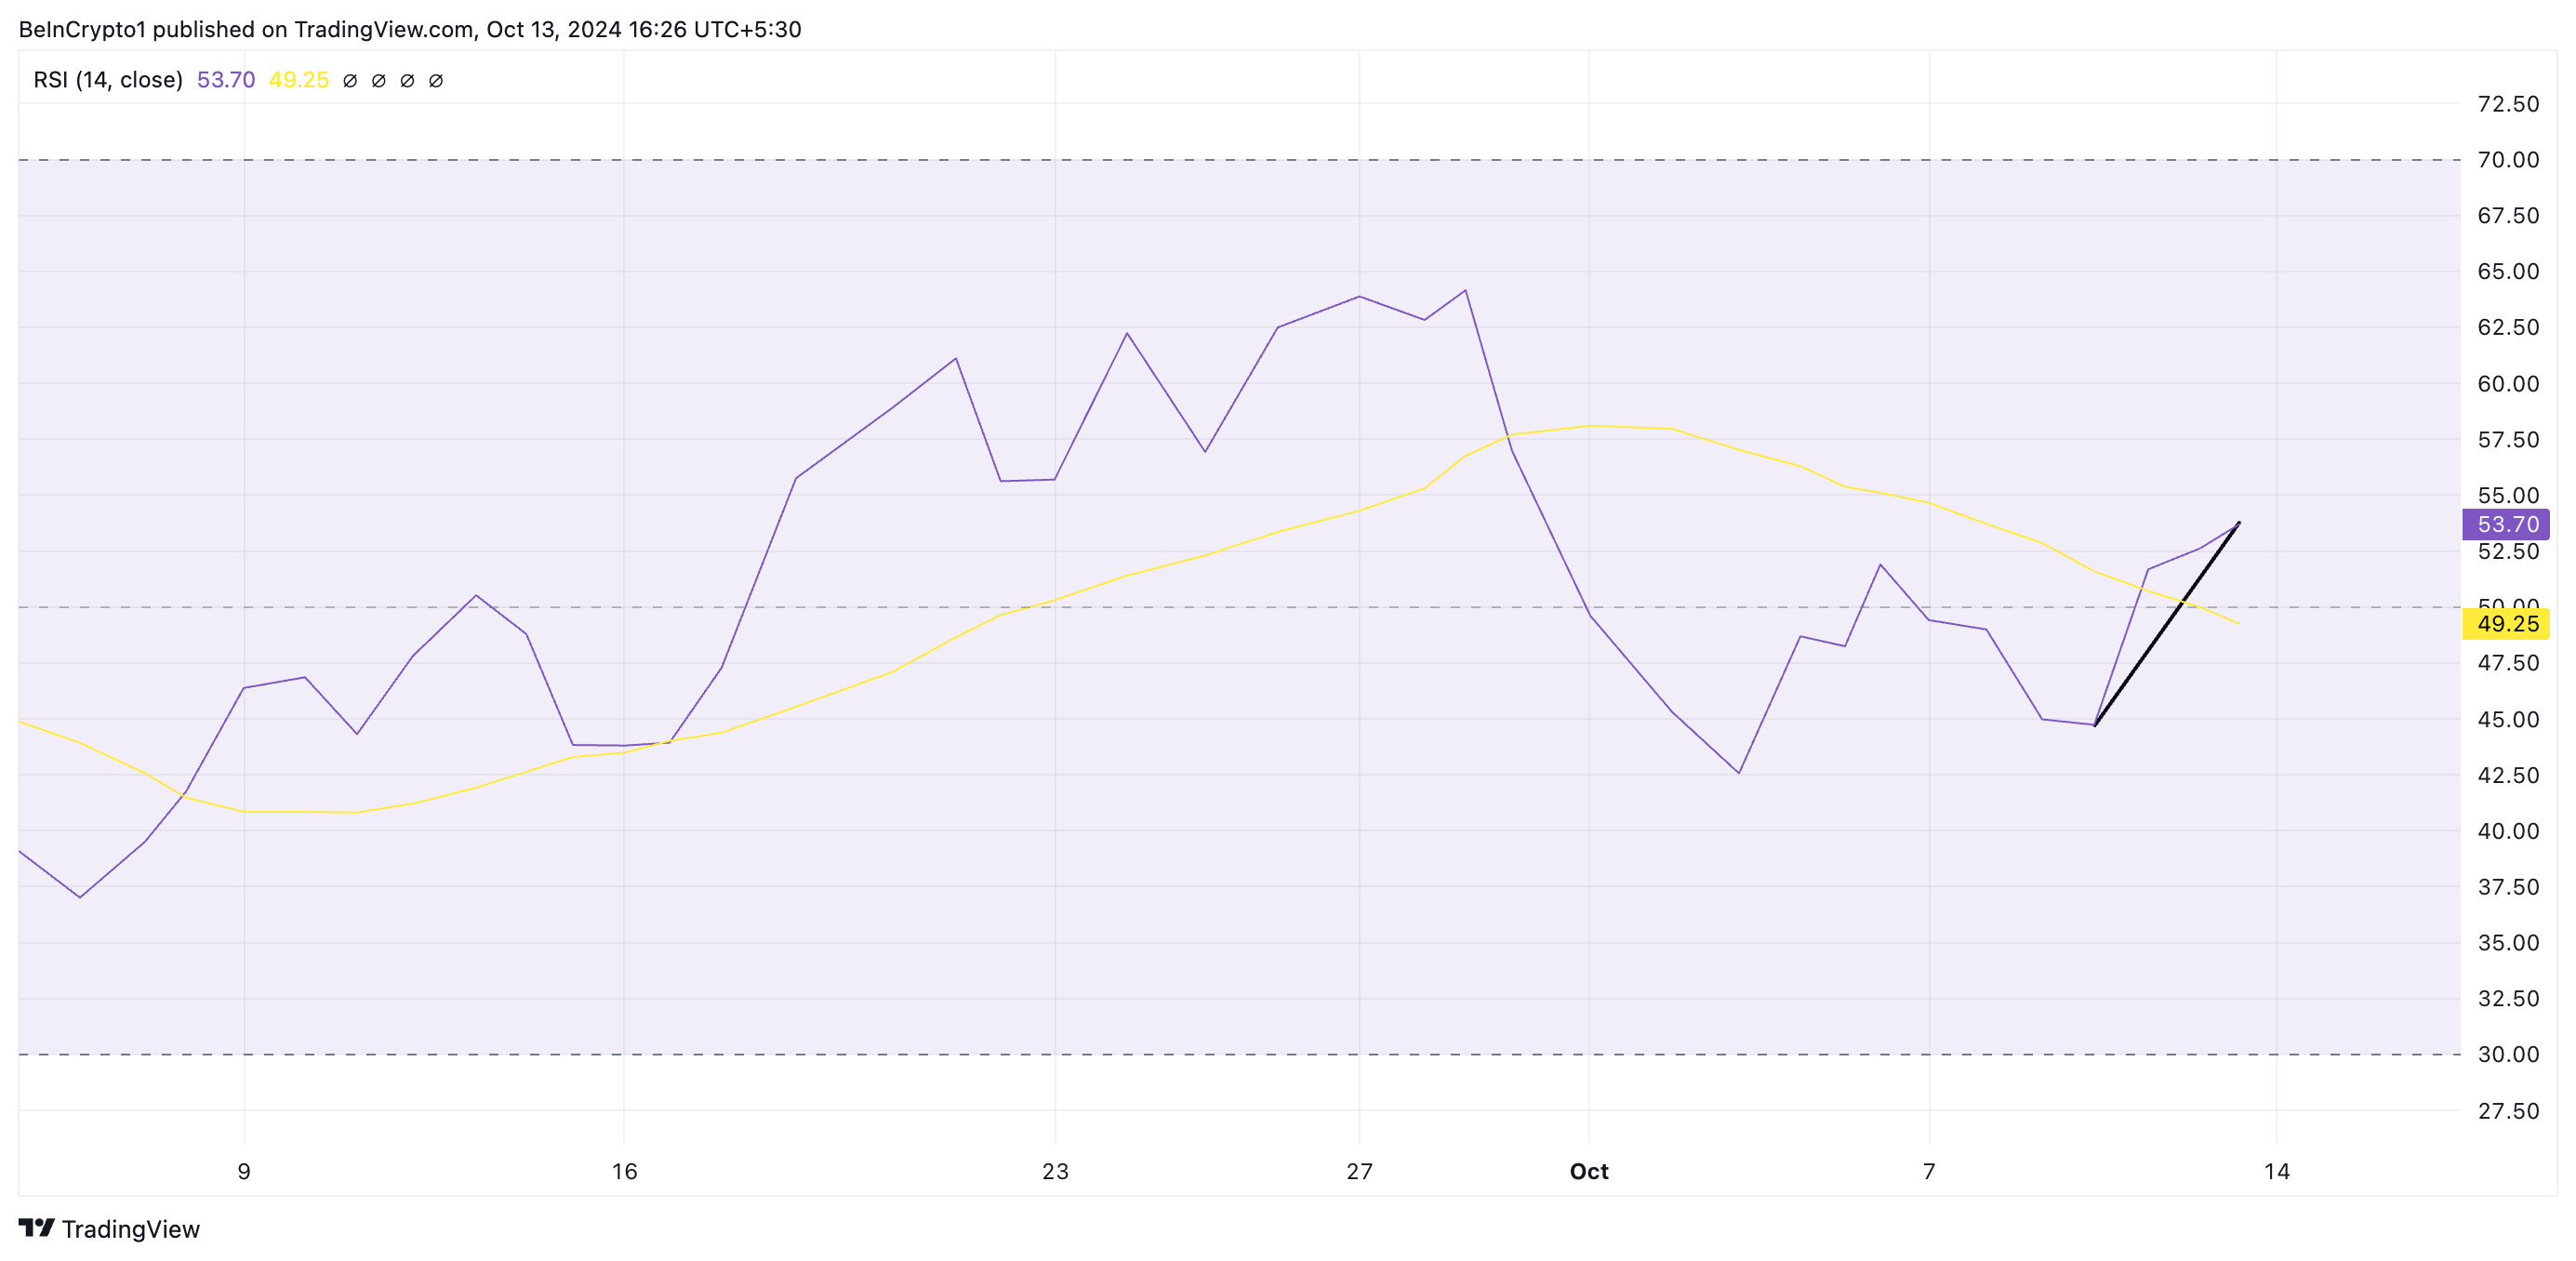
Solana RSI. Source: TradingView

Moreover, SOL’s positive Balance of Power (BoP) supports this bullish outlook. This indicator measures the strength of buyers versus sellers in the market. At press time, SOL’s BoP is 0.44, suggesting buyers are in control and attempting to push the price higher. 

Solana RSI. 
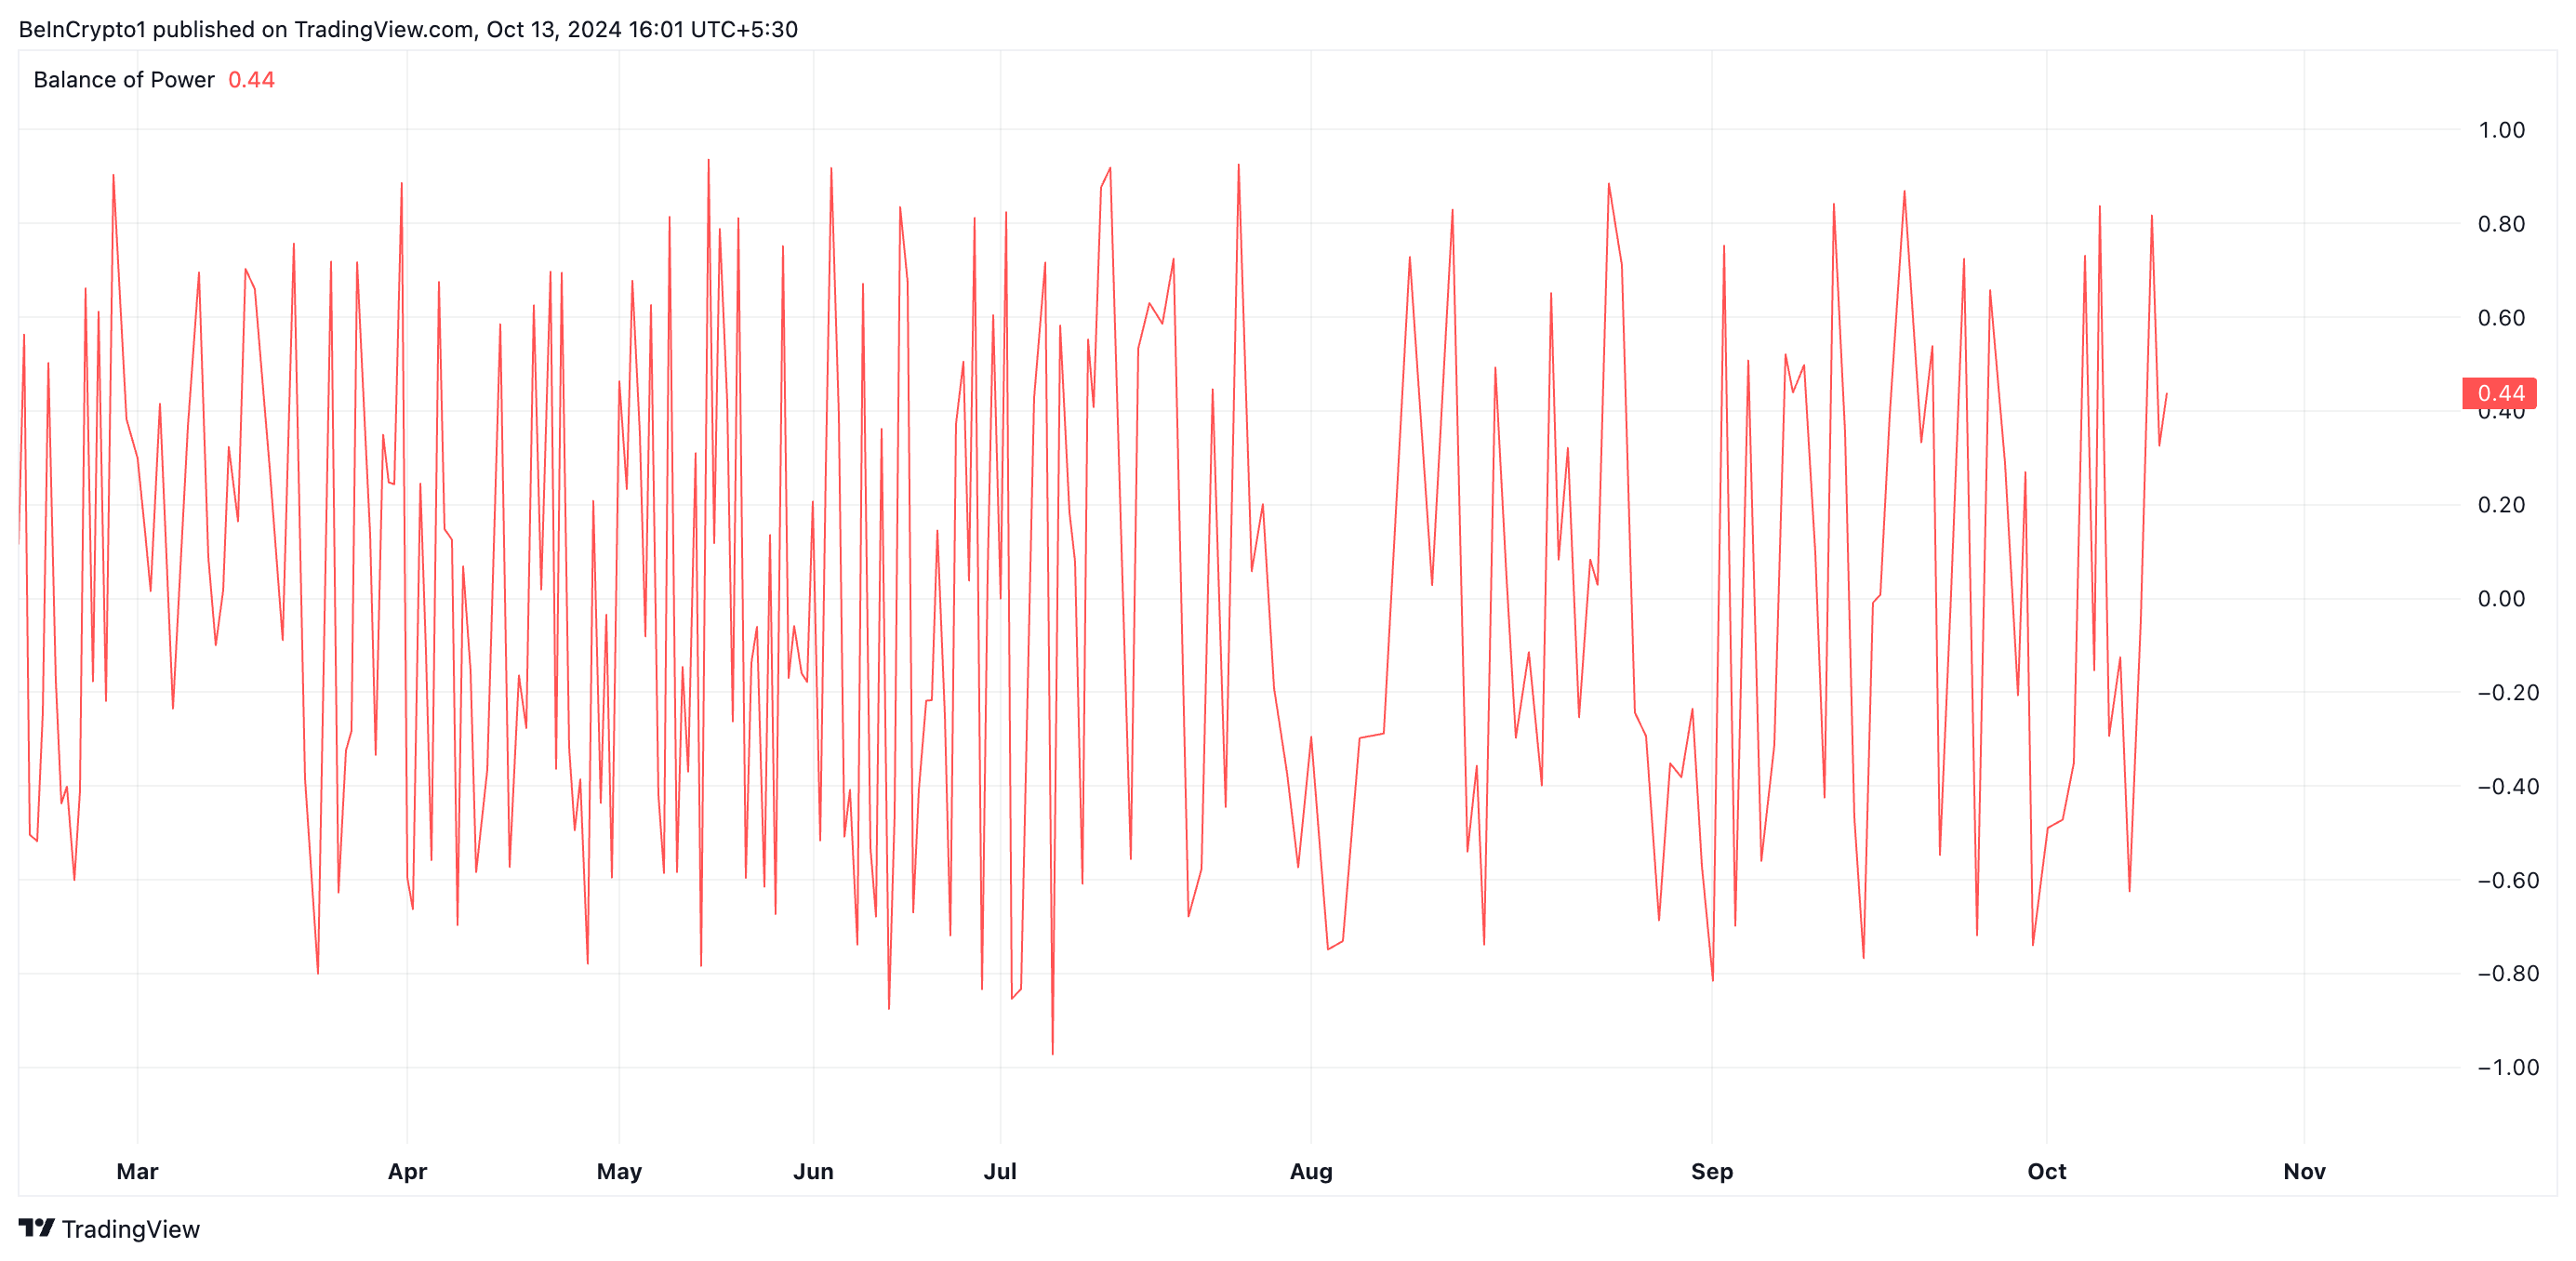
Solana BoP. Source: TradingView

SOL Price Prediction: A Succesful Retest Is Key

Solana is trading at $148.06, just below the resistance at $148.16. Since early August, this price level has seen significant selling pressure, with SOL attempting to break above it several times. Despite these efforts, each retest has failed to hold.

If the ongoing demand for SOL persists, the coin may rally beyond this resistance. A successful retest could trigger a surge toward $209.90, a high Solana’s price last reached in March.

Read more: Solana (SOL) Price Prediction 2024/2025/2030

Solana Price Analysis
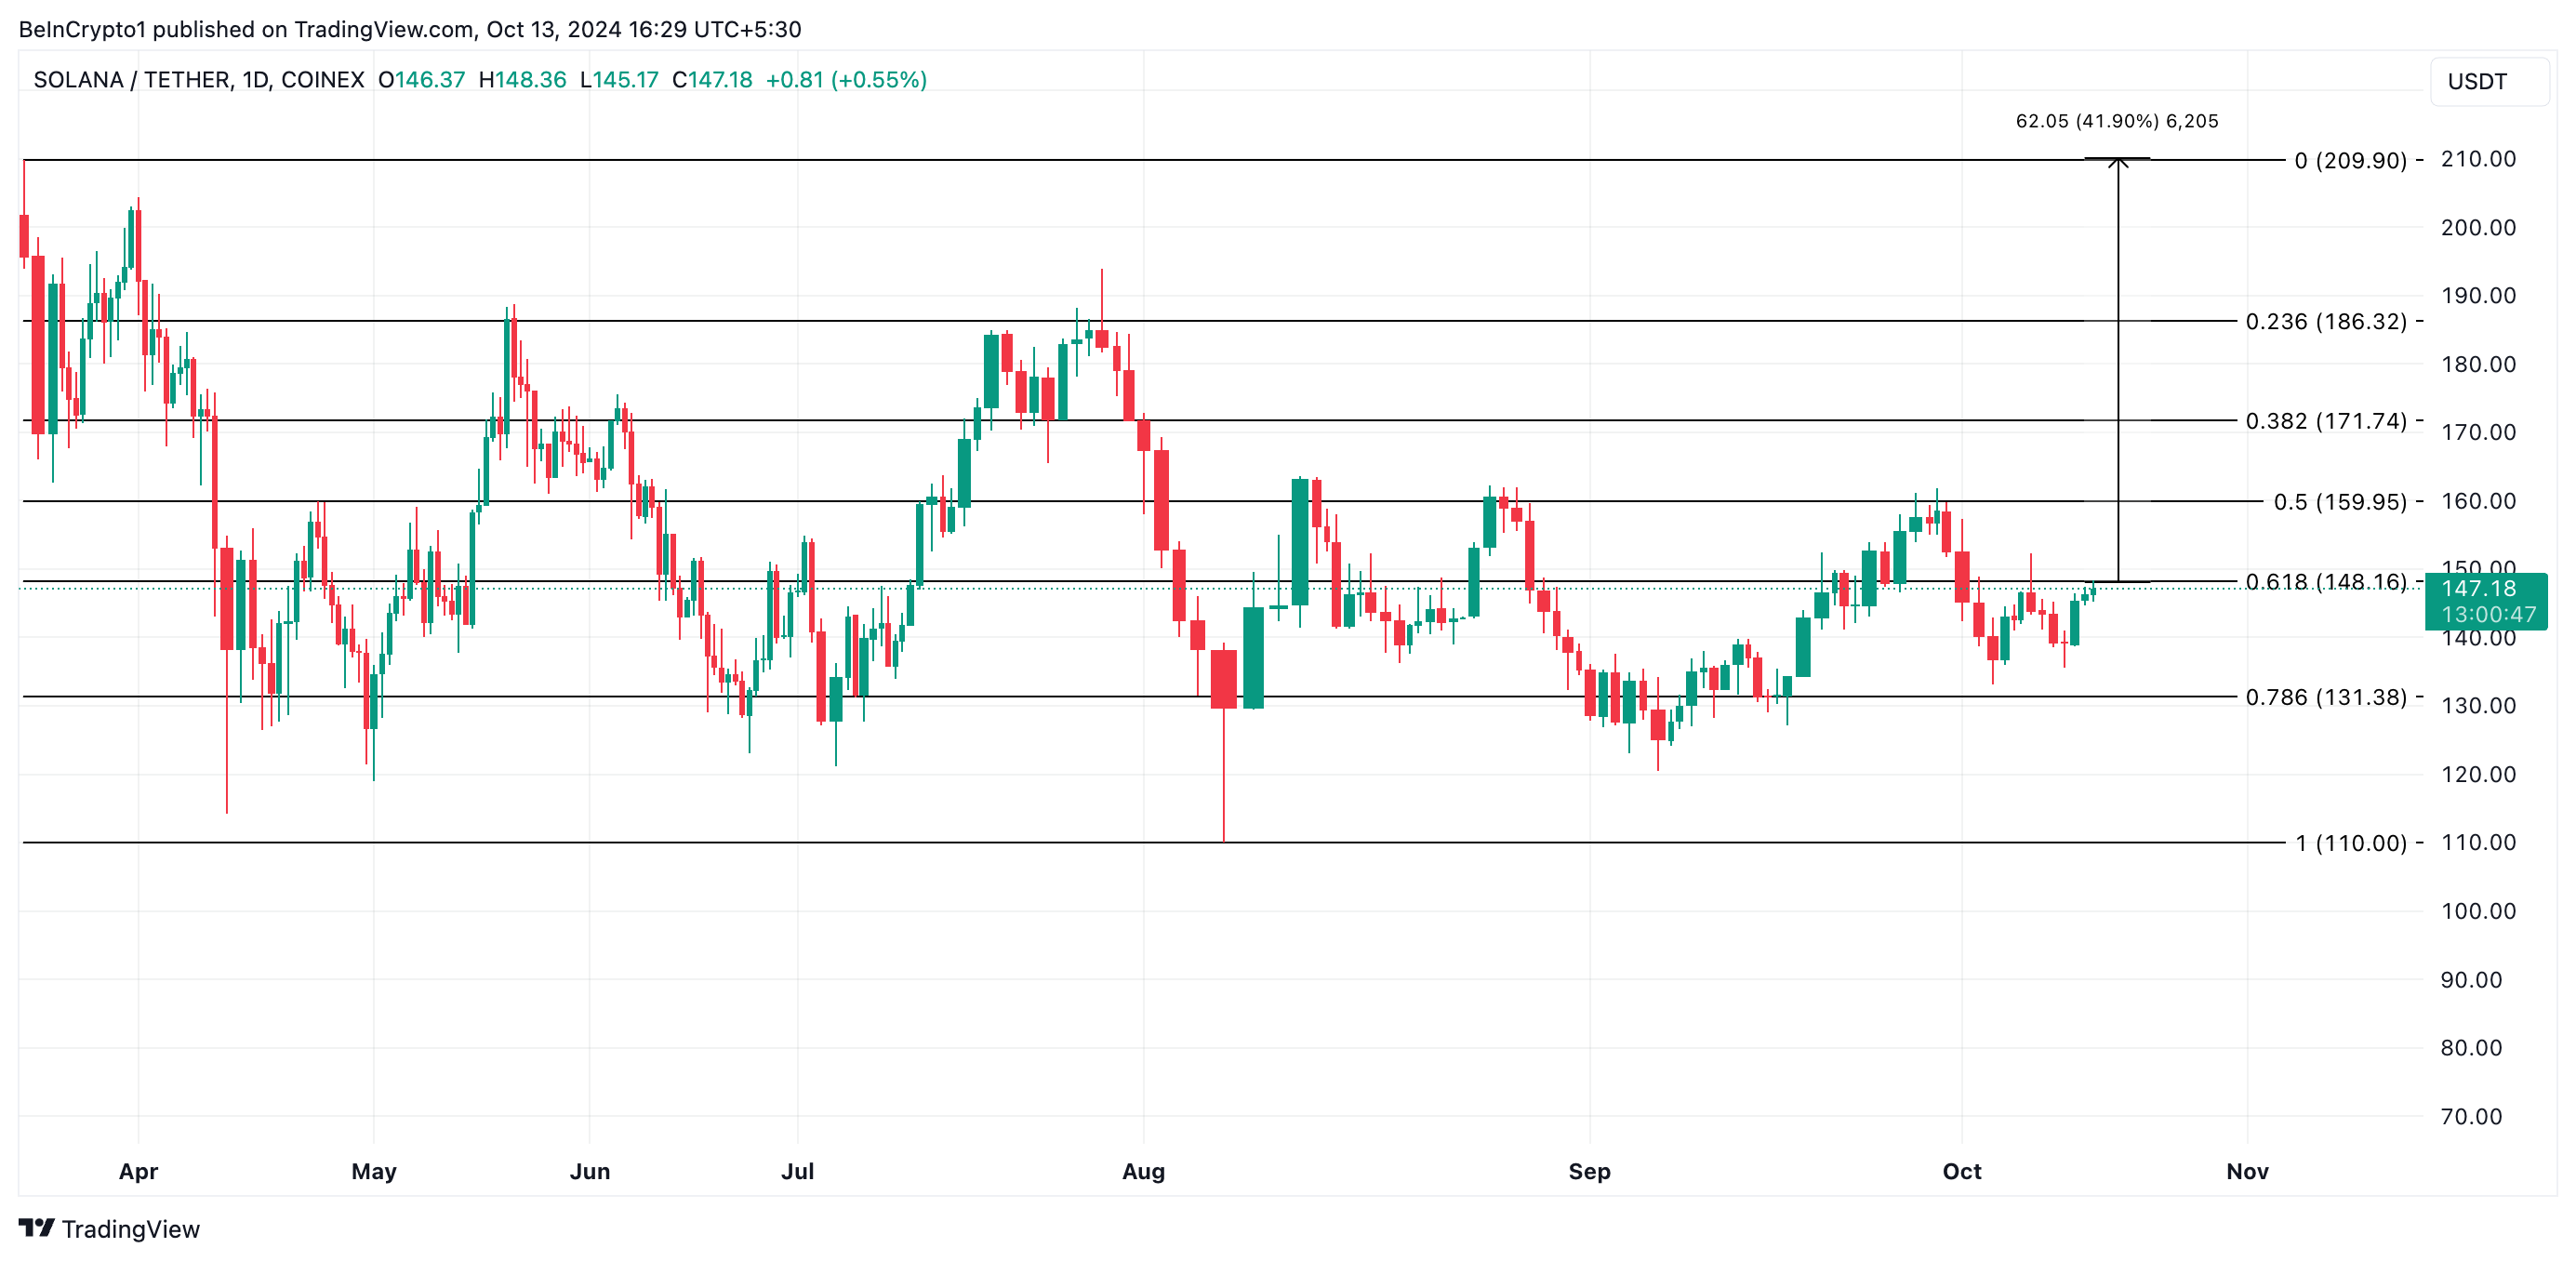
Solana Price Analysis. Source: TradingView

However, a failed retest of this resistance line could send Solana’s price plummeting toward $110.

Disclaimer: For information purposes only. Past performance is not indicative of future results.
placeholder
Gold price declines amid risk-on sentiment despite Fed rate cut expectationsGold price (XAU/USD) continues with its struggle to find acceptance above the $3,400 mark and attracts heavy selling during the Asian session on Monday.
Author  FXStreet
Aug 11, 2025
Gold price (XAU/USD) continues with its struggle to find acceptance above the $3,400 mark and attracts heavy selling during the Asian session on Monday.
placeholder
EUR/USD Price Forecast: Keeps bullish vibe above 1.1600 despite France’s deepening political crisisThe EUR/USD pair loses ground to near 1.1620 during the early European session on Monday.
Author  FXStreet
Oct 27, 2025
The EUR/USD pair loses ground to near 1.1620 during the early European session on Monday.
placeholder
ECB Policy Outlook for 2026: What It Could Mean for the Euro’s Next MoveWith the ECB likely holding rates steady at 2.15% and the Fed potentially extending cuts into 2026, EUR/USD may test 1.20 if Eurozone growth proves resilient, but weaker growth and an ECB pivot could pull the pair back toward 1.13 and potentially 1.10.
Author  Mitrade
Dec 26, 2025
With the ECB likely holding rates steady at 2.15% and the Fed potentially extending cuts into 2026, EUR/USD may test 1.20 if Eurozone growth proves resilient, but weaker growth and an ECB pivot could pull the pair back toward 1.13 and potentially 1.10.
placeholder
Gold plummets below $4,200 as US‑Iran tensions spur hawkish rate bets ahead of US CPIGold (XAU/USD) extends the recent breakdown momentum below a technically significant 200-day Simple Moving Average (SMA) and drops to a fresh low since March 23, further below the $4,200 mark during the Asian session on Wednesday.
Author  FXStreet
Yesterday 08: 26
Gold (XAU/USD) extends the recent breakdown momentum below a technically significant 200-day Simple Moving Average (SMA) and drops to a fresh low since March 23, further below the $4,200 mark during the Asian session on Wednesday.
placeholder
BTC Hovers Near 60,000 Mark After Plunge. US May CPI Set to Be Revealed, How Is Wall Street Betting?Bitcoin's rebound falters as the U.S.-Iran conflict and CPI data likely sustain downward pressure.On June 10, escalating U.S.-Iran tensions put the already fragile crypto market to the te
Author  TradingKey
Yesterday 09: 57
Bitcoin's rebound falters as the U.S.-Iran conflict and CPI data likely sustain downward pressure.On June 10, escalating U.S.-Iran tensions put the already fragile crypto market to the te
goTop
quote