

Bitcoin On The Brink: Will $60K Hold Or Is A Major Correction Coming?

Source Newsbtc

After briefly rising above $63,000 in recent days, renewing investor’s hope on “uptober,” Bitcoin has once again dampened this excitement by decreasing to as low as the $60,000 region today.

This unappealing performance has led to a CryptoQuant analyst, Aytekin, raising and sharing insight on an important question: “Is it reasonable to expect a final shakeout before the next big move?”

Bitcoin Next Move: Major Correction Looming?

In a recent post on the CryptoQuant QuickTake platform, the analyst explained that Bitcoin is currently in a high open interest zone, having exceeded the critical $18 billion level. Historically, when open interest levels reached this point, major corrections followed.

Bitcoin open interest.

The analyst mentioned that the current market sentiment appears divided, noting:

The market seems indecisive in many aspects, with some believing that the next big upside move is on the horizon, while others think BTC’s downward trend remains strong. A common belief is that BTC may need a final shakeout before surging to a new all-time high (ATH).

Aytekin added that funding rates, though slightly above the 200-day simple moving average (SMA), suggest that long traders are still dominant. However, significant price corrections in the past often occurred when funding rates turned negative, which hasn’t happened yet.

Bitcoin funding rates.

Aytekin concluded that, while a final shakeout might occur, the depth of the correction may not be as severe given the relatively moderate funding rates.

BTC Price Outlook

As Bitcoin has struggled to break through key resistance levels, its recent price action reflects ongoing market indecision. Over the past few weeks, Bitcoin maintained stability above the $60,000 mark, but failed to make a major move to reclaim $70,000.

In the past 24 hours, Bitcoin has slipped by 2.9%, currently trading at $60,485. This decline follows the asset’s brief surge to $63,774 earlier in the week, which sparked optimism for a possible move toward the $65,000 and then $70,000 mark.

Bitcoin (BTC) price chart on TradingView

Prominent crypto analyst Ali recently commented on Bitcoin’s price action, noting that Bitcoin is still trading within a “descending parallel channel.”
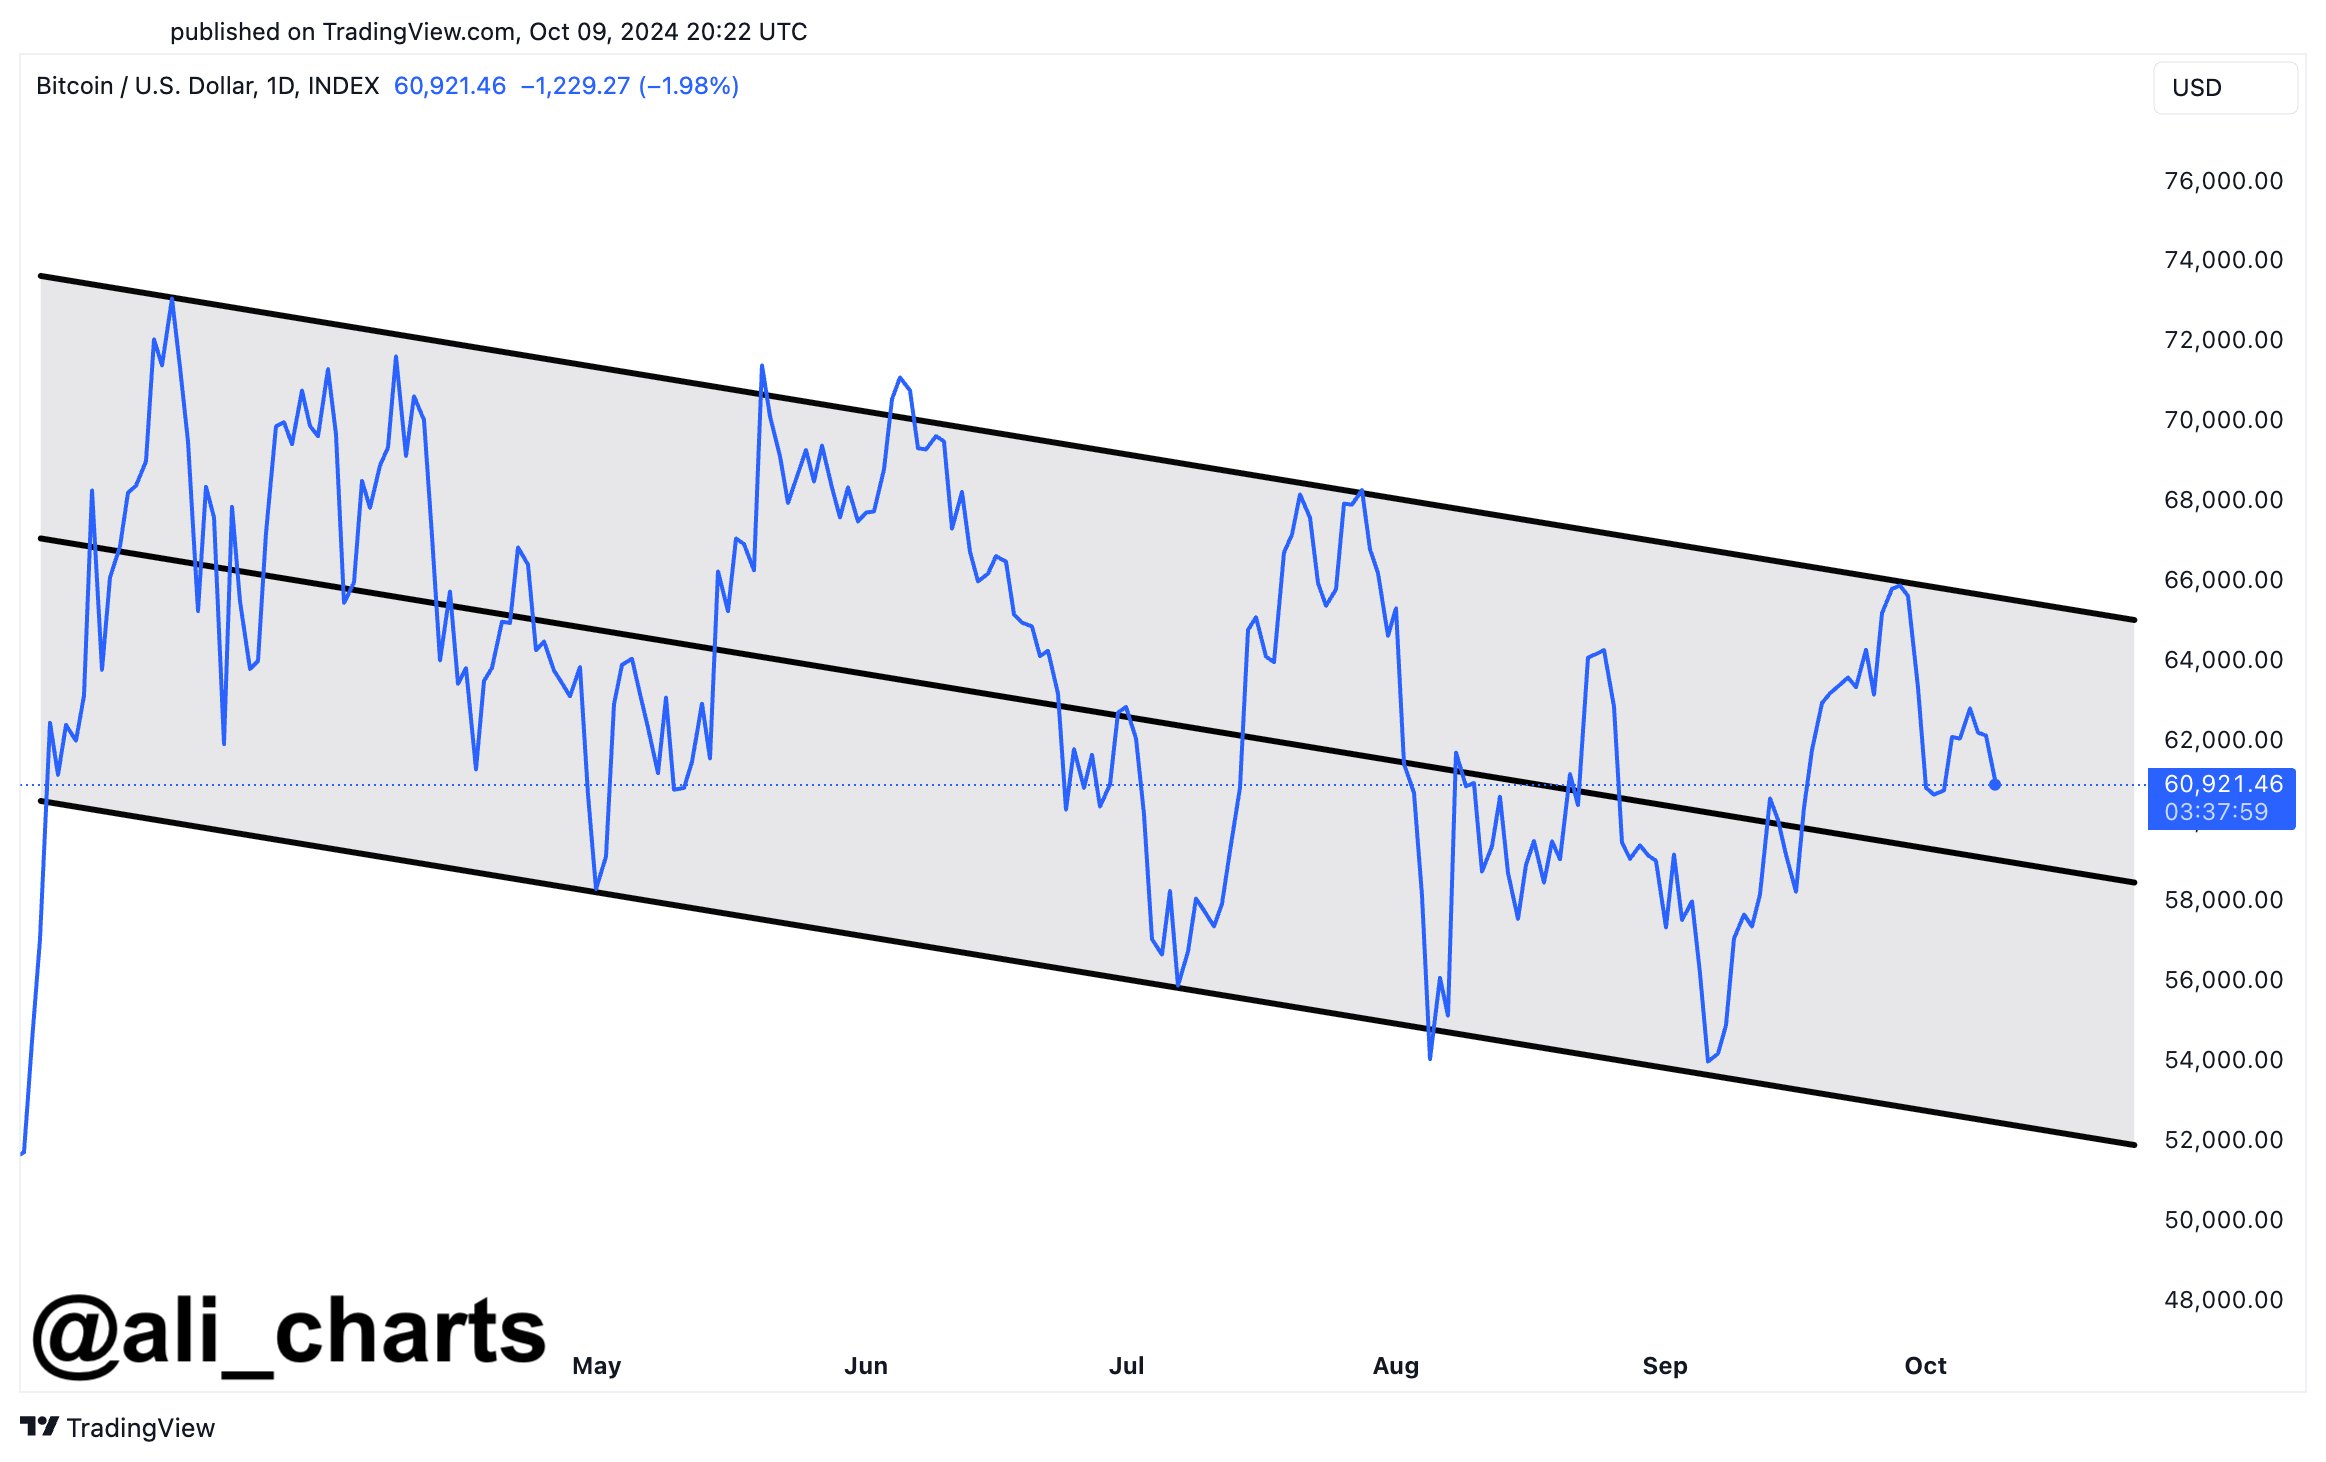
Bitcoin trading within descending parallel channel.

According to Ali, the asset was rejected at the upper boundary of this channel, signalling the potential for further downside. “We might see a drop to the middle boundary at $58,000 or even the lower boundary at $52,000,” Ali noted in a post on X.

He emphasized that a bullish breakout is unlikely unless Bitcoin clears the $66,000 level, a price point that has acted as a significant resistance point in recent weeks.

Featured image created with DALL-E, Chart from TradingView

Disclaimer: For information purposes only. Past performance is not indicative of future results.
placeholder
US dollar clings to nine-week lows near 98.4 as Brent nears $100 and the yen hits a seven-month high — five events to watch todayThe dollar is pinned near nine-week lows even after a blockbuster jobs report, as an oil spike toward $100, a surging yen and China's reflation data crowd the driver's seat. Five key events to watch today: Brent at $99.46, USD/JPY at 154, China CPI/PPI, PBOC gold buying, and Thursday's PPI / Friday's CPI ahead of the September 15-16 FOMC.
Author  Eric Nkando
Sep 09, Wed
The dollar is pinned near nine-week lows even after a blockbuster jobs report, as an oil spike toward $100, a surging yen and China's reflation data crowd the driver's seat. Five key events to watch today: Brent at $99.46, USD/JPY at 154, China CPI/PPI, PBOC gold buying, and Thursday's PPI / Friday's CPI ahead of the September 15-16 FOMC.
placeholder
US August CPI lands tonight: after a 5.4% PPI shock, will the Fed hike on September 16?US August PPI came in at 5.4% year-on-year, above the 5.3% consensus, with core PPI at 4.6%. Traders have pushed the odds of a 25bp Fed hike on September 15-16 to around 70%. Tonight's CPI is the last major inflation print before the decision — here is the full calendar, the consensus numbers, and what a hot versus cool reading would mean for the dollar, yields, gold and stocks.
Author  Irene Q.
Sep 11, Fri
US August PPI came in at 5.4% year-on-year, above the 5.3% consensus, with core PPI at 4.6%. Traders have pushed the odds of a 25bp Fed hike on September 15-16 to around 70%. Tonight's CPI is the last major inflation print before the decision — here is the full calendar, the consensus numbers, and what a hot versus cool reading would mean for the dollar, yields, gold and stocks.
placeholder
Brent tests $108 as a key export pipeline stays shut — can the rally clear $110?Brent crude rose 2.55% to $106.97 and WTI 2.32% to $102.30 as a major regional export pipeline remained offline with no restart timeline. Front-month backwardation has widened to $5.53 from $3.84 a week ago, European gas is at its highest since December 2022, and one analyst sees $119.48 if talks stall.
Author  Irene Q.
21 hours ago
Brent crude rose 2.55% to $106.97 and WTI 2.32% to $102.30 as a major regional export pipeline remained offline with no restart timeline. Front-month backwardation has widened to $5.53 from $3.84 a week ago, European gas is at its highest since December 2022, and one analyst sees $119.48 if talks stall.
placeholder
Fed hike odds near 90% into Wednesday's decision — how to trade the dollar, gold and the S&P 500A 0.3% monthly core CPI print has lifted the market-implied probability of a 25bp Fed hike on 16 September to roughly 86.5% ~ 90%, which would be the first increase since July 2023. Here is the decision timeline, the pricing versus the forecasts, both scenarios, and the key levels for the dollar, gold and the S&P 500.
Author  Suzie
21 hours ago
A 0.3% monthly core CPI print has lifted the market-implied probability of a 25bp Fed hike on 16 September to roughly 86.5% ~ 90%, which would be the first increase since July 2023. Here is the decision timeline, the pricing versus the forecasts, both scenarios, and the key levels for the dollar, gold and the S&P 500.
placeholder
Silver Price Forecast: XAG/USD falls to near $63.50 amid Fed hike bets, higher oil pricesSilver price (XAG/USD) loses its gains from the previous day, trading around $63.50 per troy ounce during Asian hours on Monday. Non-yielding Silver is currently facing significant headwinds driven by rising Federal Reserve (Fed) rate-hike expectations for the upcoming September decision.
Author  FXStreet
18 hours ago
Silver price (XAG/USD) loses its gains from the previous day, trading around $63.50 per troy ounce during Asian hours on Monday. Non-yielding Silver is currently facing significant headwinds driven by rising Federal Reserve (Fed) rate-hike expectations for the upcoming September decision.
goTop
quote