

XRP Price Could Crash 15% After 32 Million Tokens Flood Exchange
Since the start of the month, Ripple’s (XRP) price has dropped nearly 18%, falling from $0.64 to $0.53. While investors may be hoping for a rebound, market sentiment remains fragile, signaling that recovery might not be imminent.
Instead, on-chain analysis reveals that XRP price may continue to face further declines. Here are the reasons.
Ripple Holders Count Their Losses
According to CryptoQuant, XRP risks falling below its current price due to an increase in exchange inflows. On October 9, data from the analytics platform revealed that the number of tokens sent to exchanges had reached 32.36 million.
Exchange inflow tracks the number of tokens sent from external wallets into centralized platforms. In most cases, sending tokens into exchanges implies that investors are not willing to HODL.
Assuming the exchange inflow decreases, this would be a bullish sign that could precede a price rally. Therefore, the influx of tokens suggests that a significant sell-off could be imminent, putting downward pressure on XRP’s price.
Read more: How to Buy XRP and Everything You Need To Know
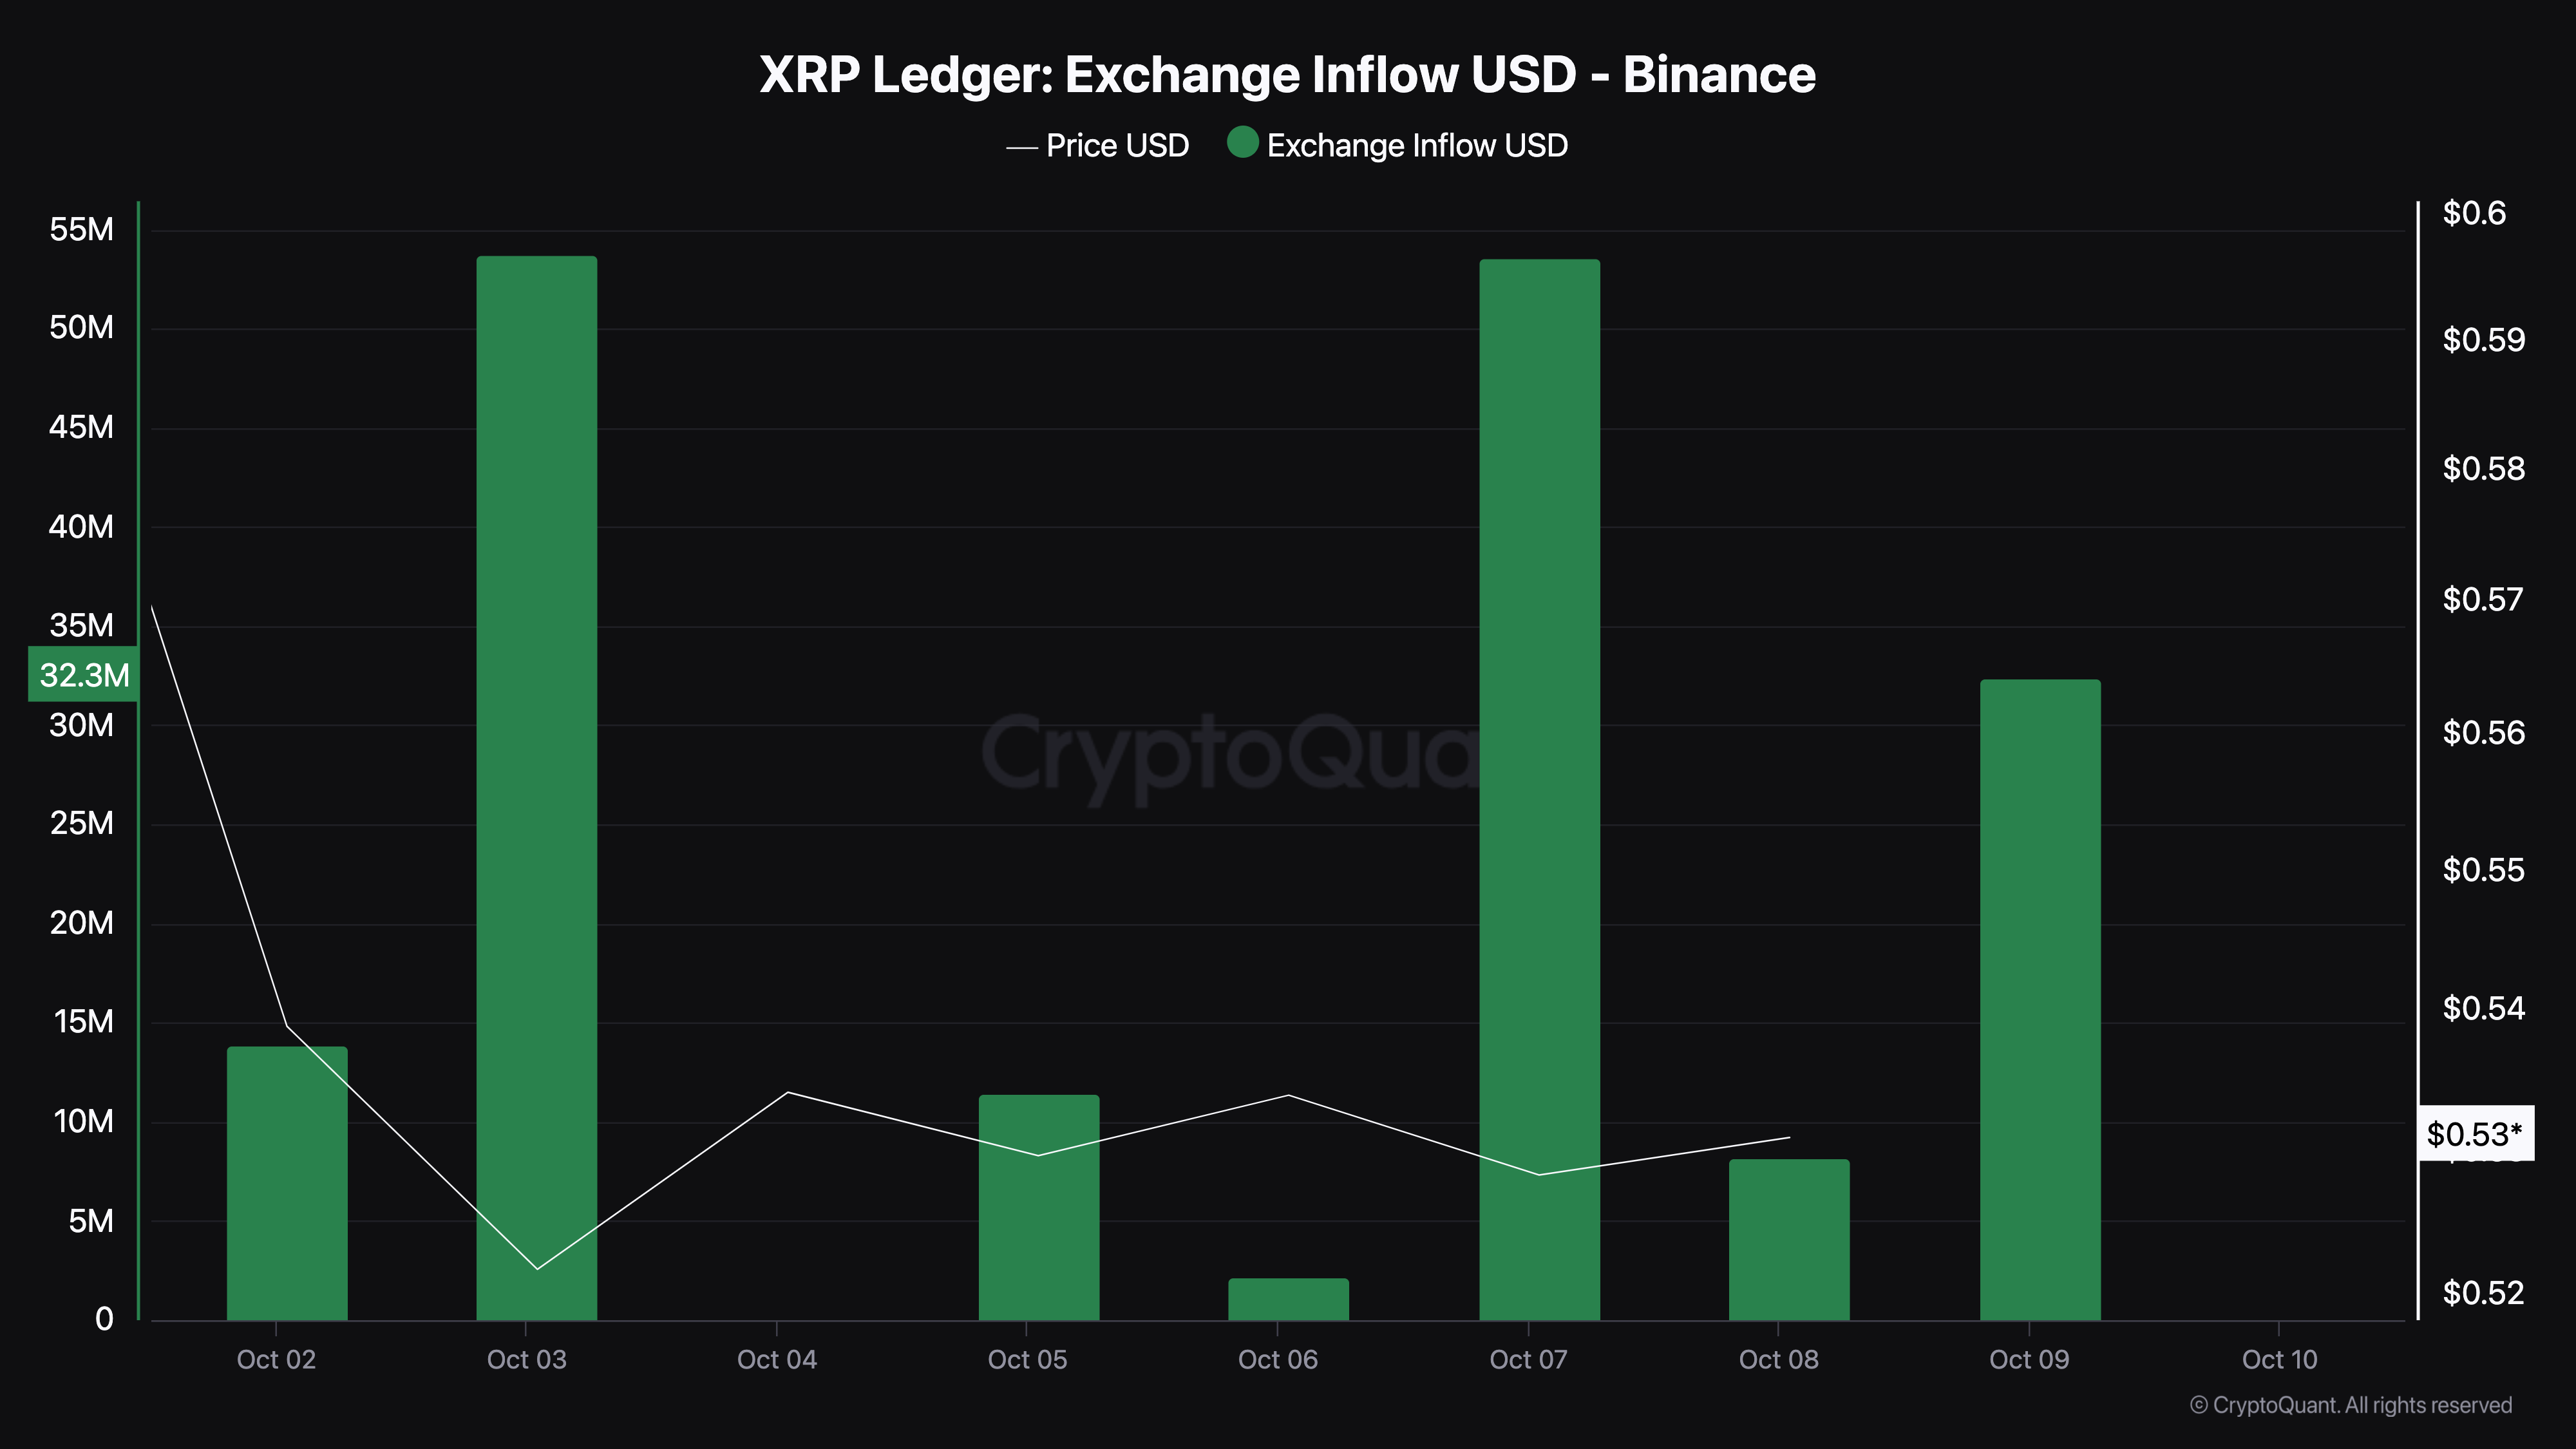 XRP Exchange Inflow. Source: CryptoQuant
The Realized Cap is another metric that reinforces this basis. This metric measures the value of a cryptocurrency by gauging how long they have been moved or unmoved.
An increase in Realized Cap typically signals that coins were sold at higher prices than they were bought. However, in XRP’s case, the Realized Cap is decreasing. This decline suggests that investors who purchased XRP at higher prices are now exiting their positions at a loss.
Due to this, potential investors who are willing to buy might be discouraged, possibly leading to lower re-pricing for the cryptocurrency.
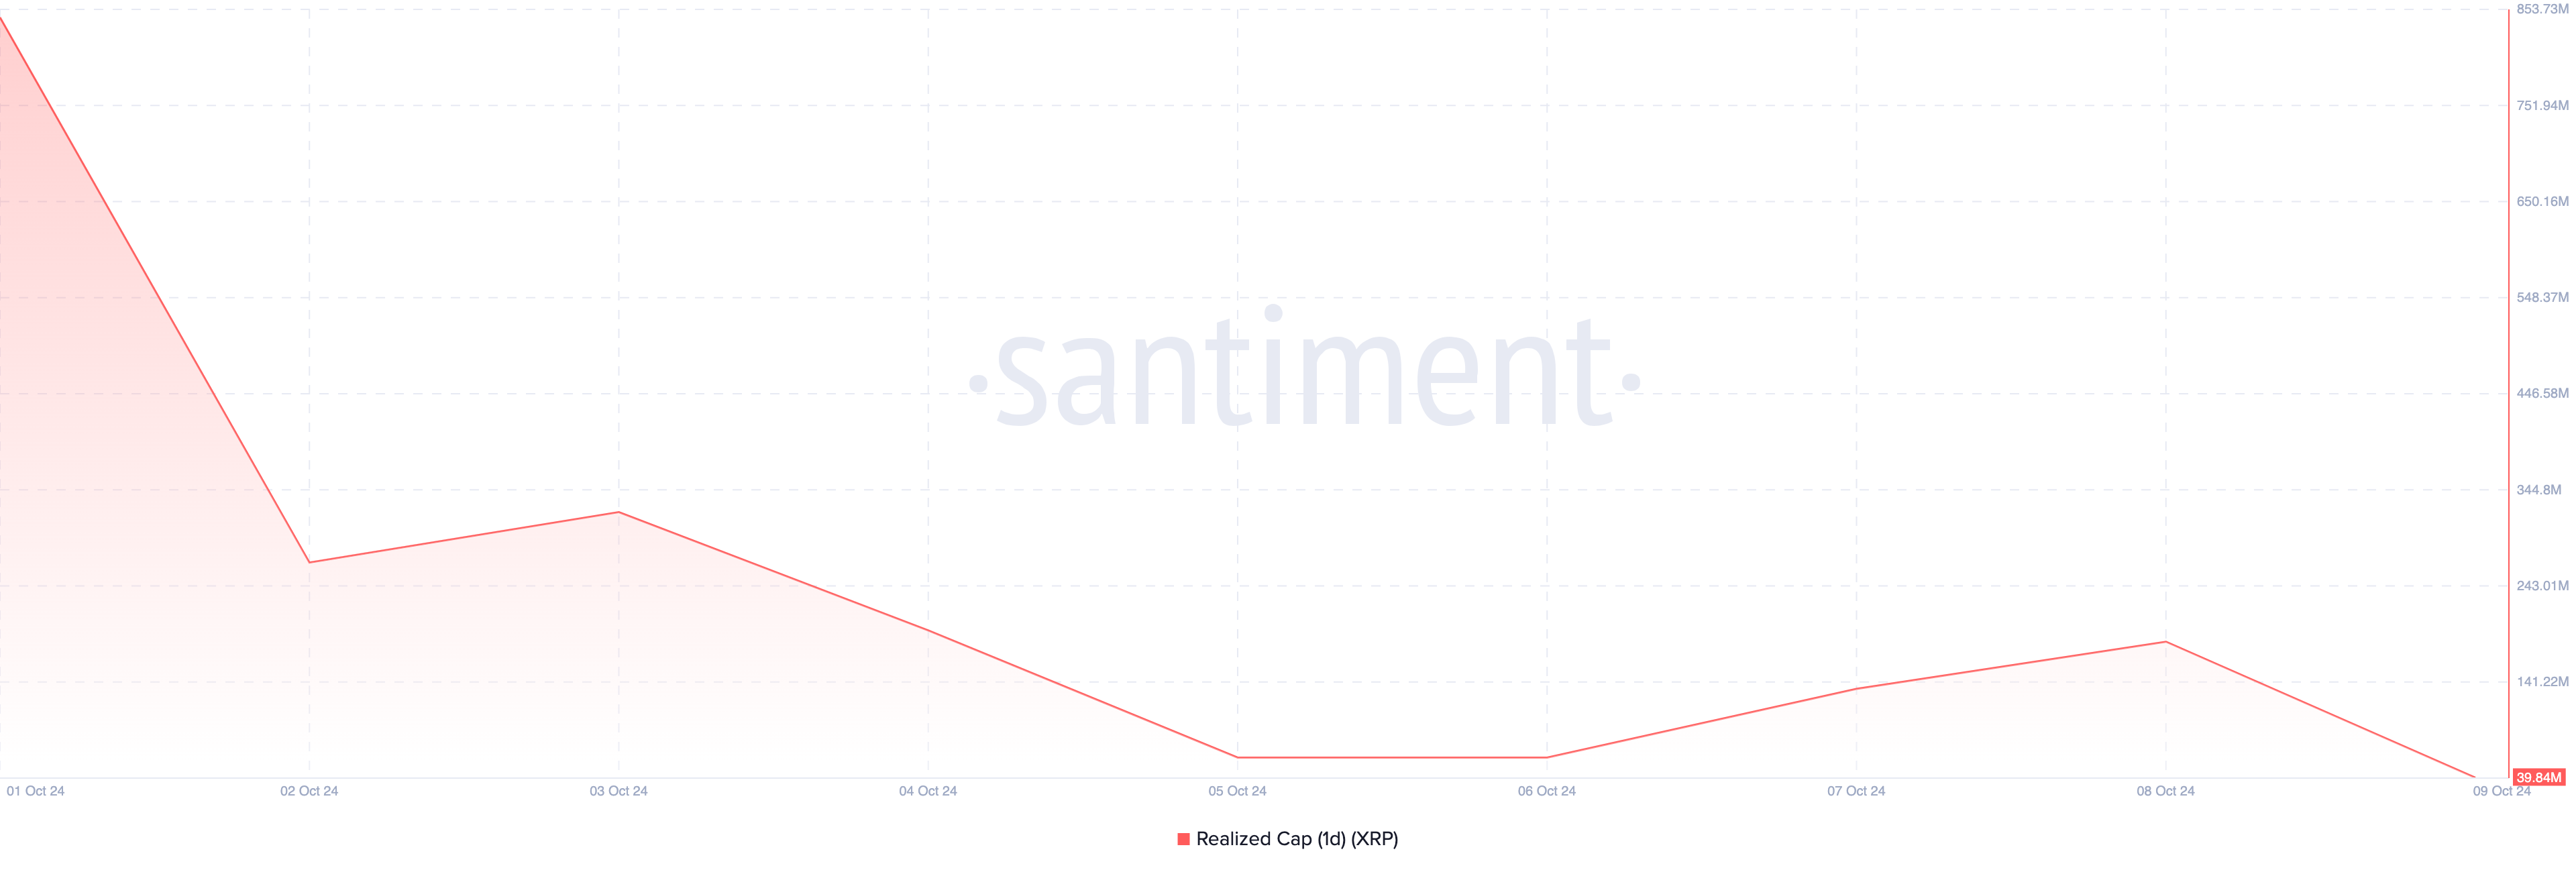 XRP Realized Cap. Source: Santiment
XRP Price Prediction: Token Eyes $0.45
An assessment of the daily chart shows that XRP’s price is close to the critical support threshold at $0.52. However, the token remains below the 20-day Exponential Moving Average (EMA). The 20 EMA (blue) is a technical indicator that measures a cryptocurrency’s short-term trend.
When the price is above this indicator, the trend is bullish. But since XRP is below it, the token’s value could continue trending downward. In addition, the Moving Average Convergence Divergence (MACD) is negative.
The MACD is a technical oscillator primarily used to determine momentum. When the reading is positive, momentum is bullish. But since it is negative for XRP, the momentum around the cryptocurrency is bearish.
Read more: XRP ETF Explained: What It Is and How It Works
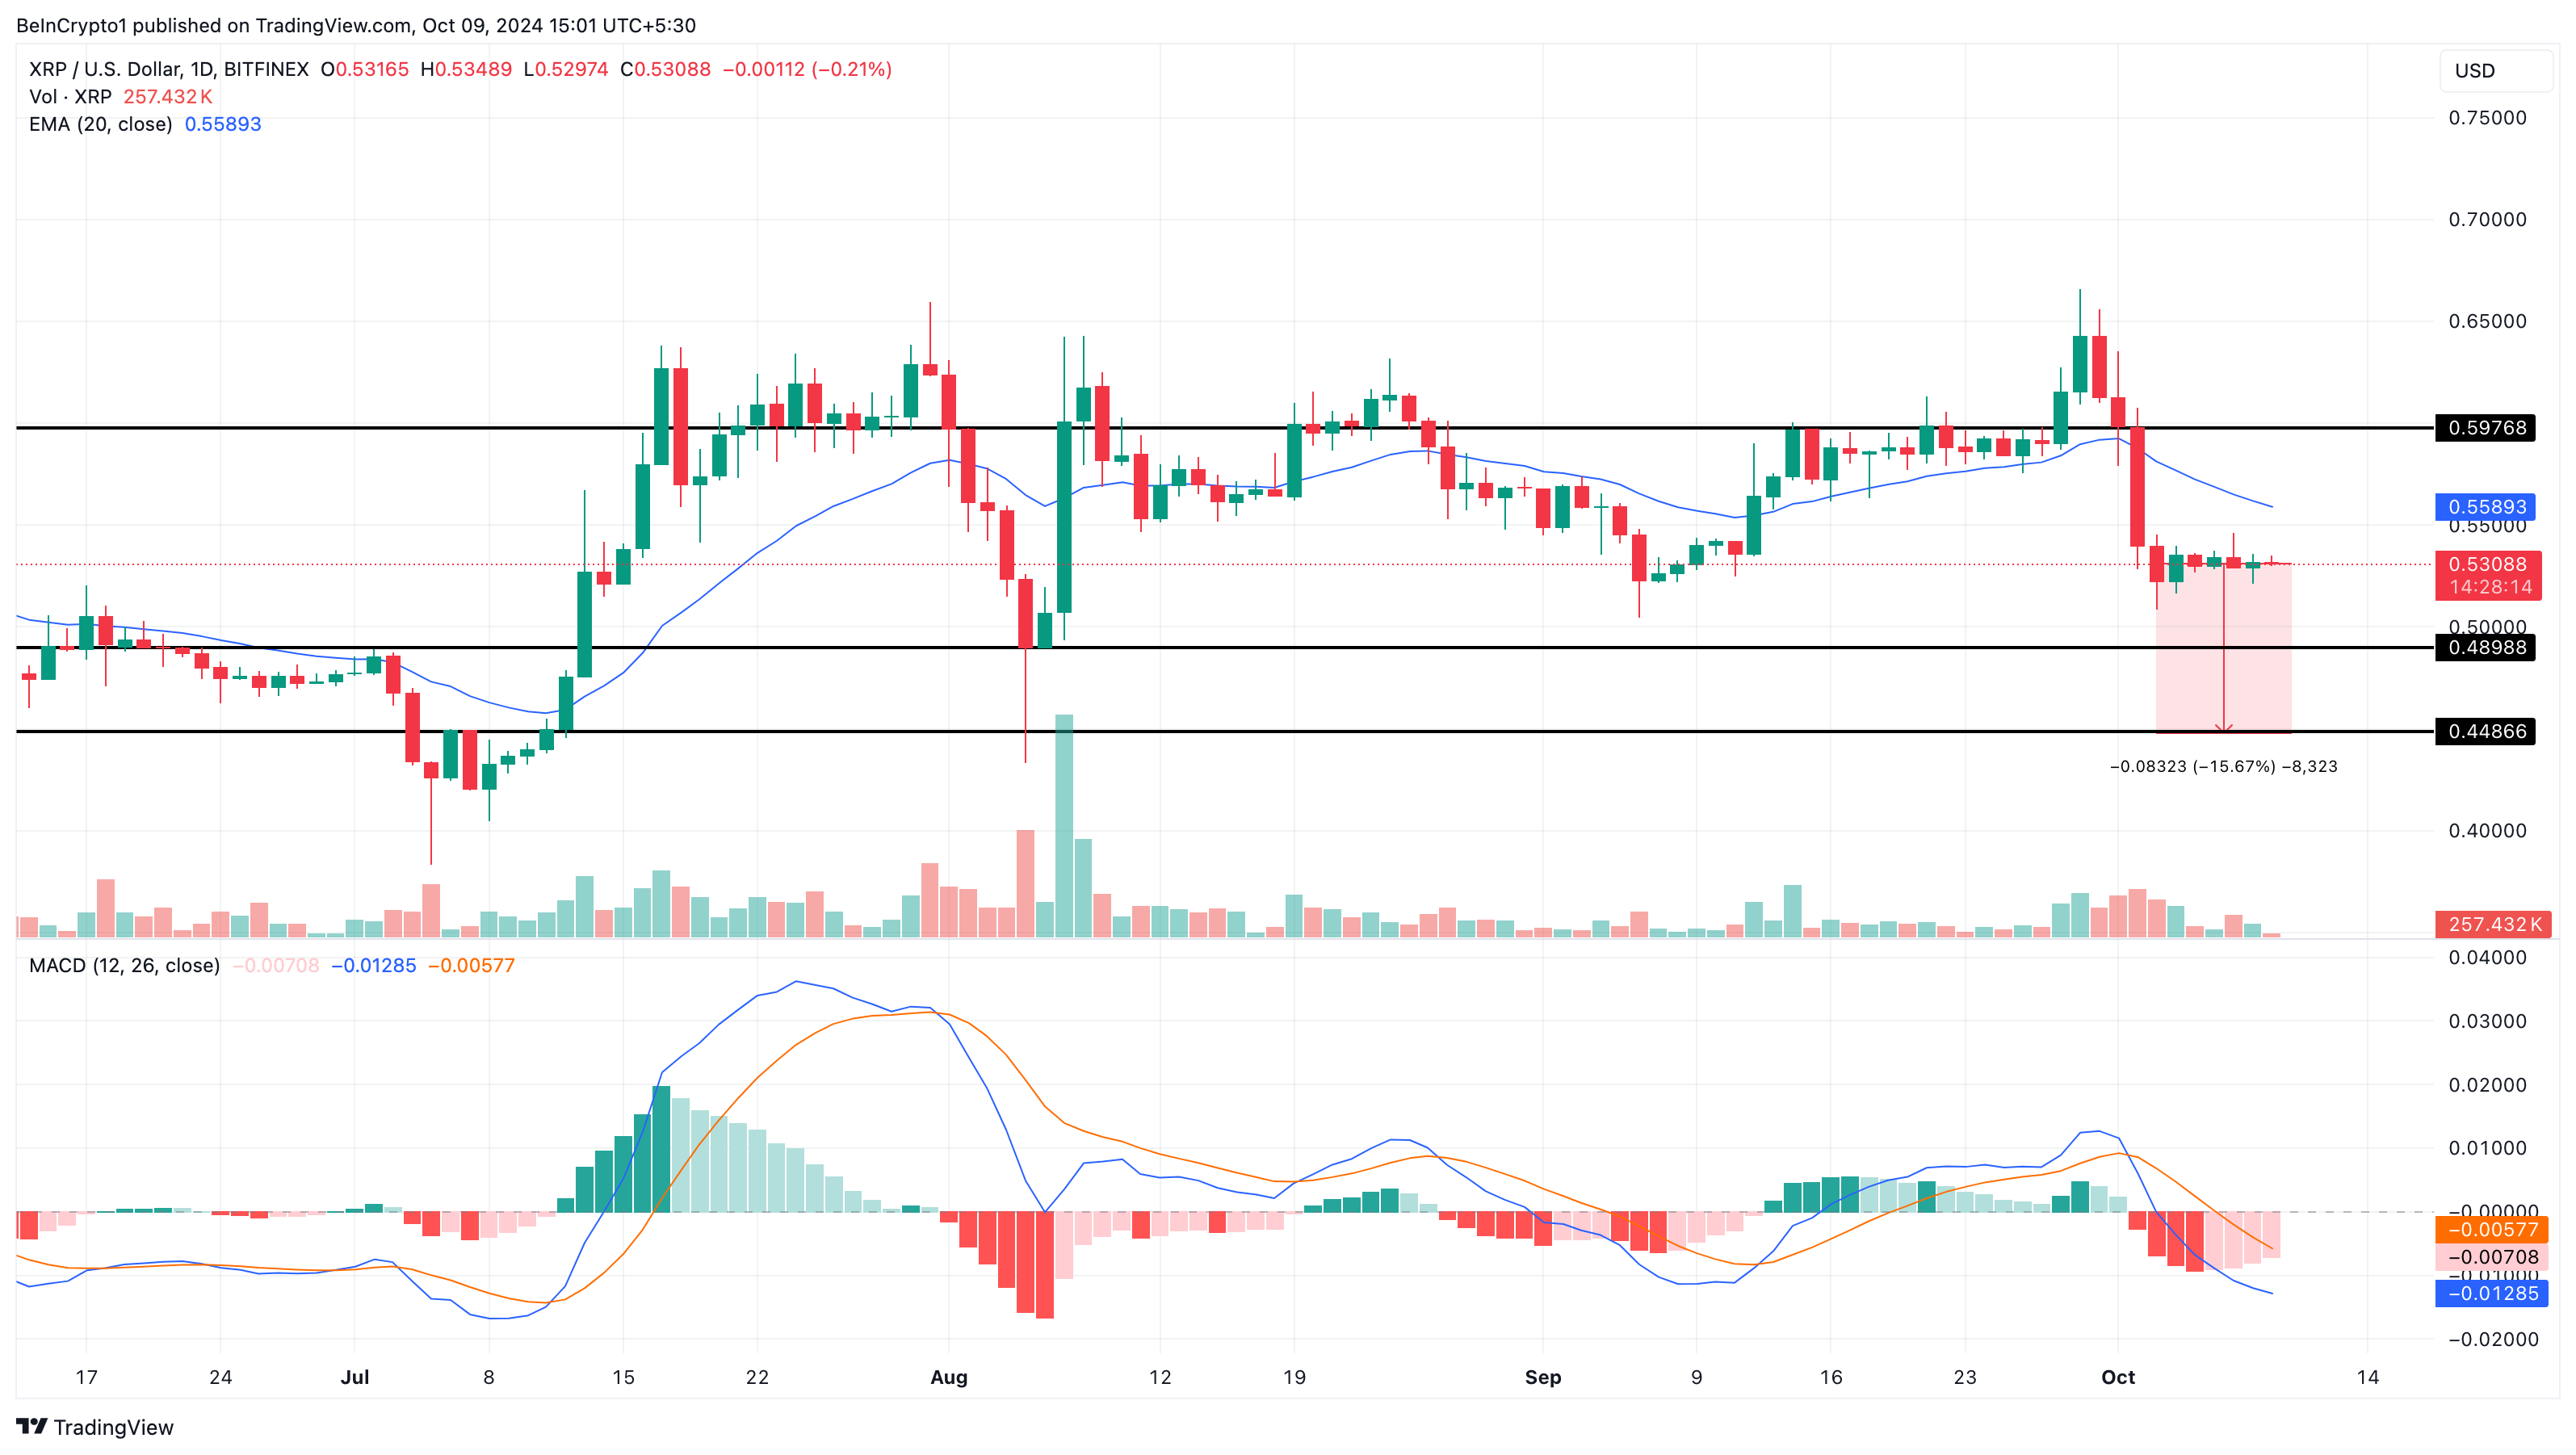 XRP Daily Price Analysis. Source: TradingView
As it stands, XRP’s price is likely to drop below $0.49 and possibly decline by 15% to reach $0.45. Meanwhile, the token might rebound if the bulls prevent it from falling below the $0.52 support.
Another factor that could influence recovery is the market reaction to the rising XRP ETF application. While the response to the latest filing remains lacked vigor, an additional one could change things. In that scenario, XRP could jump to $0.60.
Recommended Articles


