Moo Deng Price Crashes 60% in a Week Due to This Reason

Source Beincrypto

Moo Deng (MOODENG) price witnessed an impressive rally throughout September, becoming a must-watch token in the crypto space. However, towards the end of the month, the altcoin’s fortunes turned, and it began a steep decline. 

As of this week, Moo Deng has become one of the biggest losers, with its price crashing by nearly 60%. Investors are now left wondering what led to this drastic drop.

Moo Deng Investors’ Mood Has Been Ruined

The market sentiment for Moo Deng has shifted sharply. After reaching an all-time high of $0.355, investor optimism quickly faded. The weighted sentiment, which gauges overall investor mood, has turned negative, signaling reduced confidence in the token’s recovery.

As sentiment declines, so does the chance of a swift rebound. The decreasing enthusiasm has led to lower trading volumes, worsening the price drop. Without renewed buyer interest, the coin’s recovery appears uncertain, raising further concerns among its backers.

Read more: What Are Meme Coins?

Moo Deng Weighted Sentiment.
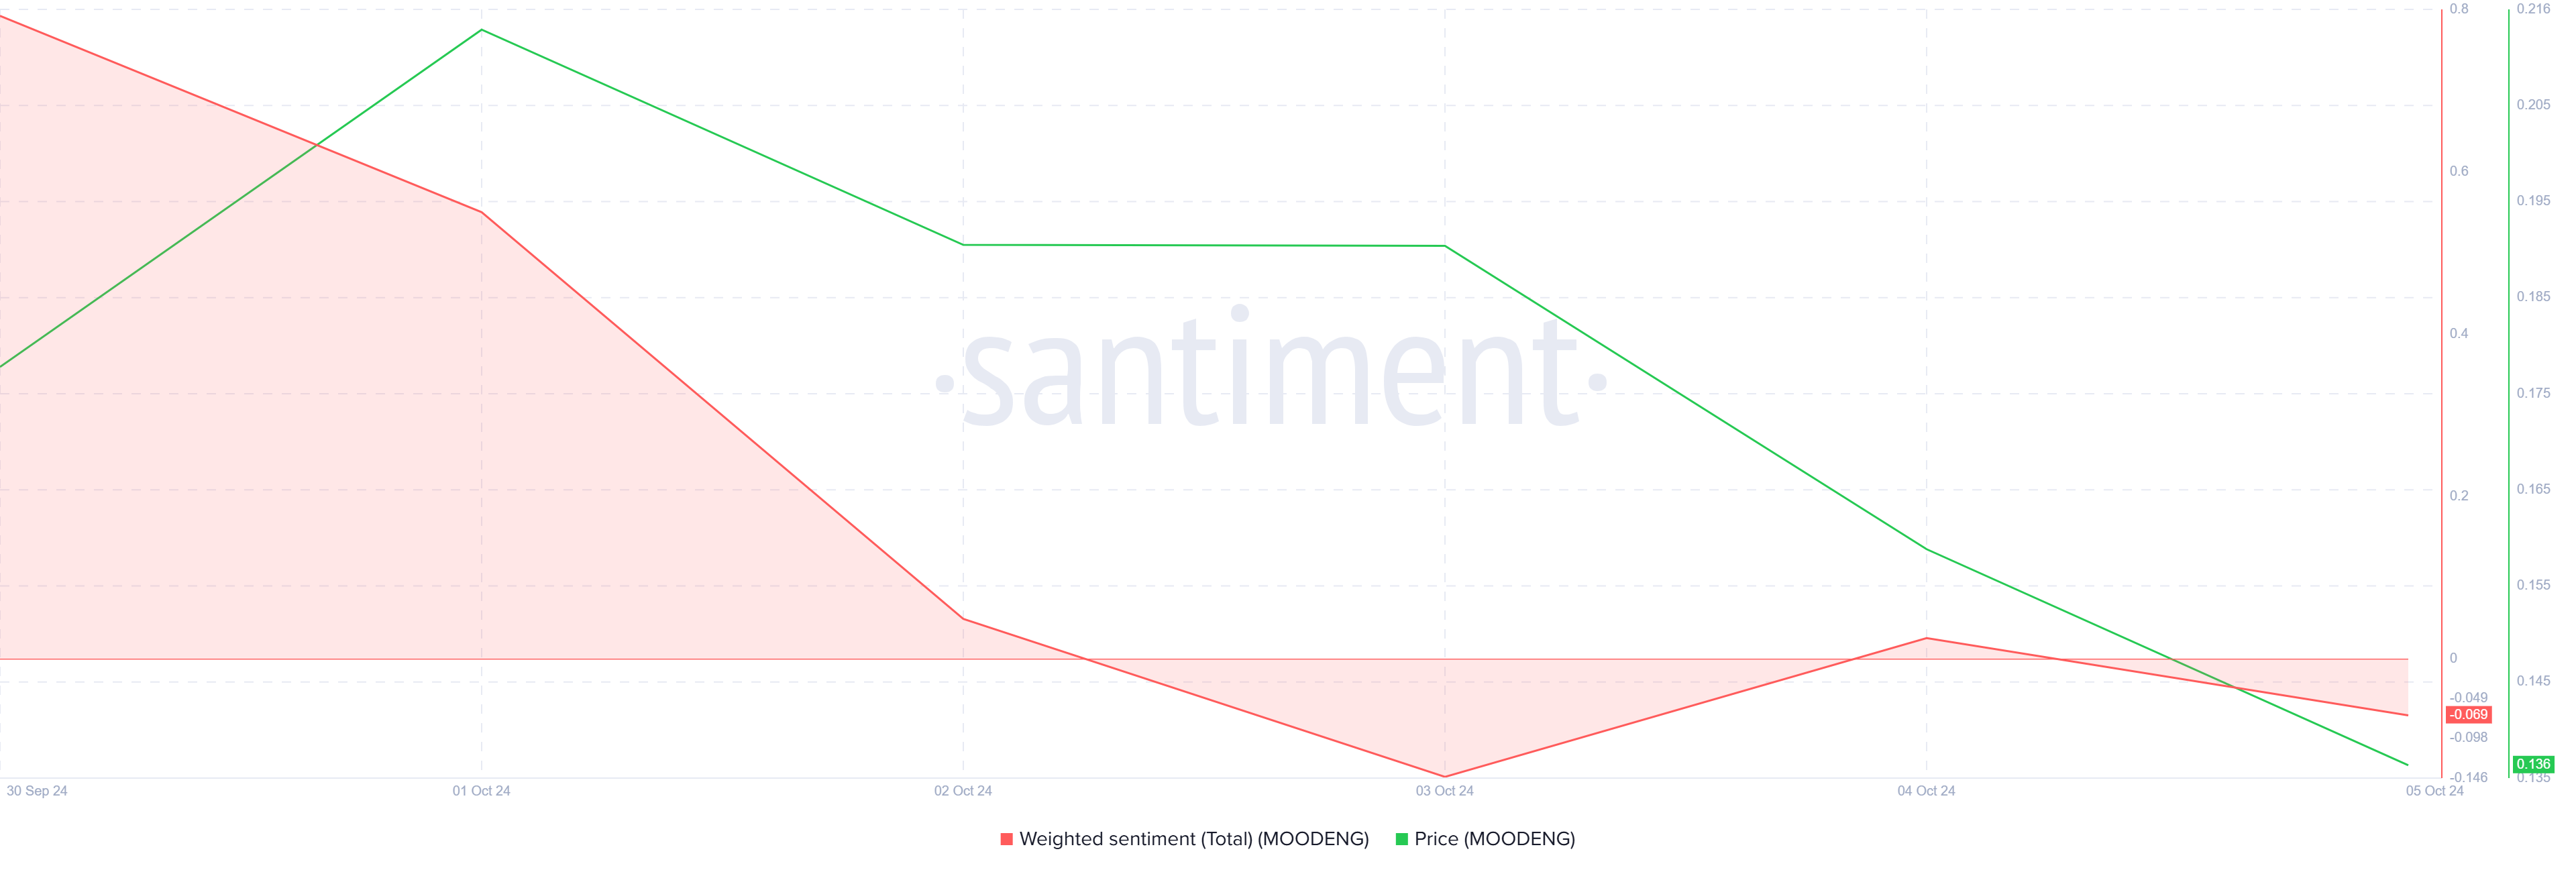
Moo Deng Weighted Sentiment. Source: Santiment

On the technical front, Moo Deng’s momentum has also turned decisively to the bearish side. The Relative Strength Index (RSI) has fallen below the critical neutral line of 50.0, a sign that the buying pressure is weak and that bearish momentum has taken over.

The drop in RSI from bullish to bearish reflects the broader market trend for Moo Deng. With the momentum favoring sellers, the coin is likely to experience more downward pressure in the near term. This could potentially drive the price even lower if the bearish conditions persist.

Moo Deng RSI.
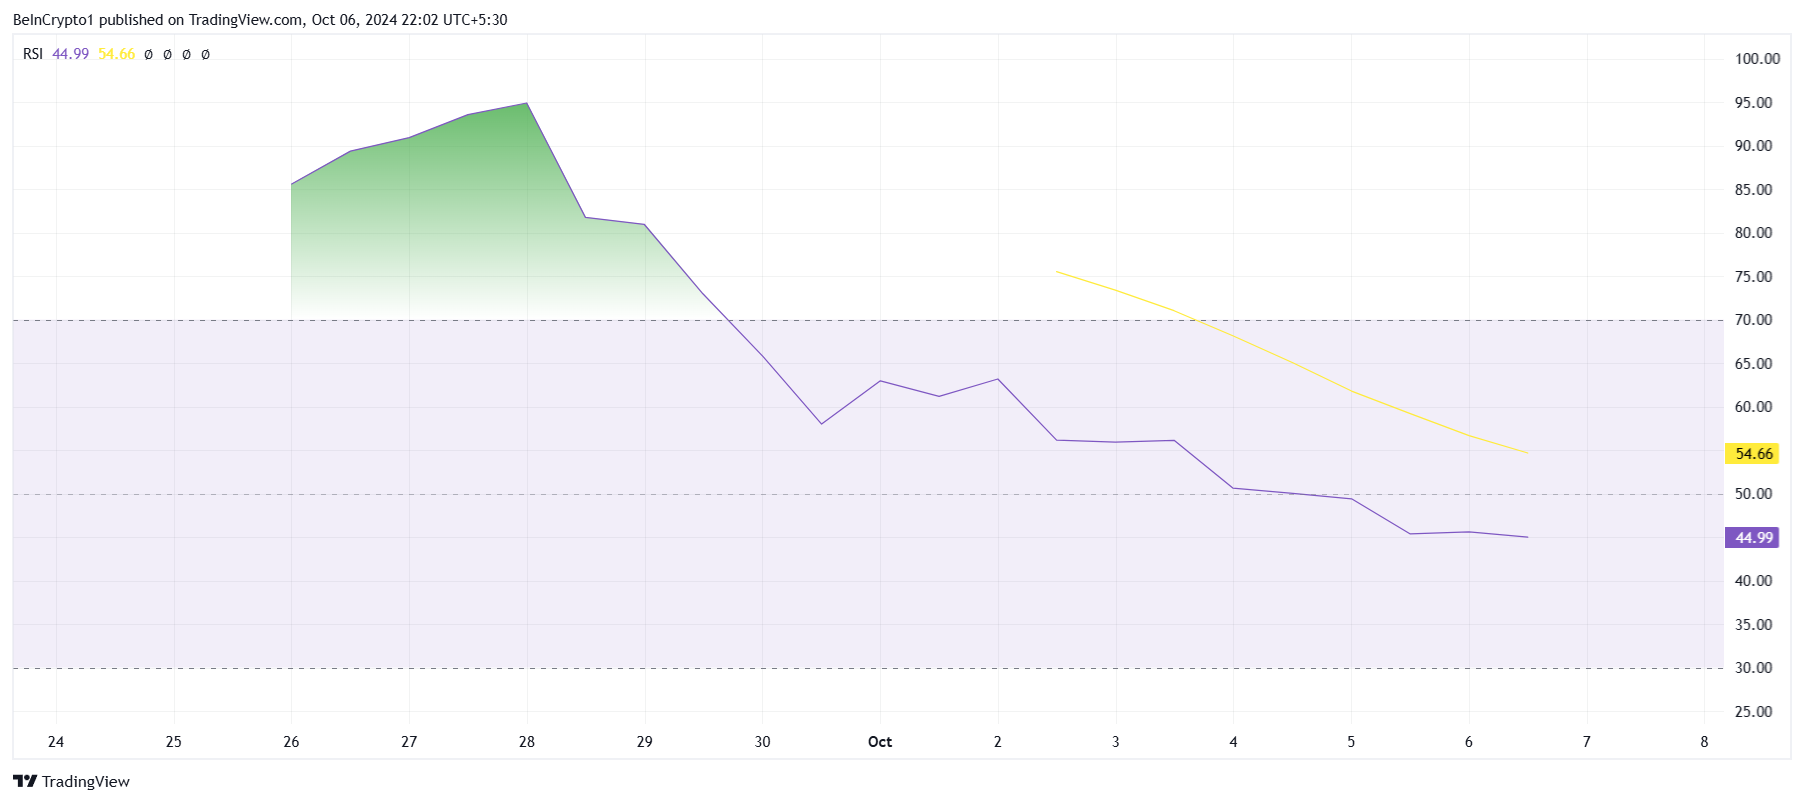
Moo Deng RSI. Source: TradingView

MOODENG Price Prediction: The Hippo Is in Danger

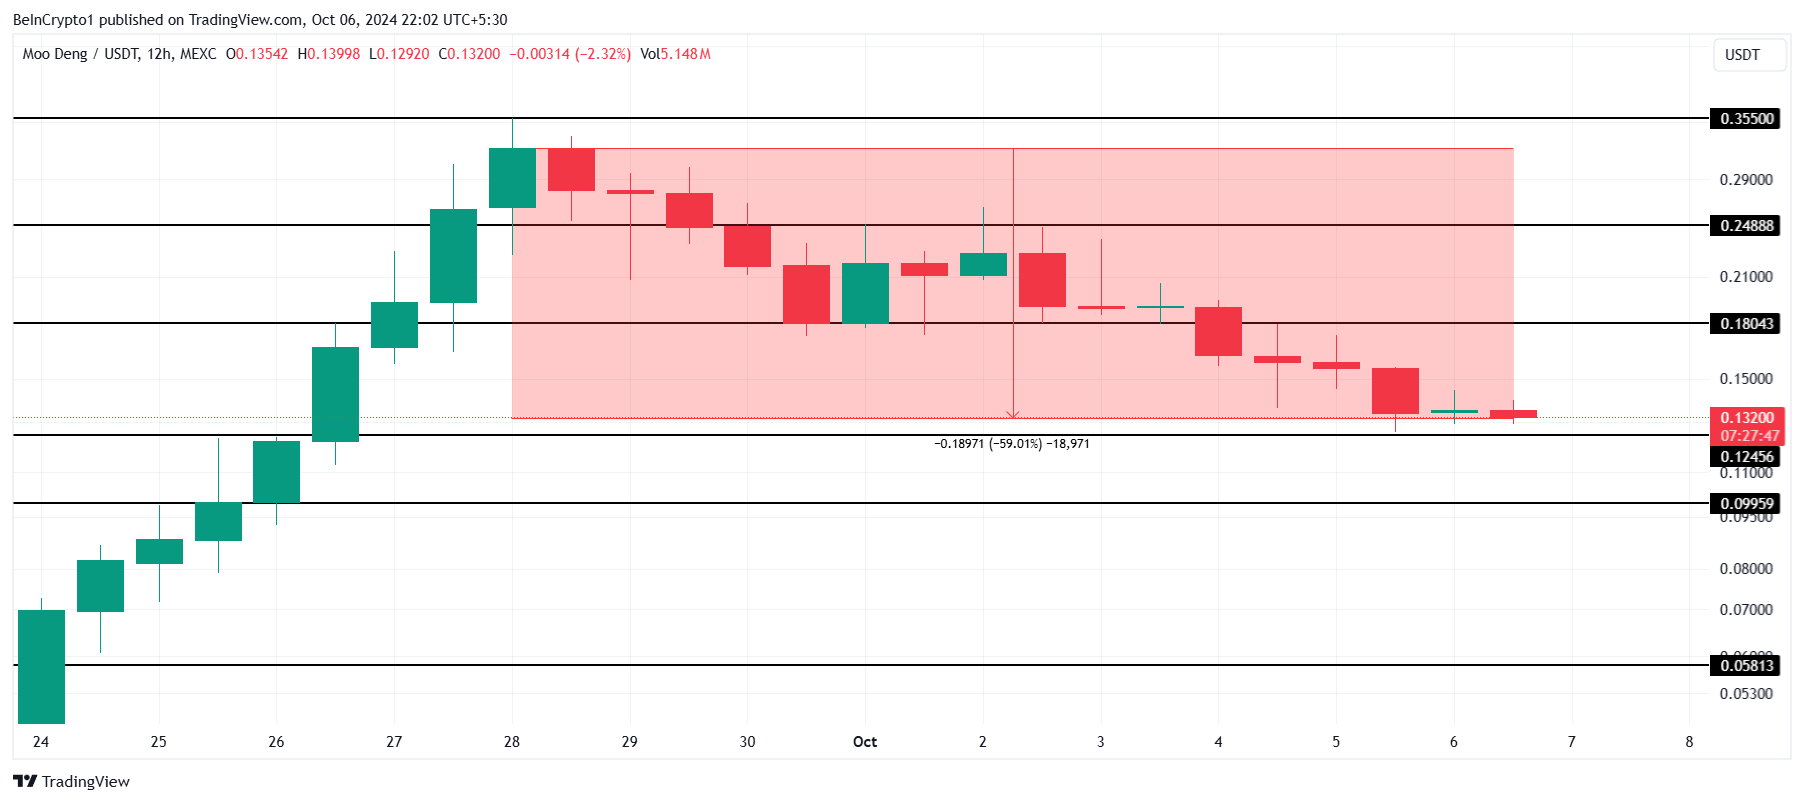
Moo Deng’s price has plummeted by nearly 60% over the last seven days, currently trading at $0.132. For now, the meme coin is managing to hold above the crucial support level of $0.124, but this stability may not last long.

Given the negative market sentiment and bearish technical indicators, Moo Deng’s price could potentially drop below $0.124. If this support fails to hold, the meme coin will slide further, testing the next critical support at $0.099.

Read more: 11 Top Solana Meme Coins to Watch in October 2024

Moo Deng Price AnalysisMoo Deng Price Analysis. Source: TradingView

However, there is still a possibility of recovery. If Moo Deng price manages to bounce off the $0.124 support, it could initiate a rise towards $0.180. Breaching this level would invalidate the bearish outlook and push the coin closer to $0.200, recovering some of its recent losses.

Disclaimer: For information purposes only. Past performance is not indicative of future results.
placeholder
Gold Price Forecast: XAU/USD declines below $4,050 on USD strength and hawkish Fed comments Gold price (XAU/USD) extends the decline to around $4,030 during the early Asian session on Tuesday. The precious metal edges lower as traders dialed back expectations of a US interest rate cut next month.
Author  FXStreet
Nov 18, Tue
Gold price (XAU/USD) extends the decline to around $4,030 during the early Asian session on Tuesday. The precious metal edges lower as traders dialed back expectations of a US interest rate cut next month.
placeholder
2025 Black Friday is coming! Which stocks may see volatility?Coming on the day right after Thanksgiving in the United States, Back Friday marks the start of the holiday shopping season. Sales data from this shopping frenzy day reflects investor confidence and consumer trends. The National Retail Federation (NRF) predicts that holiday season (Nov and Dec) retail sales in 2025 will likely exceed $1 trillion for the very first time, which represents a year-over-year increase of 3.7 to 4.2 percent. Historic data from the past decade show that the retail sector has generally outperformed the S&P 500 during the weeks before and after Black Friday. The following retailing companies are expected to be big winners:
Author  Insights
Nov 24, Mon
Coming on the day right after Thanksgiving in the United States, Back Friday marks the start of the holiday shopping season. Sales data from this shopping frenzy day reflects investor confidence and consumer trends. The National Retail Federation (NRF) predicts that holiday season (Nov and Dec) retail sales in 2025 will likely exceed $1 trillion for the very first time, which represents a year-over-year increase of 3.7 to 4.2 percent. Historic data from the past decade show that the retail sector has generally outperformed the S&P 500 during the weeks before and after Black Friday. The following retailing companies are expected to be big winners:
placeholder
Bitcoin Bleeds to $86K, But This Key Indicator Screams "The Top Isn't In"Bitcoin’s adjusted Spent Output Profit Ratio (aSOPR) has spent nearly two years coiling below the extremes seen at past bull-market peaks, even as BTC trades around $86,300 and down 9% on the week — a setup that leaves open the possibility that this cycle’s true top may still lie ahead.
Author  Mitrade
Nov 25, Tue
Bitcoin’s adjusted Spent Output Profit Ratio (aSOPR) has spent nearly two years coiling below the extremes seen at past bull-market peaks, even as BTC trades around $86,300 and down 9% on the week — a setup that leaves open the possibility that this cycle’s true top may still lie ahead.
placeholder
NZD/USD jumps above 0.5650 as RBNZ cuts OCR to 2.25%The NZD/USD pair climbs to near 0.5665 during the early Asian session on Wednesday. The New Zealand Dollar (NZD) strengthens against the US Dollar (USD) following the Reserve Bank of New Zealand (RBNZ) interest rate decision. 
Author  FXStreet
22 hours ago
The NZD/USD pair climbs to near 0.5665 during the early Asian session on Wednesday. The New Zealand Dollar (NZD) strengthens against the US Dollar (USD) following the Reserve Bank of New Zealand (RBNZ) interest rate decision. 
placeholder
Bitcoin Price Rebound Gains Traction with $90K Break in SightBitcoin is trading above $87,000 and its 100-hour SMA after rebounding from $83,500, with a bearish trend line at $88,200 and resistance at $89,000–$90,000 now in focus as BTC either breaks higher toward $91,750–$94,000 or slips back toward $86,700, $85,000 and lower supports.
Author  Mitrade
21 hours ago
Bitcoin is trading above $87,000 and its 100-hour SMA after rebounding from $83,500, with a bearish trend line at $88,200 and resistance at $89,000–$90,000 now in focus as BTC either breaks higher toward $91,750–$94,000 or slips back toward $86,700, $85,000 and lower supports.
goTop
quote