

New All-Time High for SUI Price Not on the Horizon
SUI price has been experiencing an upward trend recently, making it a potential contender for reaching a new all-time high (ATH). However, shifting investor sentiment suggests that the altcoin may struggle to achieve this milestone.
Despite its recent gains, SUI’s momentum appears to be faltering as technical indicators show signs of an upcoming market shift.
SUI Gains Unlikely
One of the main concerns for SUI’s price action is the tightening of the Bollinger Bands, which signals an impending volatility squeeze. A squeeze occurs when the Bollinger Bands narrow, typically followed by a sharp price movement, either up or down. The significant drop in trading volume further confirms that a squeeze is likely approaching.
This upcoming squeeze could lead to heightened volatility for SUI, and while there is a possibility for a rally, it could just as easily result in a price drop. The lack of volume shows that investor activity is waning, which may mean a lack of sufficient support for pushing the altcoin to a new ATH.
Read More: Everything You Need to Know About the Sui Blockchain
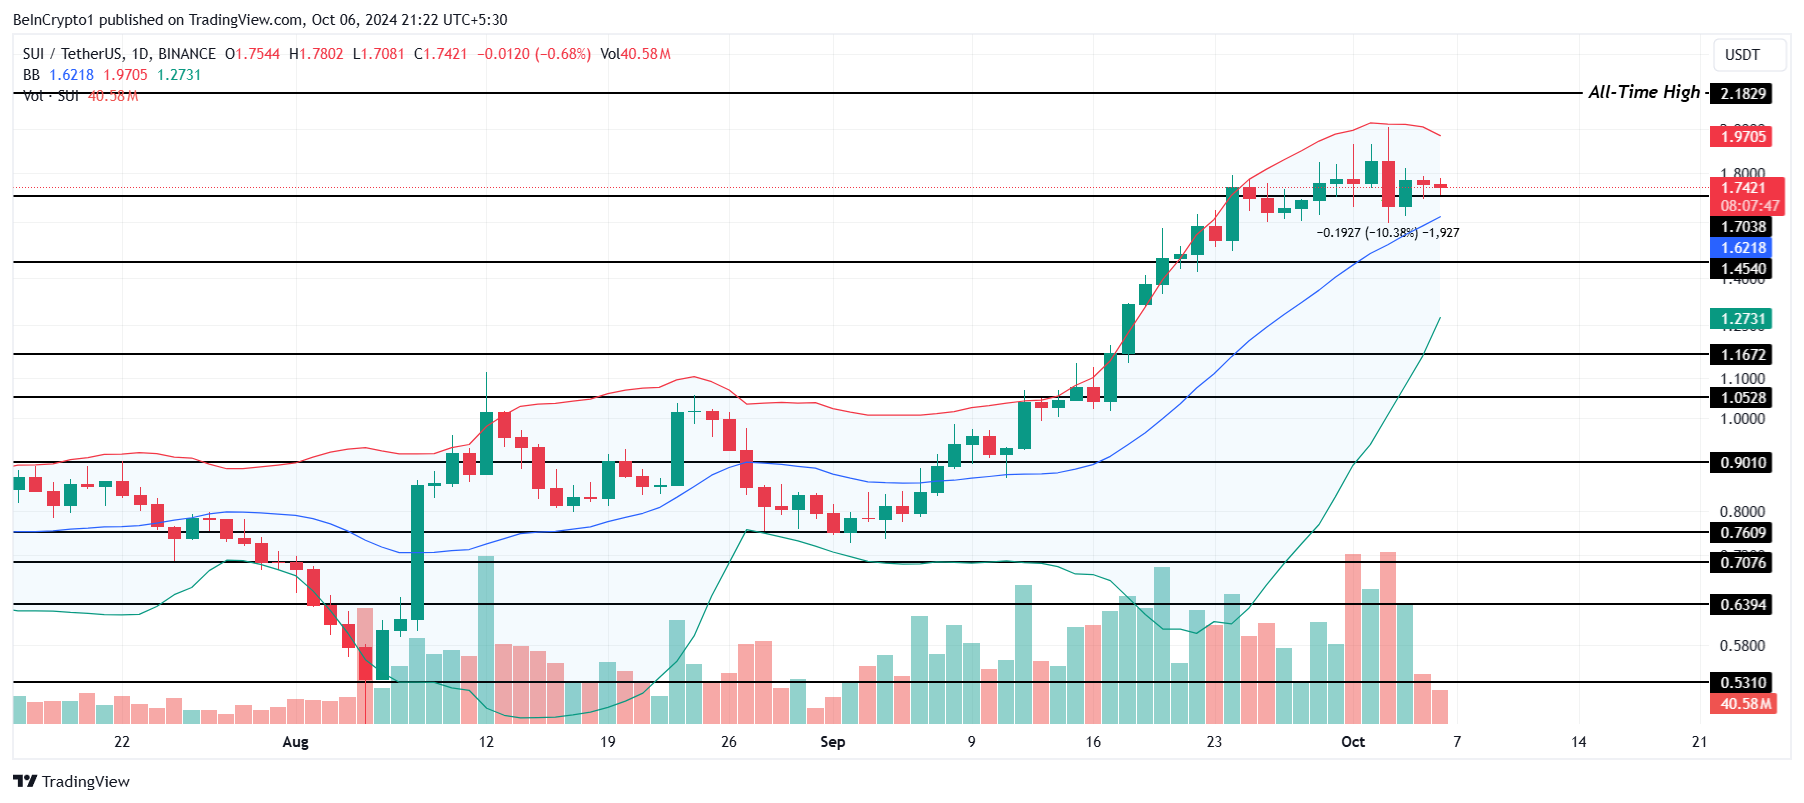 SUI Bollinger Bands. Source: TradingView
SUI’s macro momentum also presents some concerns. The moving Average Convergence Divergence (MACD) indicator is showing early signs of a bearish crossover, a pattern that typically signals a trend reversal towards the downside. This is particularly notable because it would be the first bearish MACD crossover in nearly a month for SUI, suggesting that the volatility from the squeeze might favor the bears.
With this bearish crossover, it becomes more likely that SUI’s price will face pressure to decline. This adds weight to the argument that SUI may not be ready to form a new ATH in the near term. The confluence of technical indicators is hinting at a potential reversal that investors should be cautious of.
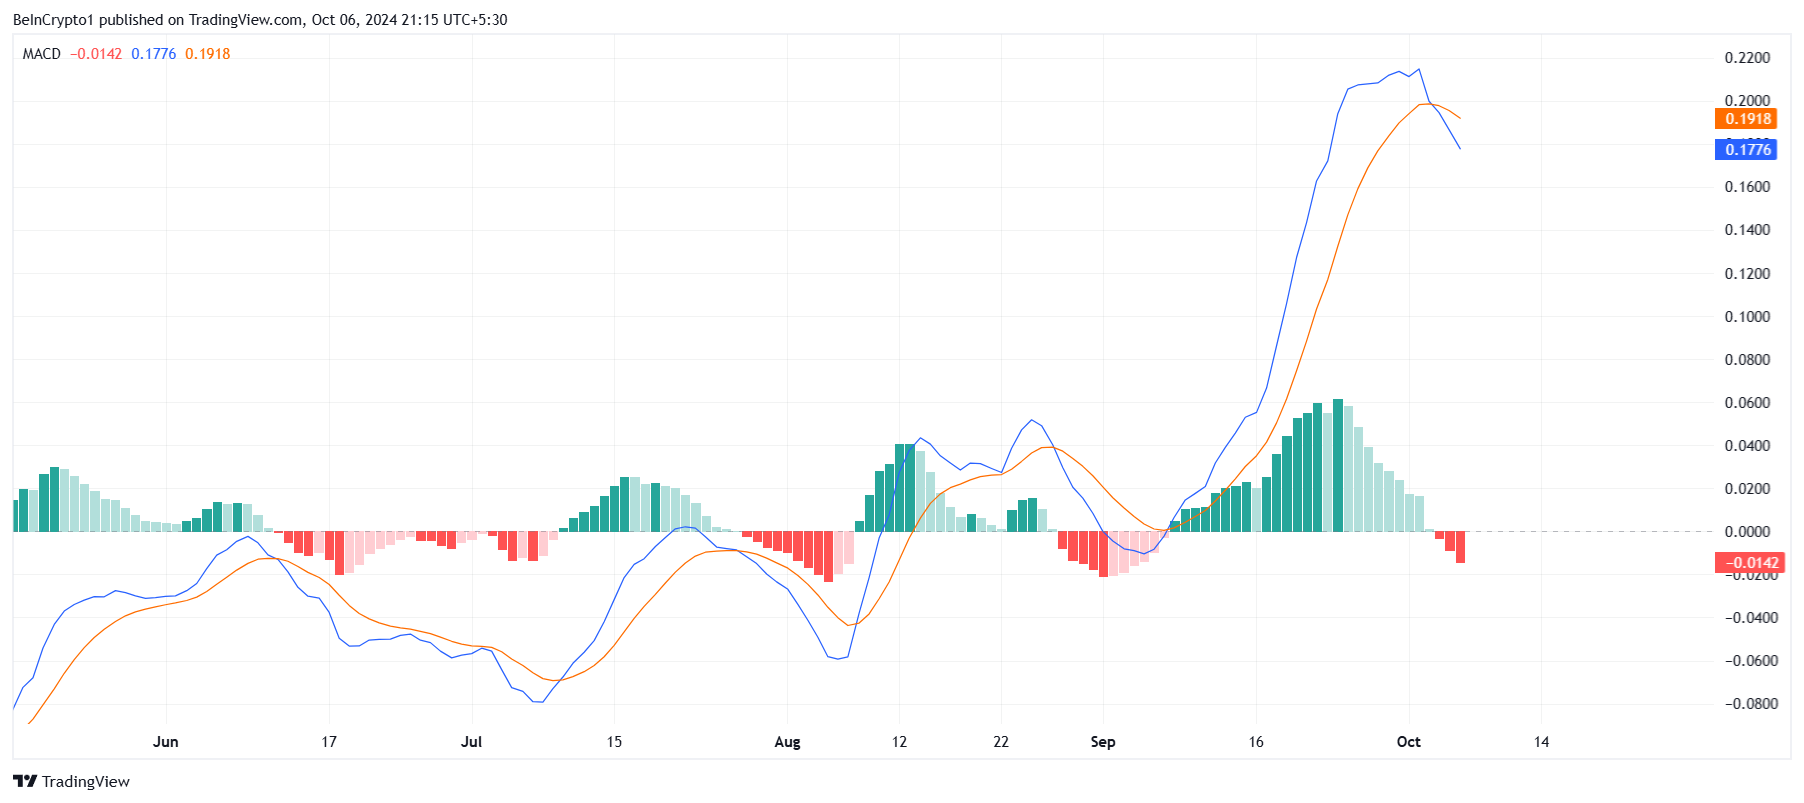 SUI MACD. Source: TradingView
SUI Price Prediction: Loss Ahead
SUI’s price is currently hovering at $1.74, just above the critical support level of $1.70. If the support is lost, the altcoin could fall further, leading to a larger price drop.
Given the current technical indicators, a decline to $1.45 is plausible, and if investors start selling, this drawdown could extend to $1.16. Such a move would further diminish the chances of SUI hitting a new ATH anytime soon.
Read More: A Guide to the 10 Best Sui (SUI) Wallets in 2024
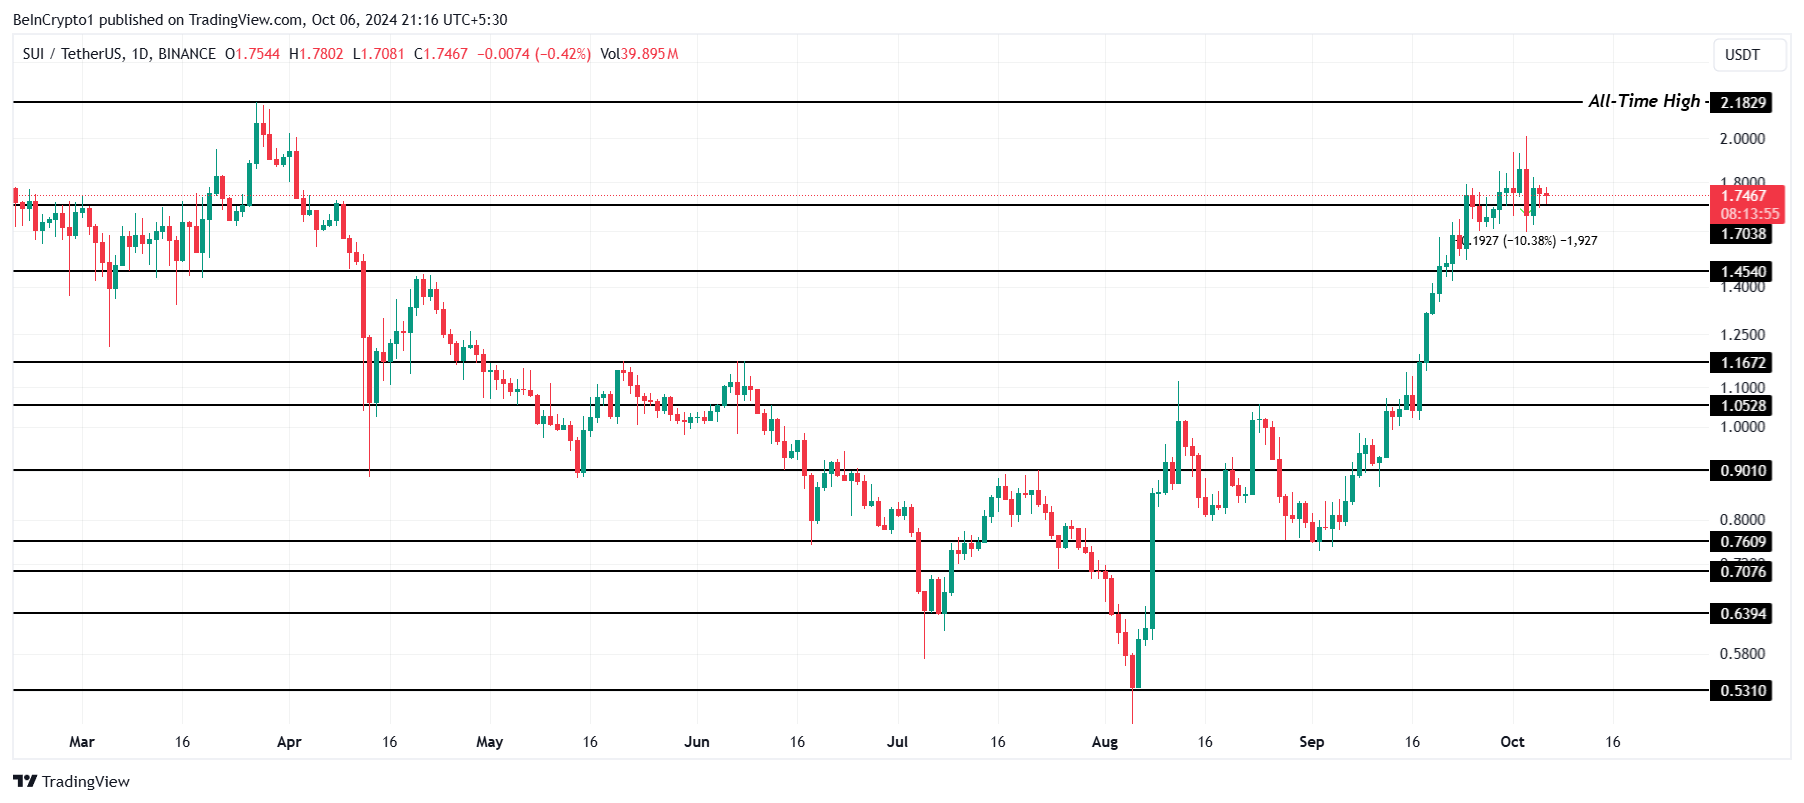 SUI Price Analysis. Source: TradingView
However, if the broader market shows bullish strength and manages to overpower the current bearish sentiment, SUI could rise to $2.18. Breaching this level would invalidate the bearish outlook and set the stage for SUI to form a new all-time high.
Recommended Articles


