POPCAT Price Hits New ATH as Solana Meme Coin Rallies 120%

Source Beincrypto

POPCAT, a Solana meme coin, has reached a new all-time high (ATH) following a significant rally. The coin surged by 109% over the past month, crossing the crucial $1.00 resistance barrier and reaching $1.29. 

This marked a pivotal moment for POPCAT, driven by strong market sentiment and unique factors that set it apart from other altcoins.

POPCAT Is a Unique Case

One of the key factors behind POPCAT’s recent rally is its lack of correlation with Bitcoin (BTC). Unlike many other altcoins that tend to move in sync with BTC’s price fluctuations, POPCAT has historically performed better when its correlation with Bitcoin drops. Currently, the correlation between POPCAT and BTC has fallen to 0.33, indicating a weaker relationship.

This lower correlation has proven beneficial for POPCAT, as the broader cryptocurrency market has been facing challenges. The meme coin’s ability to move independently of Bitcoin has allowed it to capitalize on favorable market conditions, leading to the recent price surge.

Read More: How to Buy Solana Meme Coins: A Step-By-Step Guide

POPCAT Correlation with Bitcoin. 
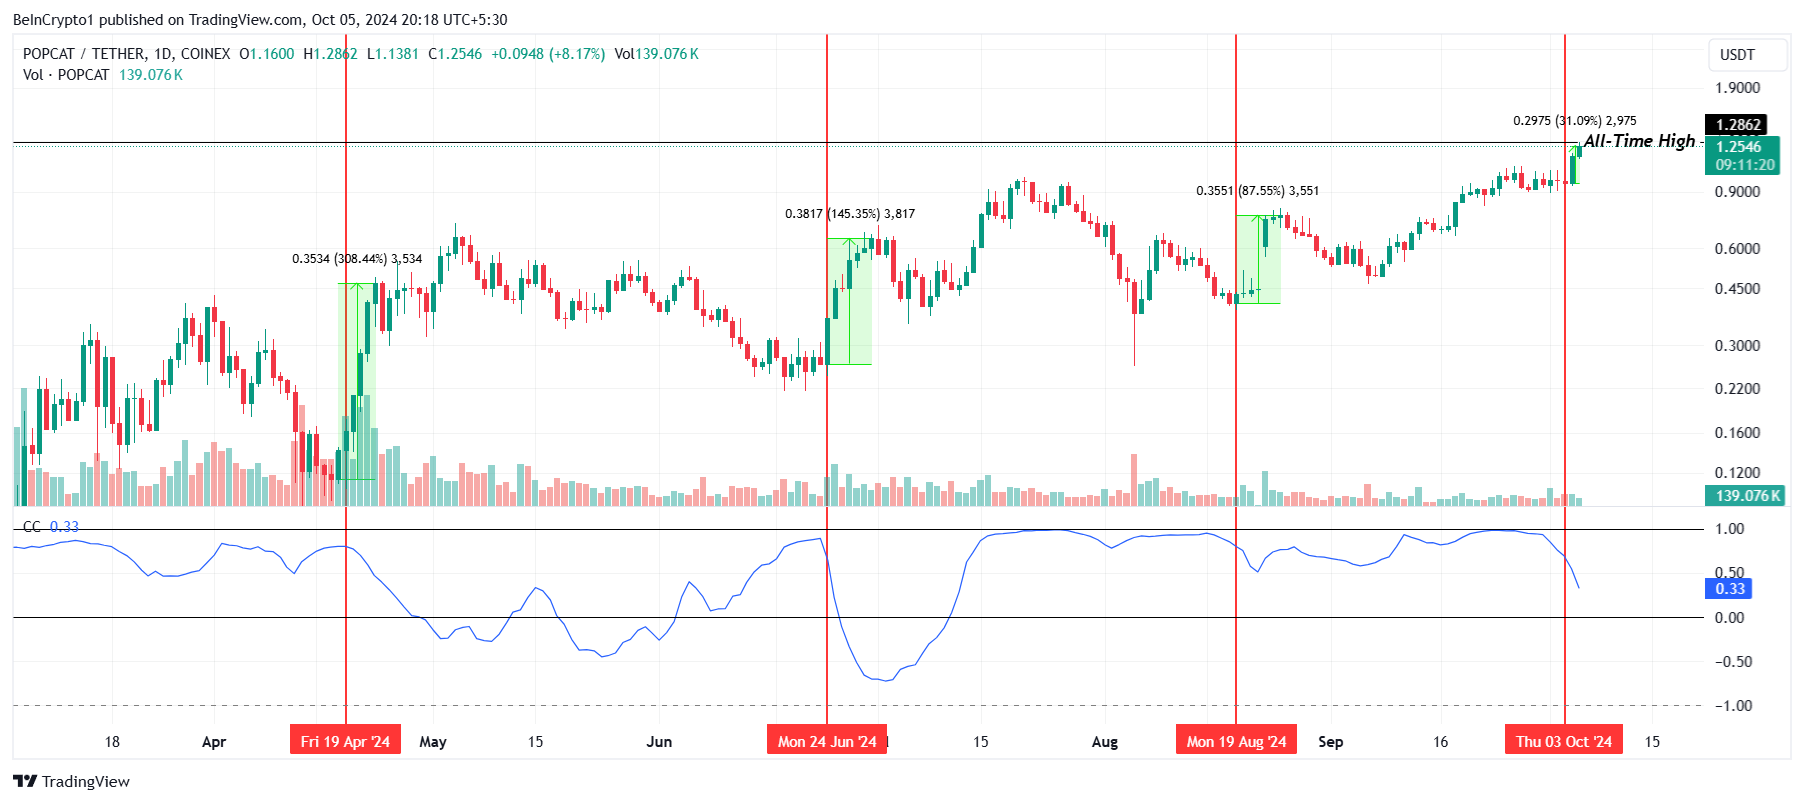
POPCAT Correlation with Bitcoin. Source: TradingView

From a technical perspective, POPCAT’s macro momentum remains strong. The Relative Strength Index (RSI), a key indicator for assessing overbought or oversold conditions, is currently in the former zone. Despite this, the RSI is still rising, signaling that buying pressure remains strong for POPCAT. 

However, it’s worth noting that meme coins like POPCAT often experience sudden price corrections, especially when investors decide to take profits. Although POPCAT holders have not yet shown signs of selling, the risk of a potential pullback looms, given the RSI’s position in the overbought zone.

POPCAT RSI. 
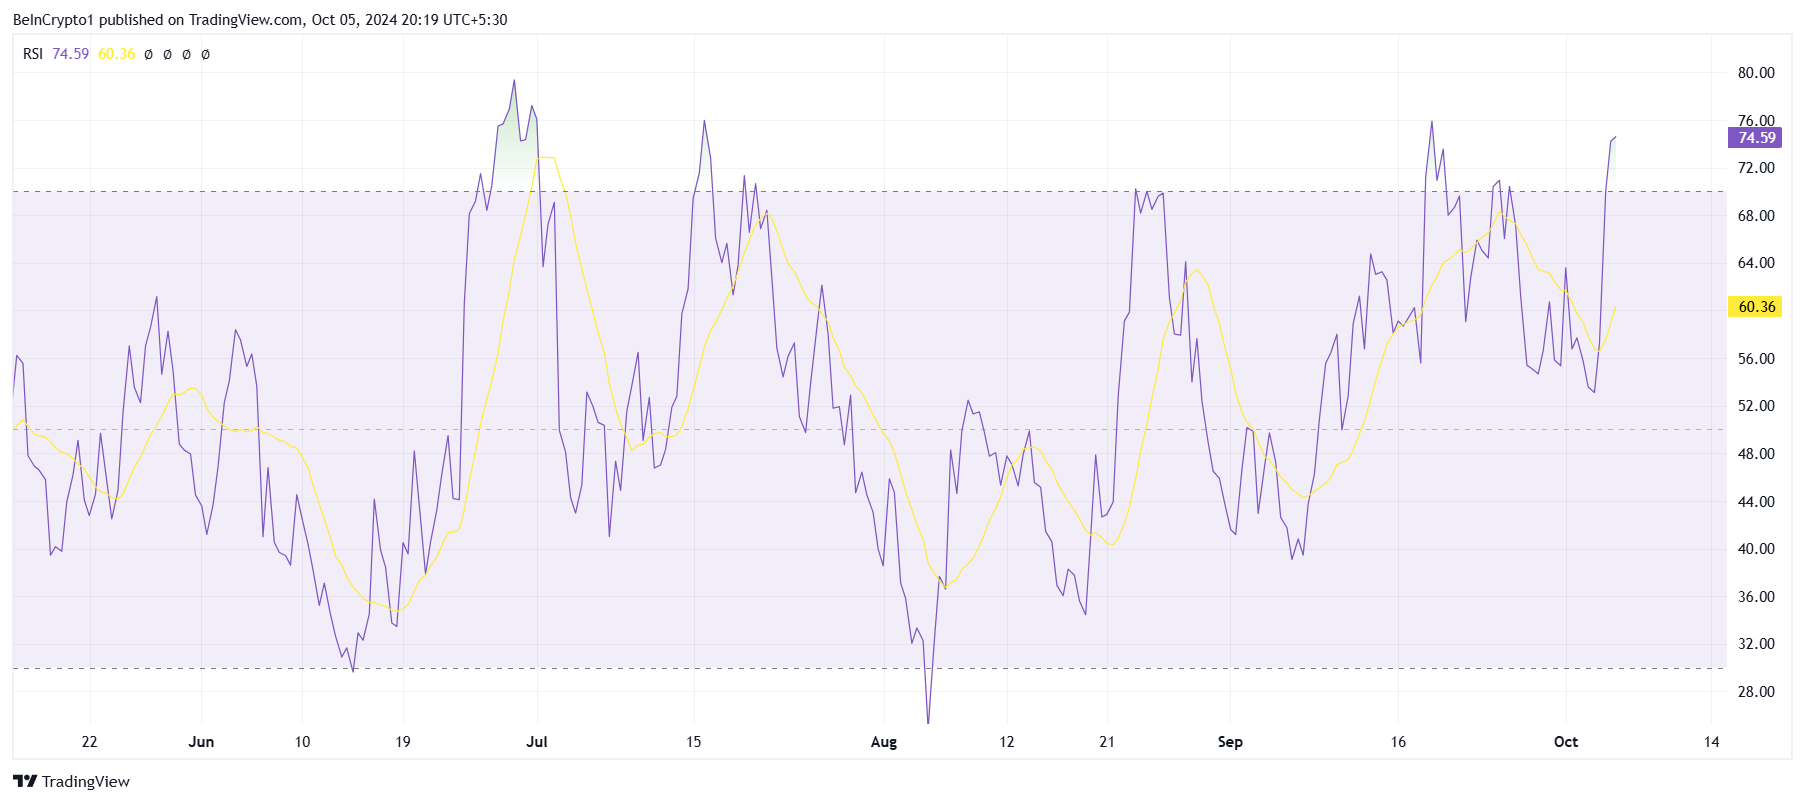
POPCAT RSI. Source: TradingView

POPCAT Price Prediction: Beating the Odds

POPCAT’s price saw a 31% rise over the past 24 hours, propelling the Solana-based meme coin to $1.29, its new ATH. This impressive increase is part of a larger 109% rally over the past month, driven by strong market sentiment and favorable technical indicators.

Breaking through the $1.00 barrier was a significant milestone for POPCAT, as this level had previously served as a tough resistance. The broader market conditions supported this breach, enabling the meme coin to soar to new heights.

Read More: 11 Top Solana Meme Coins to Watch in October 2024

POPCAT Price Analysis. 
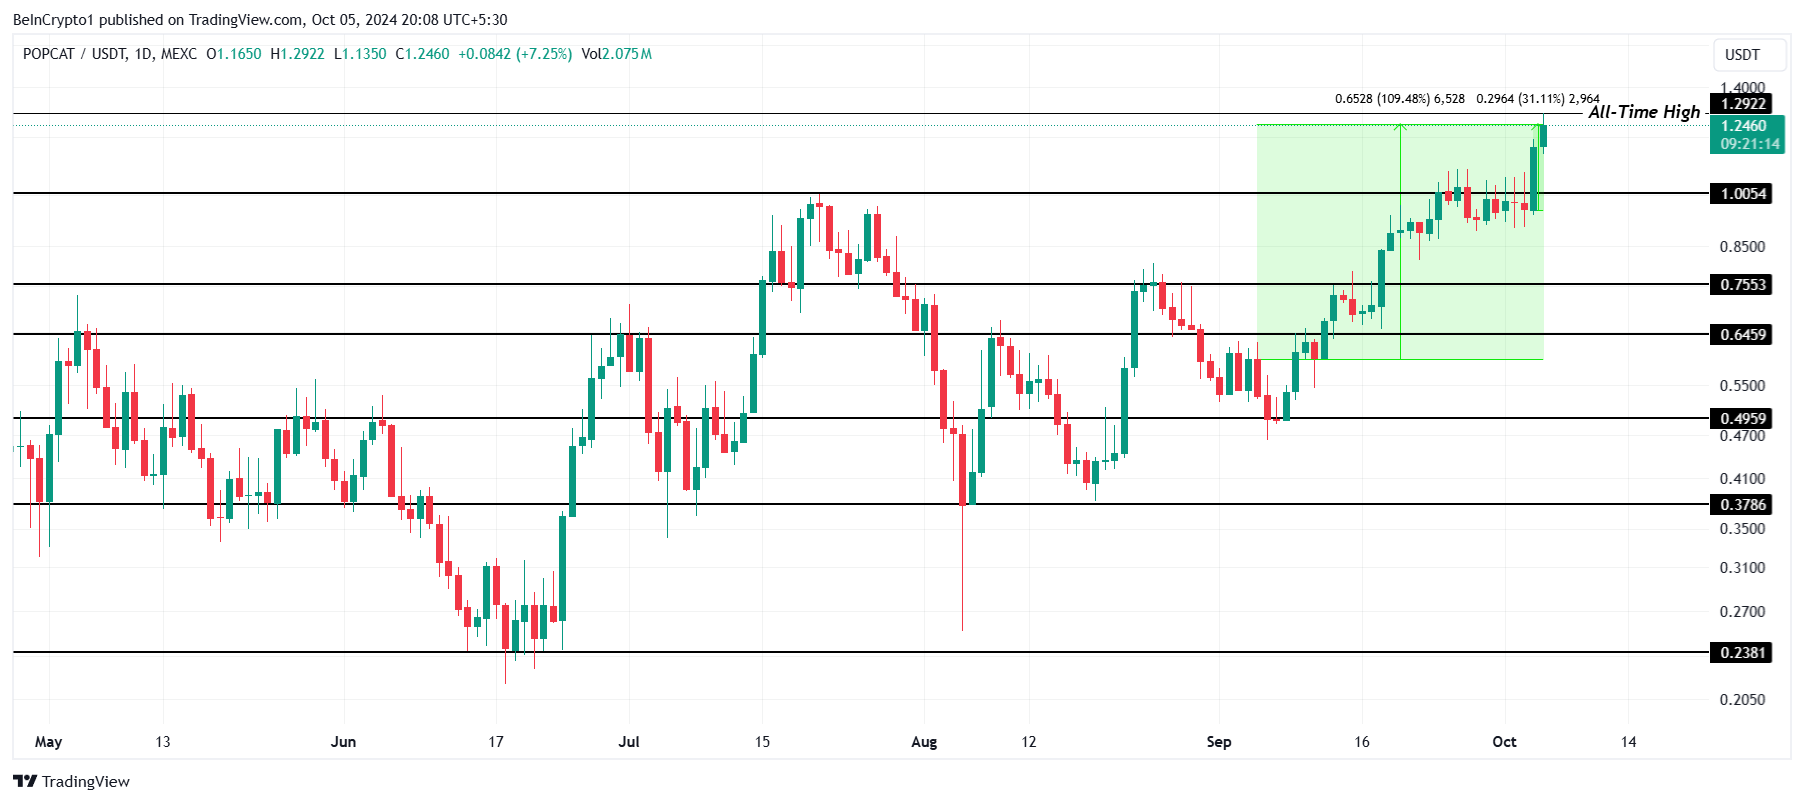
POPCAT Price Analysis. Source: TradingView

However, a sharp price correction could occur if investors move to take profits. A drop to the $1.00 support level is possible, and losing this key level could push POPCAT down to $0.75, invalidating the potential for further upward momentum. Investors should remain cautious as the coin continues to navigate its volatile price action.

Disclaimer: For information purposes only. Past performance is not indicative of future results.
placeholder
Bitcoin Volatility Spikes: Is Options-Driven Pricing Making a Comeback?Bitcoin's volatility is surging, suggesting a shift back to options-driven price action seen before Bitcoin ETFs were launched.
Author  Mitrade
Nov 24, Mon
Bitcoin's volatility is surging, suggesting a shift back to options-driven price action seen before Bitcoin ETFs were launched.
placeholder
2025 Black Friday is coming! Which stocks may see volatility?Coming on the day right after Thanksgiving in the United States, Back Friday marks the start of the holiday shopping season. Sales data from this shopping frenzy day reflects investor confidence and consumer trends. The National Retail Federation (NRF) predicts that holiday season (Nov and Dec) retail sales in 2025 will likely exceed $1 trillion for the very first time, which represents a year-over-year increase of 3.7 to 4.2 percent. Historic data from the past decade show that the retail sector has generally outperformed the S&P 500 during the weeks before and after Black Friday. The following retailing companies are expected to be big winners:
Author  Insights
Nov 24, Mon
Coming on the day right after Thanksgiving in the United States, Back Friday marks the start of the holiday shopping season. Sales data from this shopping frenzy day reflects investor confidence and consumer trends. The National Retail Federation (NRF) predicts that holiday season (Nov and Dec) retail sales in 2025 will likely exceed $1 trillion for the very first time, which represents a year-over-year increase of 3.7 to 4.2 percent. Historic data from the past decade show that the retail sector has generally outperformed the S&P 500 during the weeks before and after Black Friday. The following retailing companies are expected to be big winners:
placeholder
Bitcoin Bleeds to $86K, But This Key Indicator Screams "The Top Isn't In"Bitcoin’s adjusted Spent Output Profit Ratio (aSOPR) has spent nearly two years coiling below the extremes seen at past bull-market peaks, even as BTC trades around $86,300 and down 9% on the week — a setup that leaves open the possibility that this cycle’s true top may still lie ahead.
Author  Mitrade
Nov 25, Tue
Bitcoin’s adjusted Spent Output Profit Ratio (aSOPR) has spent nearly two years coiling below the extremes seen at past bull-market peaks, even as BTC trades around $86,300 and down 9% on the week — a setup that leaves open the possibility that this cycle’s true top may still lie ahead.
placeholder
NZD/USD jumps above 0.5650 as RBNZ cuts OCR to 2.25%The NZD/USD pair climbs to near 0.5665 during the early Asian session on Wednesday. The New Zealand Dollar (NZD) strengthens against the US Dollar (USD) following the Reserve Bank of New Zealand (RBNZ) interest rate decision. 
Author  FXStreet
22 hours ago
The NZD/USD pair climbs to near 0.5665 during the early Asian session on Wednesday. The New Zealand Dollar (NZD) strengthens against the US Dollar (USD) following the Reserve Bank of New Zealand (RBNZ) interest rate decision. 
placeholder
Bitcoin Price Rebound Gains Traction with $90K Break in SightBitcoin is trading above $87,000 and its 100-hour SMA after rebounding from $83,500, with a bearish trend line at $88,200 and resistance at $89,000–$90,000 now in focus as BTC either breaks higher toward $91,750–$94,000 or slips back toward $86,700, $85,000 and lower supports.
Author  Mitrade
21 hours ago
Bitcoin is trading above $87,000 and its 100-hour SMA after rebounding from $83,500, with a bearish trend line at $88,200 and resistance at $89,000–$90,000 now in focus as BTC either breaks higher toward $91,750–$94,000 or slips back toward $86,700, $85,000 and lower supports.
goTop
quote