

Dogecoin (DOGE) Price at Risk: Bearish Indicators Signal Downtrend Ahead
The Dogecoin (DOGE) price is facing a potential shift toward a more pronounced downtrend, as recent technical signals suggest growing bearish momentum.
While selling pressure has increased, key support levels remain in focus and could play a pivotal role in determining the next move. The coming days may reveal whether DOGE continues its descent or stages a reversal toward resistance levels.
DOGE Aroon Indicator Shows A Bearish State
The Aroon indicator for Dogecoin currently shows a clear bearish trend, with the Aroon Down at 92.86% and the Aroon Up at just 7.14%. This means that DOGE has recently made a new low, while the upward momentum is weak, as there hasn’t been a recent high.
The high Aroon Down value signals strong downward pressure, indicating that the market has been trending lower. With the Aroon Up nearly flat, it reflects minimal buying interest or bullish momentum, further confirming that DOGE is in a downtrend.
The Aroon metric is a technical indicator used to identify trends and the strength of those trends. It consists of two lines — Aroon Up and Aroon Down — that measure how many periods have passed since a recent high and low, respectively. When the Aroon Up is close to 100%, it means the asset has recently made a new high, signaling strong bullish momentum.
Read more: How To Buy Dogecoin (DOGE) and Everything You Need To Know
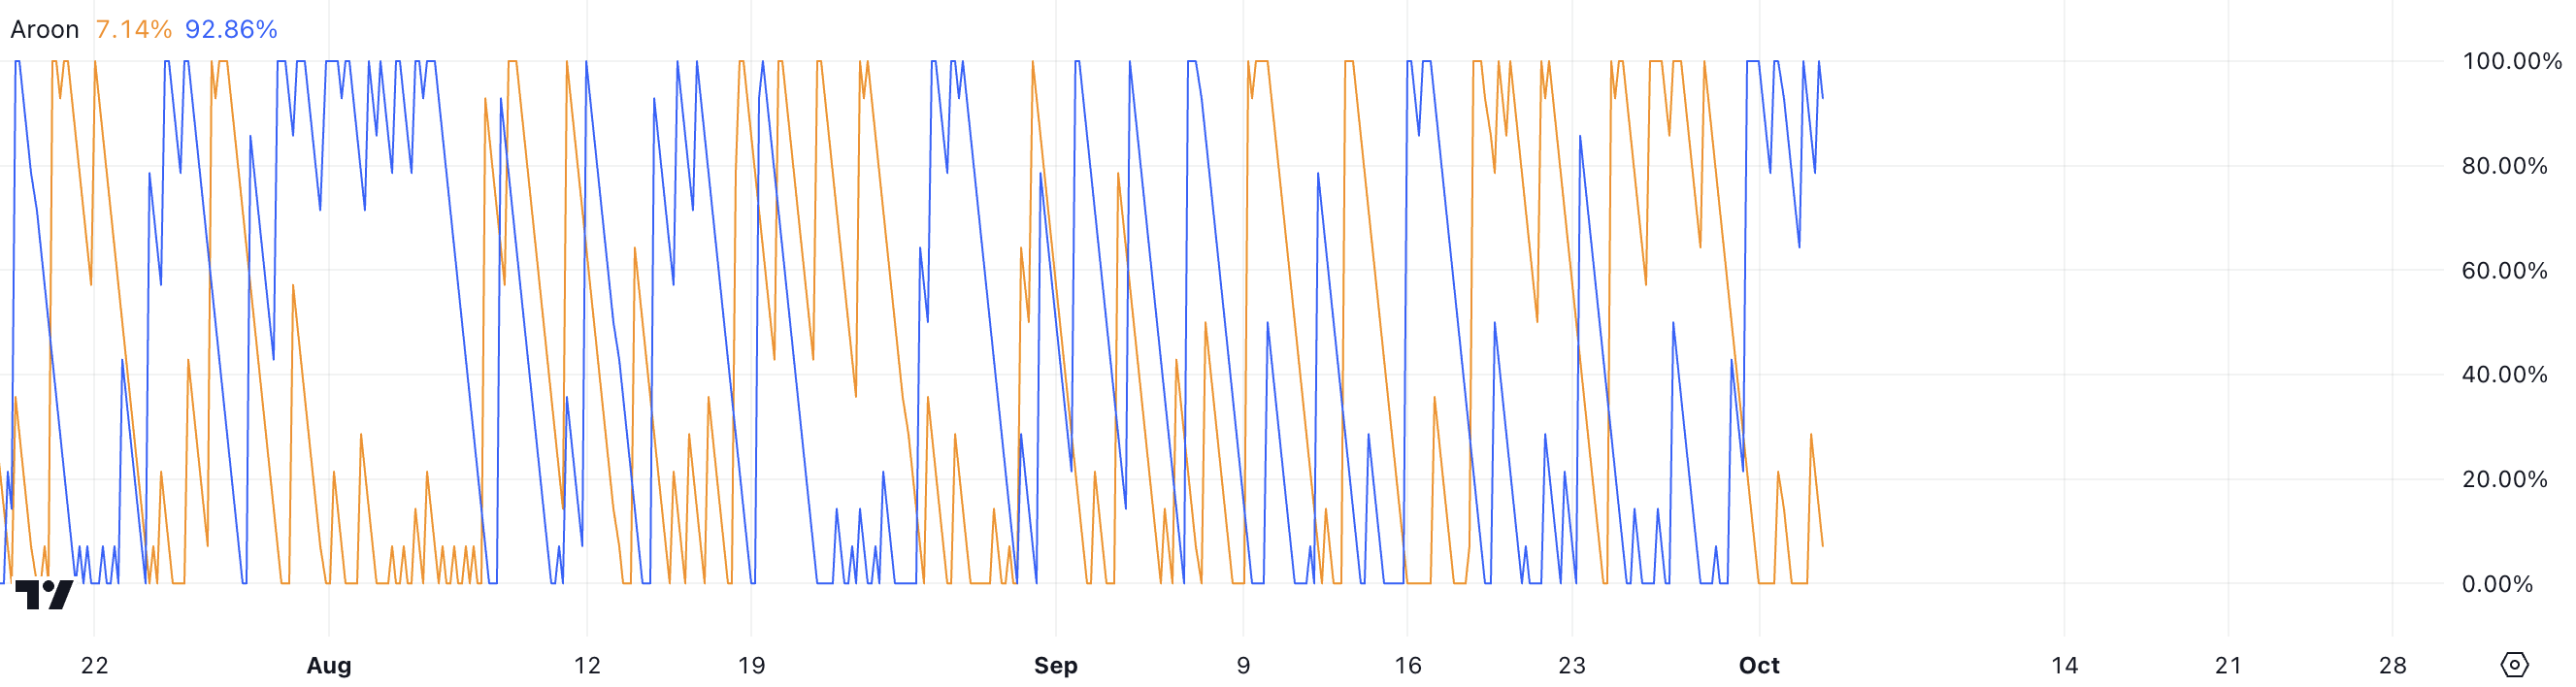 DOGE Aroon Chart. Source: TradingView
Conversely, when Aroon Down is near 100%, it indicates the asset has made a new low, signaling a strong bearish trend. The interplay of these two lines helps traders assess whether an asset is trending, in which direction, and the potential strength of that trend.
Historically, the Aroon chart for DOGE shows frequent shifts between upward and downward movements, but at present, the prevailing sentiment is bearish. Unless the Aroon Up begins to rise significantly, suggesting a new high, the outlook remains weak for DOGE in the near term.
Dogecoin CMF Just Turned Negative
The Chaikin Money Flow (CMF) indicator for Dogecoin (DOGE) is currently reading -0.06, which signals mild bearish momentum. The CMF fluctuates between -1 and 1, and a value near zero often indicates indecision or neutral momentum. However, the fact that it is slightly negative suggests that selling pressure outweighs buying pressure.
The Chaikin Money Flow measures the volume-weighted average of accumulation and distribution over a specific period, typically 20 or 21 periods. It helps traders identify whether the market is being accumulated (buying pressure) or distributed (selling pressure).
Positive CMF values indicate accumulation or buying pressure, while negative values indicate distribution or selling pressure. The closer the value is to 1 or -1, the stronger the trend. A reading near zero suggests a balance between buyers and sellers.
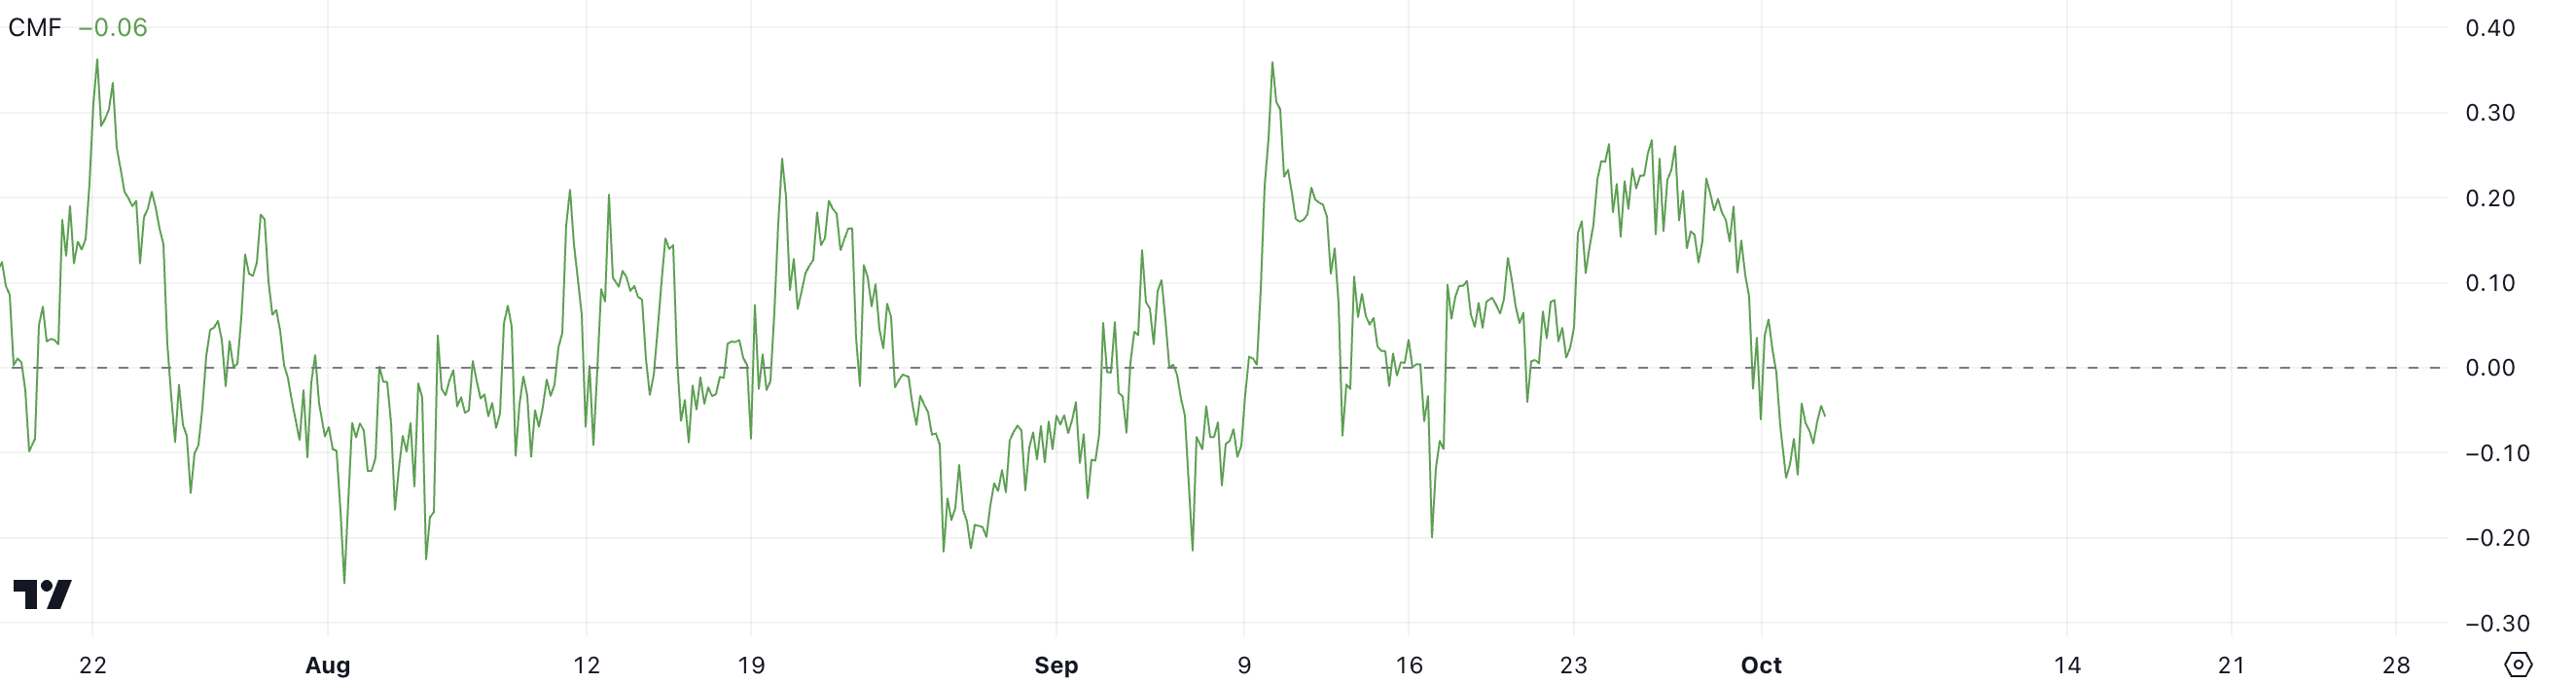 DOGE Chaikin Money Flow. Source: TradingView
In recent weeks, the CMF has fluctuated above and below the zero line, indicating alternating periods of buying and selling dominance. The peaks above 0.20 in mid-August and again in late September suggest brief periods of stronger buying pressure.
However, the recent dip into negative territory, especially towards the end of the chart, confirms that selling pressure has started to regain control, though it’s not particularly strong at this moment.
DOGE Price Prediction: A Strong Correction Ahead?
Dogecoin’s (DOGE) short-term EMA lines are crossing below the long-term EMA lines, signaling a potential shift toward a bearish trend. This kind of crossover is often viewed as a warning that the market may be entering a more extended period of decline as short-term momentum weakens compared to the longer-term price average.
While the Chaikin Money Flow (CMF) indicator shows that the current downtrend isn’t particularly strong, the formation of a death cross in the EMA lines suggests that this selling pressure could intensify in the coming days.
Exponential Moving Averages (EMA) are trend-following indicators that place more weight on recent price data, making them quicker to respond to market changes. When shorter-term EMAs cross below longer-term EMAs, it often signals increasing bearish momentum, which could lead to further downside movement.
Read more: Dogecoin (DOGE) Price Prediction 2024/2025/2030
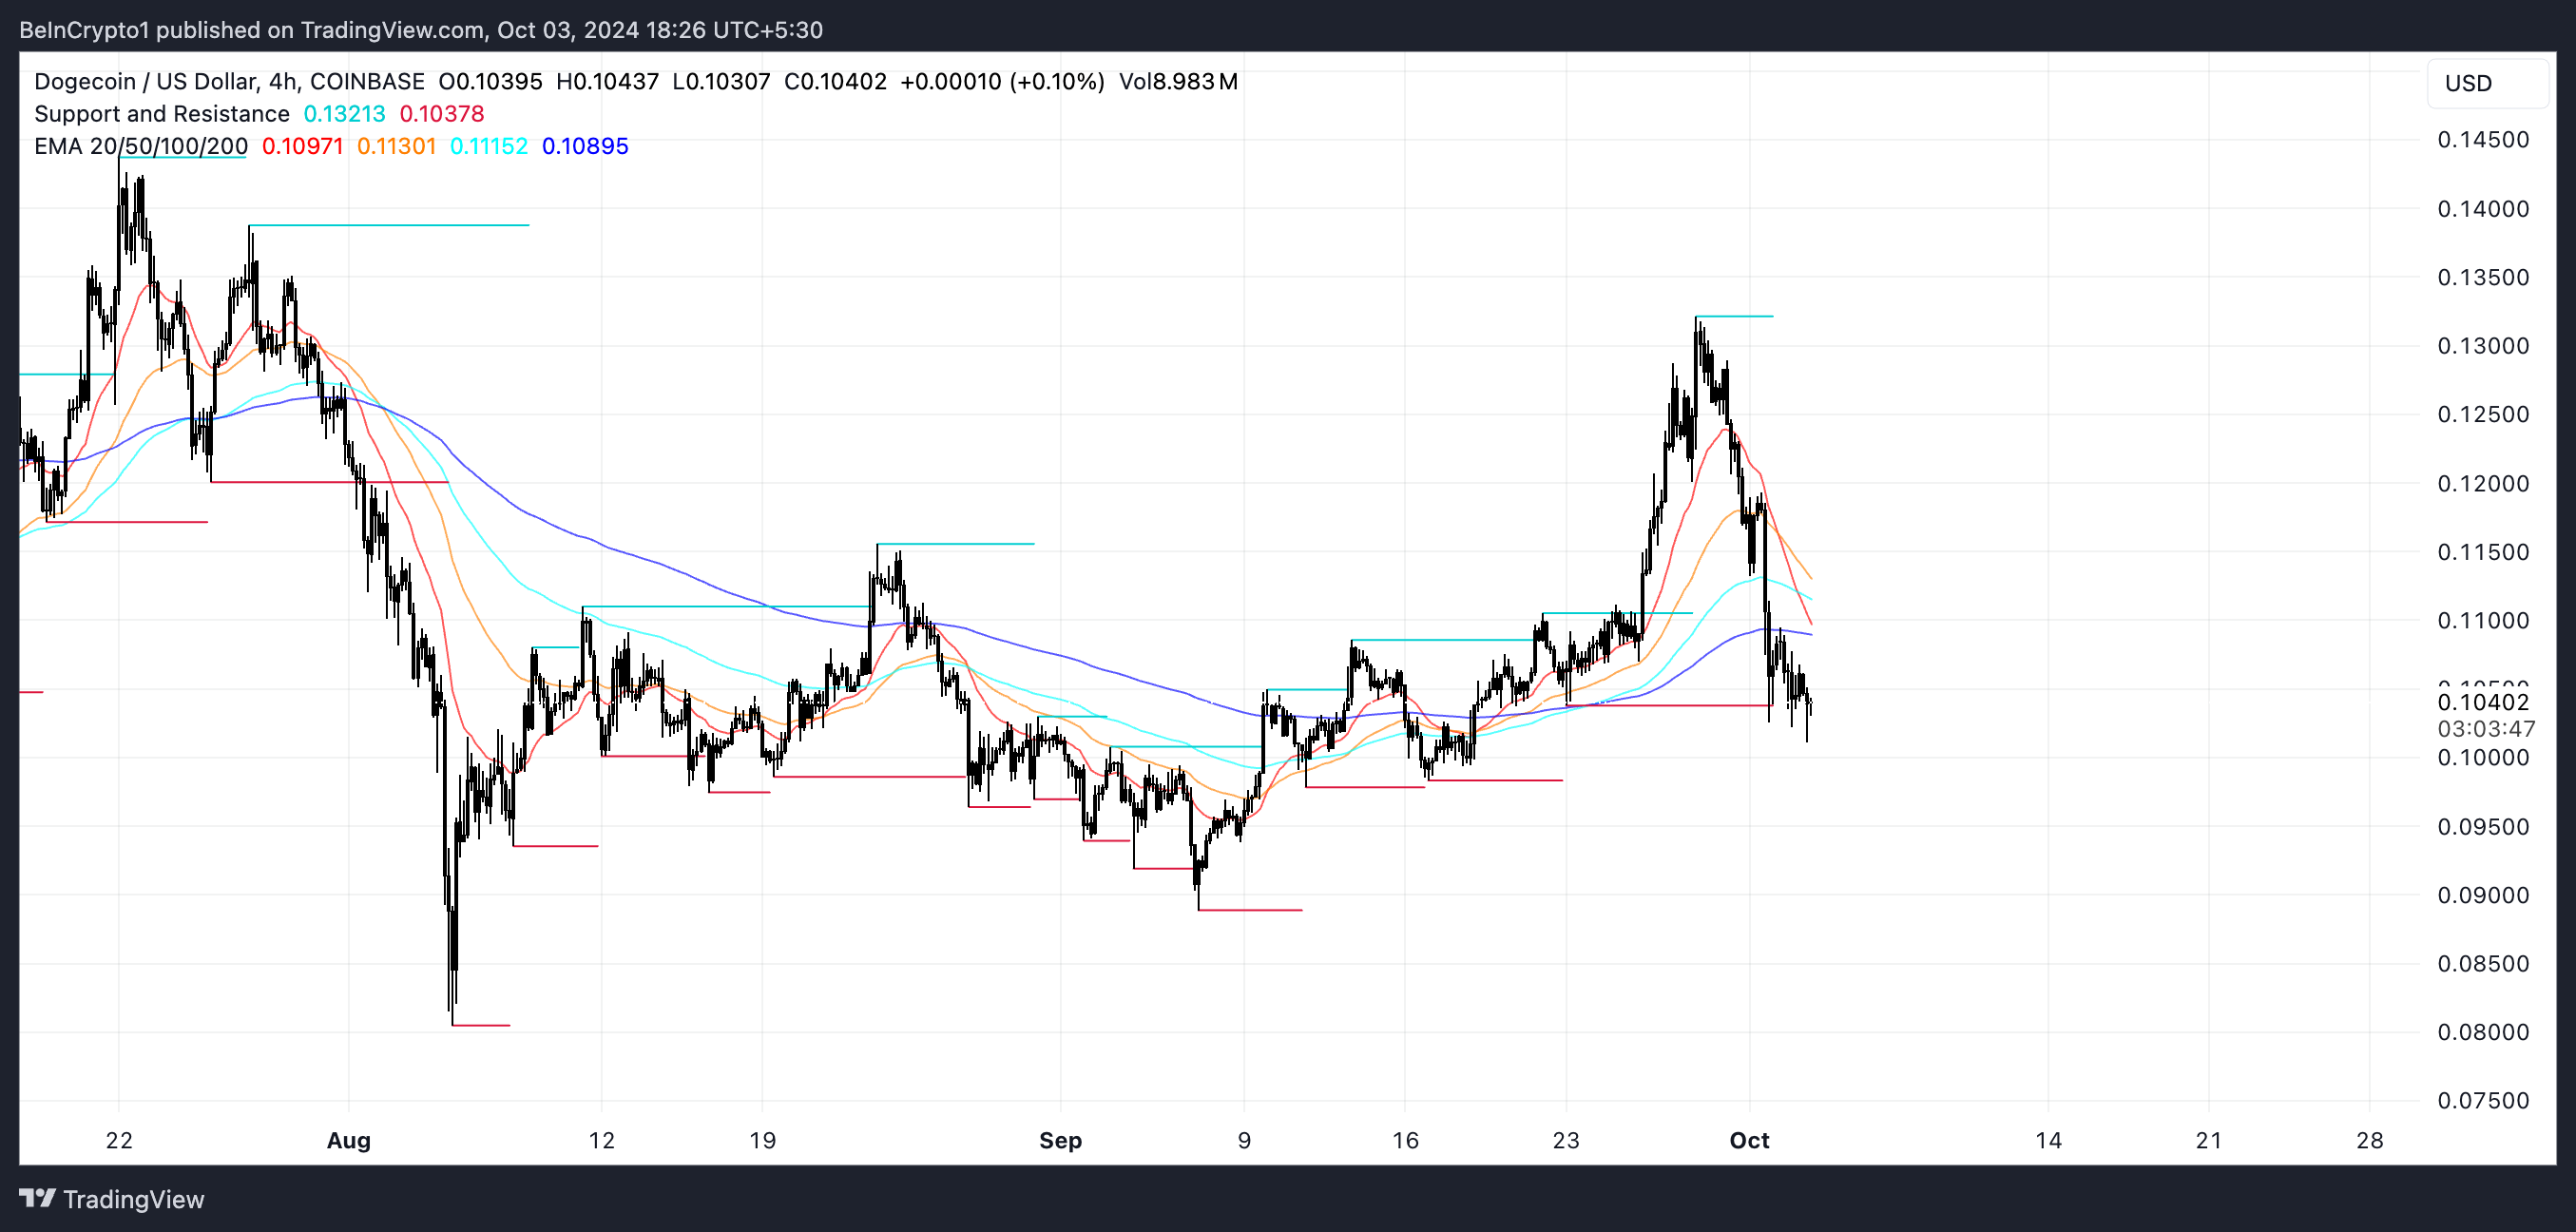 DOGE EMA Lines and Support and Resistance. Source: TradingView
If the downtrend continues, DOGE price is likely to test support around the $0.097 level. Should this support fail to hold, the next key levels could be $0.088 and potentially even as low as $0.080.
However, if the trend reverses, DOGE could retest its resistance levels at $0.108 and $0.11. A break above these could pave the way for a rise toward the $0.13 mark.
Recommended Articles


