Casper Price Prediction: Despite a 40% crash in January, CSPR holders could still see more downside

Source Fxstreet
  • Casper price suffer building overhead pressure despite crashing nearly 40% in the month.
  • CSPR could extend the fall 10% to $0.03337 with technical indicators bearish all through.
  • The bearish thesis would be invalidated if the price makes a decisive close above $0.0550.

Casper (CSPR) price has suffering a terrible first month of 2024, with token holders losing nearly 40% of the token’s market value in a steep run south. The Casper platform is designed to boost the adoption of blockchain technology, smart contracts, and decentralized applications (DApps) on a global scale.

Also Read: Week Ahead: This week’s altcoin narrative and Bitcoin's fourth halving targets

Casper price eyes 10% more losses

Based on the official whitepaper, Casper is optimized to suit both enterprise and developer needs with a mission is to usher in a new era for Web3, as demand for intuitive, interconnected services continues to grow across the board.

Nevertheless, despite such a noble mission, CSPR holders could still suffer an additional 10% losses despite the 40% down shedding exercise that has happened so far in the month. The 10% fall could see CSPR market value slip below the immediate support at $0.0370  before testing the $0.0337 level.

Multiple technical indicators support the downward thesis for Casper price, starting with the nose-diving Moving Average Convergence Divergence (MACD). This indicator is also still moving below its signal line, showing the downside potential remains strong.

The histogram bars of the Awesome Oscillator (AO) are also flashing red, showing the strong presence of the bears in the CSOR market. With both the MACD and the AO still in negative territory, the downside potential for the cryptocurrency remains strong in the daily chart.

Furthermore, the Relative Strength Index (RSI) is also southbound to show momentum is falling. This, coupled with overhead pressure due to the 200-, 100-, and 50-day Simple Moving Averages (SMA), accentuate the bearish thesis.

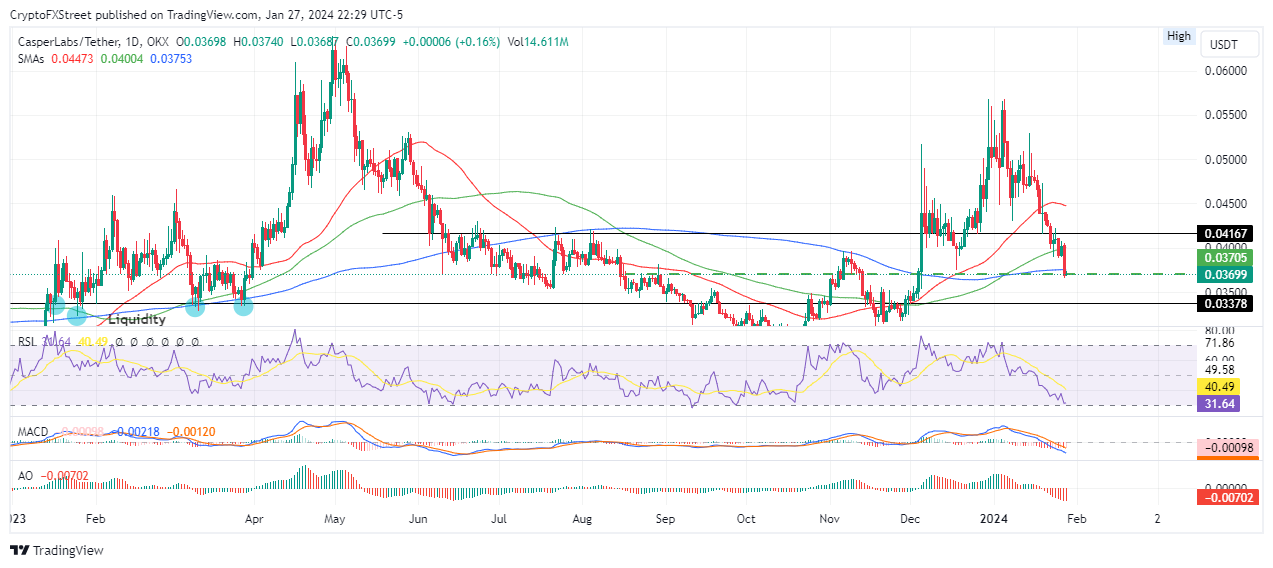
CSPR/USDT 1-day chart

On the flipside, based on the RSI outlook, soon the CSPR price could be oversold, meaning a correction could follow shortly after. Also, if the bulls decide to buy the dip, the Casper price could push north, first overcoming resistance due to the 200-day SMA at $0.0375. Next would be a confrontation with the 100-day SMA at $0.0400 before countering the $0.0416 barricade.

In a highly bullish case, the Casper price could tag the 50-day SMA at $0.0447, standing 20% above current levels.

Disclaimer: For information purposes only. Past performance is not indicative of future results.
placeholder
Crypto’s Great Recovery: Is the Post-Conflict Surge a Sustainable Rally or a Sophisticated Bull Trap?President Trump claimed the war is essentially over, as cryptocurrencies surged across the board and Bitcoin broke through $70,000.
Author  TradingKey
13 hours ago
President Trump claimed the war is essentially over, as cryptocurrencies surged across the board and Bitcoin broke through $70,000.
placeholder
WTI recovers to near $86.50 as Strait of Hormuz remains closedWest Texas Intermediate (WTI), the US crude oil benchmark, is trading around $86.40 during the early Asian trading hours on Tuesday. The WTI price faces extreme volatility following a massive spike to nearly $120 per barrel in the previous session. 
Author  FXStreet
22 hours ago
West Texas Intermediate (WTI), the US crude oil benchmark, is trading around $86.40 during the early Asian trading hours on Tuesday. The WTI price faces extreme volatility following a massive spike to nearly $120 per barrel in the previous session. 
placeholder
International Oil Prices Retreat Rapidly; G-7 to Discuss Emergency Oil Reserve Release On the afternoon of March 9, Beijing time, following a surge in international crude oil prices triggered by escalating geopolitical conflicts in the Middle East, the Group of Seven (G7) u
Author  TradingKey
Yesterday 10: 17
On the afternoon of March 9, Beijing time, following a surge in international crude oil prices triggered by escalating geopolitical conflicts in the Middle East, the Group of Seven (G7) u
placeholder
Gold slumps to near $5,050 on oil-driven inflation fears, stronger US DollarGold price (XAU/USD) falls to around $5,065 during the early Asian session on Monday, pressured by a stronger US Dollar (USD) and inflationary risks. Traders will closely monitor the developments surrounding the US-Iran conflicts and geopolitical risks in the Middle East.
Author  FXStreet
Yesterday 01: 41
Gold price (XAU/USD) falls to around $5,065 during the early Asian session on Monday, pressured by a stronger US Dollar (USD) and inflationary risks. Traders will closely monitor the developments surrounding the US-Iran conflicts and geopolitical risks in the Middle East.
placeholder
On the Eve of Nonfarm Payrolls, How Will Employment Data Affect Stock Market Trends and Rate Cut Expectations?TradingKey - The U.S. Bureau of Labor Statistics will release the February non-farm payroll (NFP) data at 8:30 AM ET on March 6. This release comes as the market is oscillating between Middle East geo
Author  TradingKey
Mar 06, Fri
TradingKey - The U.S. Bureau of Labor Statistics will release the February non-farm payroll (NFP) data at 8:30 AM ET on March 6. This release comes as the market is oscillating between Middle East geo
goTop
quote