MATIC price eyes 5% climb amid reports that Polygon gained over 15 million new users last year
- Polygon price is nurturing an uptrend with a pending buy signal on the RSI.
- MATIC could extend the climb 5% to confront the 100-day SMA at $0.8029.
- Invalidation of bullish outlook will occur if the price breaks and closes below $0.7390
- Reports indicate that Polygon gained more than 15 million new users in 2023.
Polygon (MATIC) price is attempting a recovery rally after a prolonged downtrend. The bulls appear to be making a comeback, despite overhead pressure, but a lot depends on how the bulls will react to the pending buy signal.
Also Read: MATIC price eyes $0.70 despite Polygon network’s plans to launch blockchain aggregation layer
Polygon on-boarded 15 million new users in 2023
Reports suggest that the Polygon chain saw up to 15 million new users join the network in 202, a move that catapulted the blockchain to the second position, after Ethereum, on metrics of cryptocurrency adoption.
Market watchers attribute the heft to Polygon’s developing itself as the choice for builders looking for the most scalable and cost-effective Ethereum Virtual Machine (EVM) environment for their users.
Polygon price outlook
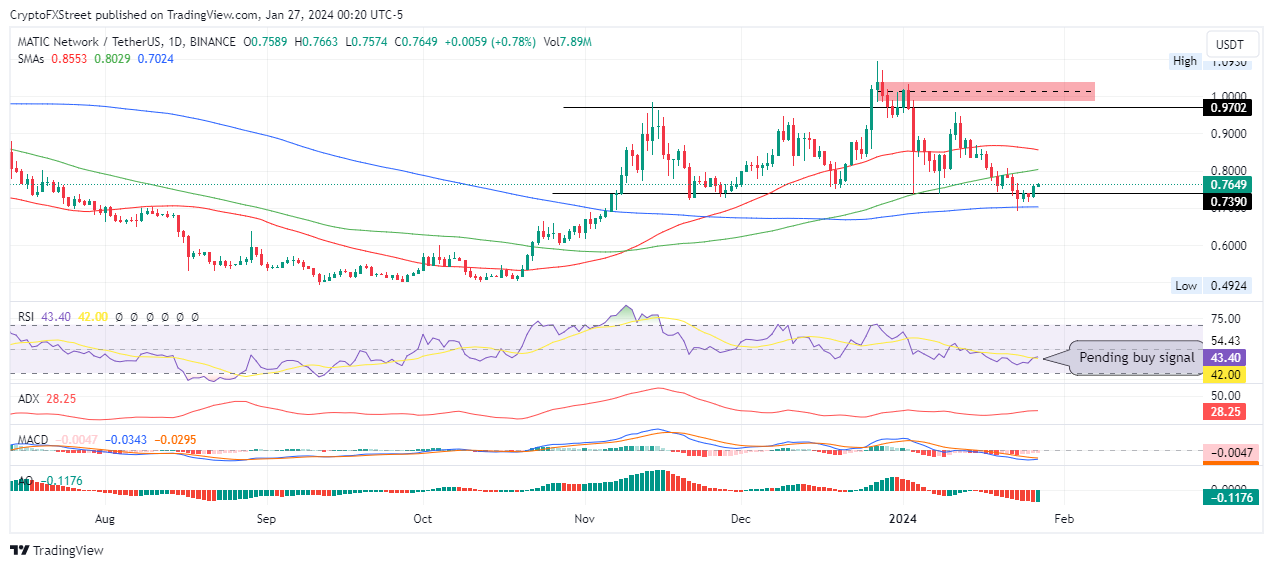
Nevertheless, Polygon price has not performed as well as its adoption metric, with overhead pressure still abounding. It sits atop the support provided by the 200-day Simple Moving Average (SMA) at $0.7024 right below the $$0.7390 critical buyer congestion level, with a pending buy signal on the Relative Strength Index (RSI). If the trajectory of this momentum indicator sustains, it could soon cross above the yellow band, which represents the signal line. Such a crossover is bullish, interpreted as a buy signal.
The ensuing buying pressure could see the Polygon price extend north to tag the 100-day SMA at $0.8029. Further north, it could move higher to confront the 50-day SMA at $0.8553. In a highly bullish case, the gains could see MATIC price reach the $0.9702 blockade.
A flip of the aforementioned barrier into support could see the Polygon price venture into the supply chain, ranging from $0.9833 to $1.0400. A break and close above the midline of this order block at $1.0135 on the daily timeframe would confirm the continuation of the uptrend.
The Moving Average Convergence Divergence (MACD) is inching north and could soon cross above its signal line. In the same way, the histogram bars of the Awesome Oscillator (AO) indicator are turning green, a sign of bulls making headway in the MATIC market.

MATIC/USDT 1-day chart
On the other hand, considering both the MACD and the AO are still in negative territory, bolstered by an RSI that is below the 50 midline, the bears have a tight grip on MATIC. With this, Polygon price could yet fall, potentially losing the support at $0.7390.Such a retraction would invalidate the bullish thesis.
In the dire case, the load-shedding exercise could send MATIC price to the 200-day SMA at $0.7024, below which the $0.6000 psychological level would come into focus.


