Pepe price forecast: Eyes for 30% rally

Source Fxstreet
  • Pepe’s price broke and closed above the descending trendline on Thursday, eyeing for a rally.
  • On-chain data hints at a bullish move as PEPE’s dormant wallets are active, and the long-to-short ratio is above one.
  • A daily candlestick close below $0.0000069 would invalidate the bullish thesis.


Pepe (PEPE) extends the upward movement on Friday after breaking above the descending trendline and resistance barrier on Thursday. PEPE’s dormant wallets are in motion, and the long-to-short ratio is above one, further supporting this bullish move and hinting at a rally on the horizon.


Pepe price shows potential for a rally 

Pepe price broke above the descending trendline (drawn by joining multiple high levels from the end of July to mid-September) and closed above the daily resistance level of $0.0000078 on Thursday. At the time of writing on Friday, it continues to trade higher at around $0.0000083.

If PEPE’s price establishes support near the trendline breakout level, with the previous daily resistance around $0.0000078 acting as support, it could rally 30% to restest its 61.8% Fibonacci retracement level at $0.0000104 (drawn from the July high to the August low).

The Moving Average Convergence Divergence (MACD) indicator further supports PEPE’s rise, signaling a bullish crossover on the daily chart. The MACD line (blue line) moved above the signal line (yellow line), giving a buy signal. Furthermore, the Relative Strength Index (RSI) trades above its neutral level of 50 and tilts higher, indicating strong bullish momentum.
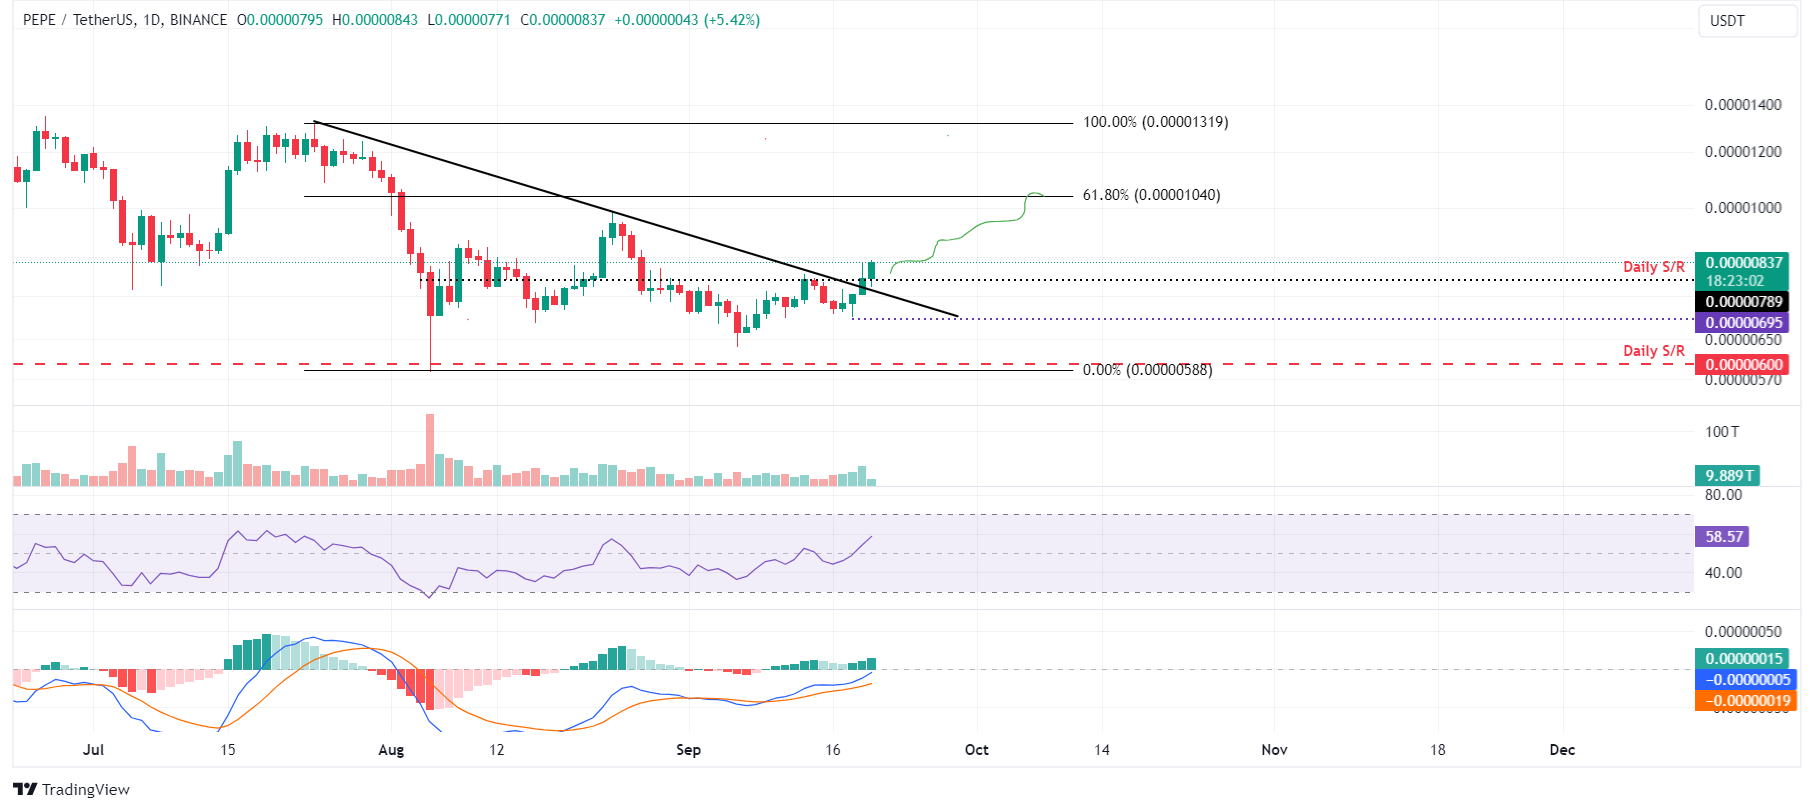
PEPE/USDT daily chart

PEPE/USDT daily chart

PEPE’s on-chain data further supports the bullish thesis. Coinglass’s long-to-short ratio is 1.08, the highest level in one month. This indicates that more traders are betting for the asset’s price to rise.

PEPE long-to-ratio chart

PEPE long-to-ratio chart

Additionally, Santiment’s Age Consumed index aligns with the bullish outlook. The spikes in this index suggest dormant tokens (tokens stored in wallets for a long time) are in motion and can be used to spot short-term local tops or bottoms.

For PEPE, history shows that those spikes were followed by a rally in Pepe’s price. The most recent uptick on September 10 also forecasted that PEPE was ready for an uptrend.

PEPE Age Consumed index chart

PEPE Age Consumed index chart

However, If Pepe’s daily candlestick closes below $0.0000069, it would form a lower low on the daily time frame, thus invalidating the bullish thesis. This development would reduce Pepe’s price by 13% to retest the daily support at $0.0000060.

Disclaimer: For information purposes only. Past performance is not indicative of future results.
placeholder
Top 3 Price Prediction: Bitcoin, Ethereum, Ripple – BTC, ETH and XRP Look for a Foothold After a Sharp ShakeoutBitcoin trades near $92,600 after a dip below $90,000, while Ethereum around $3,118 and XRP near $2.21–$2.23 sit on key support zones, as BTC, ETH and XRP all try to turn a sharp correction into a tradable rebound rather than a deeper slide.
Author  Mitrade
Nov 19, Wed
Bitcoin trades near $92,600 after a dip below $90,000, while Ethereum around $3,118 and XRP near $2.21–$2.23 sit on key support zones, as BTC, ETH and XRP all try to turn a sharp correction into a tradable rebound rather than a deeper slide.
placeholder
Bitcoin Volatility Spikes: Is Options-Driven Pricing Making a Comeback?Bitcoin's volatility is surging, suggesting a shift back to options-driven price action seen before Bitcoin ETFs were launched.
Author  Mitrade
Nov 24, Mon
Bitcoin's volatility is surging, suggesting a shift back to options-driven price action seen before Bitcoin ETFs were launched.
placeholder
2025 Black Friday is coming! Which stocks may see volatility?Coming on the day right after Thanksgiving in the United States, Back Friday marks the start of the holiday shopping season. Sales data from this shopping frenzy day reflects investor confidence and consumer trends. The National Retail Federation (NRF) predicts that holiday season (Nov and Dec) retail sales in 2025 will likely exceed $1 trillion for the very first time, which represents a year-over-year increase of 3.7 to 4.2 percent. Historic data from the past decade show that the retail sector has generally outperformed the S&P 500 during the weeks before and after Black Friday. The following retailing companies are expected to be big winners:
Author  Insights
Nov 24, Mon
Coming on the day right after Thanksgiving in the United States, Back Friday marks the start of the holiday shopping season. Sales data from this shopping frenzy day reflects investor confidence and consumer trends. The National Retail Federation (NRF) predicts that holiday season (Nov and Dec) retail sales in 2025 will likely exceed $1 trillion for the very first time, which represents a year-over-year increase of 3.7 to 4.2 percent. Historic data from the past decade show that the retail sector has generally outperformed the S&P 500 during the weeks before and after Black Friday. The following retailing companies are expected to be big winners:
placeholder
Gold Price Forecast: XAU/USD rises to near $4,150 as Fed rate cut bets growGold price (XAU/USD) attracts some buyers to around $4,140 during the early Asian session on Tuesday. The precious metal rises on growing expectations of a US Federal Reserve (Fed) interest rate cut in the December policy meeting.
Author  FXStreet
Yesterday 01: 29
Gold price (XAU/USD) attracts some buyers to around $4,140 during the early Asian session on Tuesday. The precious metal rises on growing expectations of a US Federal Reserve (Fed) interest rate cut in the December policy meeting.
placeholder
Bitcoin Bleeds to $86K, But This Key Indicator Screams "The Top Isn't In"Bitcoin’s adjusted Spent Output Profit Ratio (aSOPR) has spent nearly two years coiling below the extremes seen at past bull-market peaks, even as BTC trades around $86,300 and down 9% on the week — a setup that leaves open the possibility that this cycle’s true top may still lie ahead.
Author  Mitrade
19 hours ago
Bitcoin’s adjusted Spent Output Profit Ratio (aSOPR) has spent nearly two years coiling below the extremes seen at past bull-market peaks, even as BTC trades around $86,300 and down 9% on the week — a setup that leaves open the possibility that this cycle’s true top may still lie ahead.
goTop
quote