

Near Protocol Price Forecast: NEAR leads recovery, eyes 100% upswing
- Near Protocol price has registered a 21% recovery rally after retesting the $2.57 to $2.70 resistance level.
- Investors can expect this bounce to continue until it retests the $5.87 weekly hurdle.
- A decisive three-day candlestick close below $2.57 will invalidate the bullish thesis for NEAR.
Near Protocol (NEAR) price shows strong signs of buying pressure as it leads the recovery rally with a 21% upswing in the last three days. The bounce off a key support level could lead to massive gains in the next few days.
Also read: Bitcoin price decline triggers nearly $83 million in liquidations, BTC price recovers from drop below $39,000
Near Protocol price ready to bounce
Near Protocol price breached the $2.57 to $2.70 resistance zone on December 18, 2023. This breakout was followed by a 62% rally, which led to a local top formation at $4.63. As the broader cryptocurrency market suffered a 47% sell-off, NEAR retested the recently flipped hurdle into a support floor.
Despite the short-term correction, Near Protocol price has recovered quickly and rallied 21% in the last three days and currently trades at $2.96. The three-day Relative Strength Index (RSI) is bouncing off the 50-mean level, which adds credence to the continuation of the bounce.
The Awesome Oscillator is in the positive region and is close to retesting its mean level at zero and restarting the bullish momentum.
Going forward, investors can expect Near Protocol price to kickstart a 100% rally to the next key weekly resistance level of $5.87.
Read more: Near Protocol price consolidation hints NEAR could retest $6.50 soon
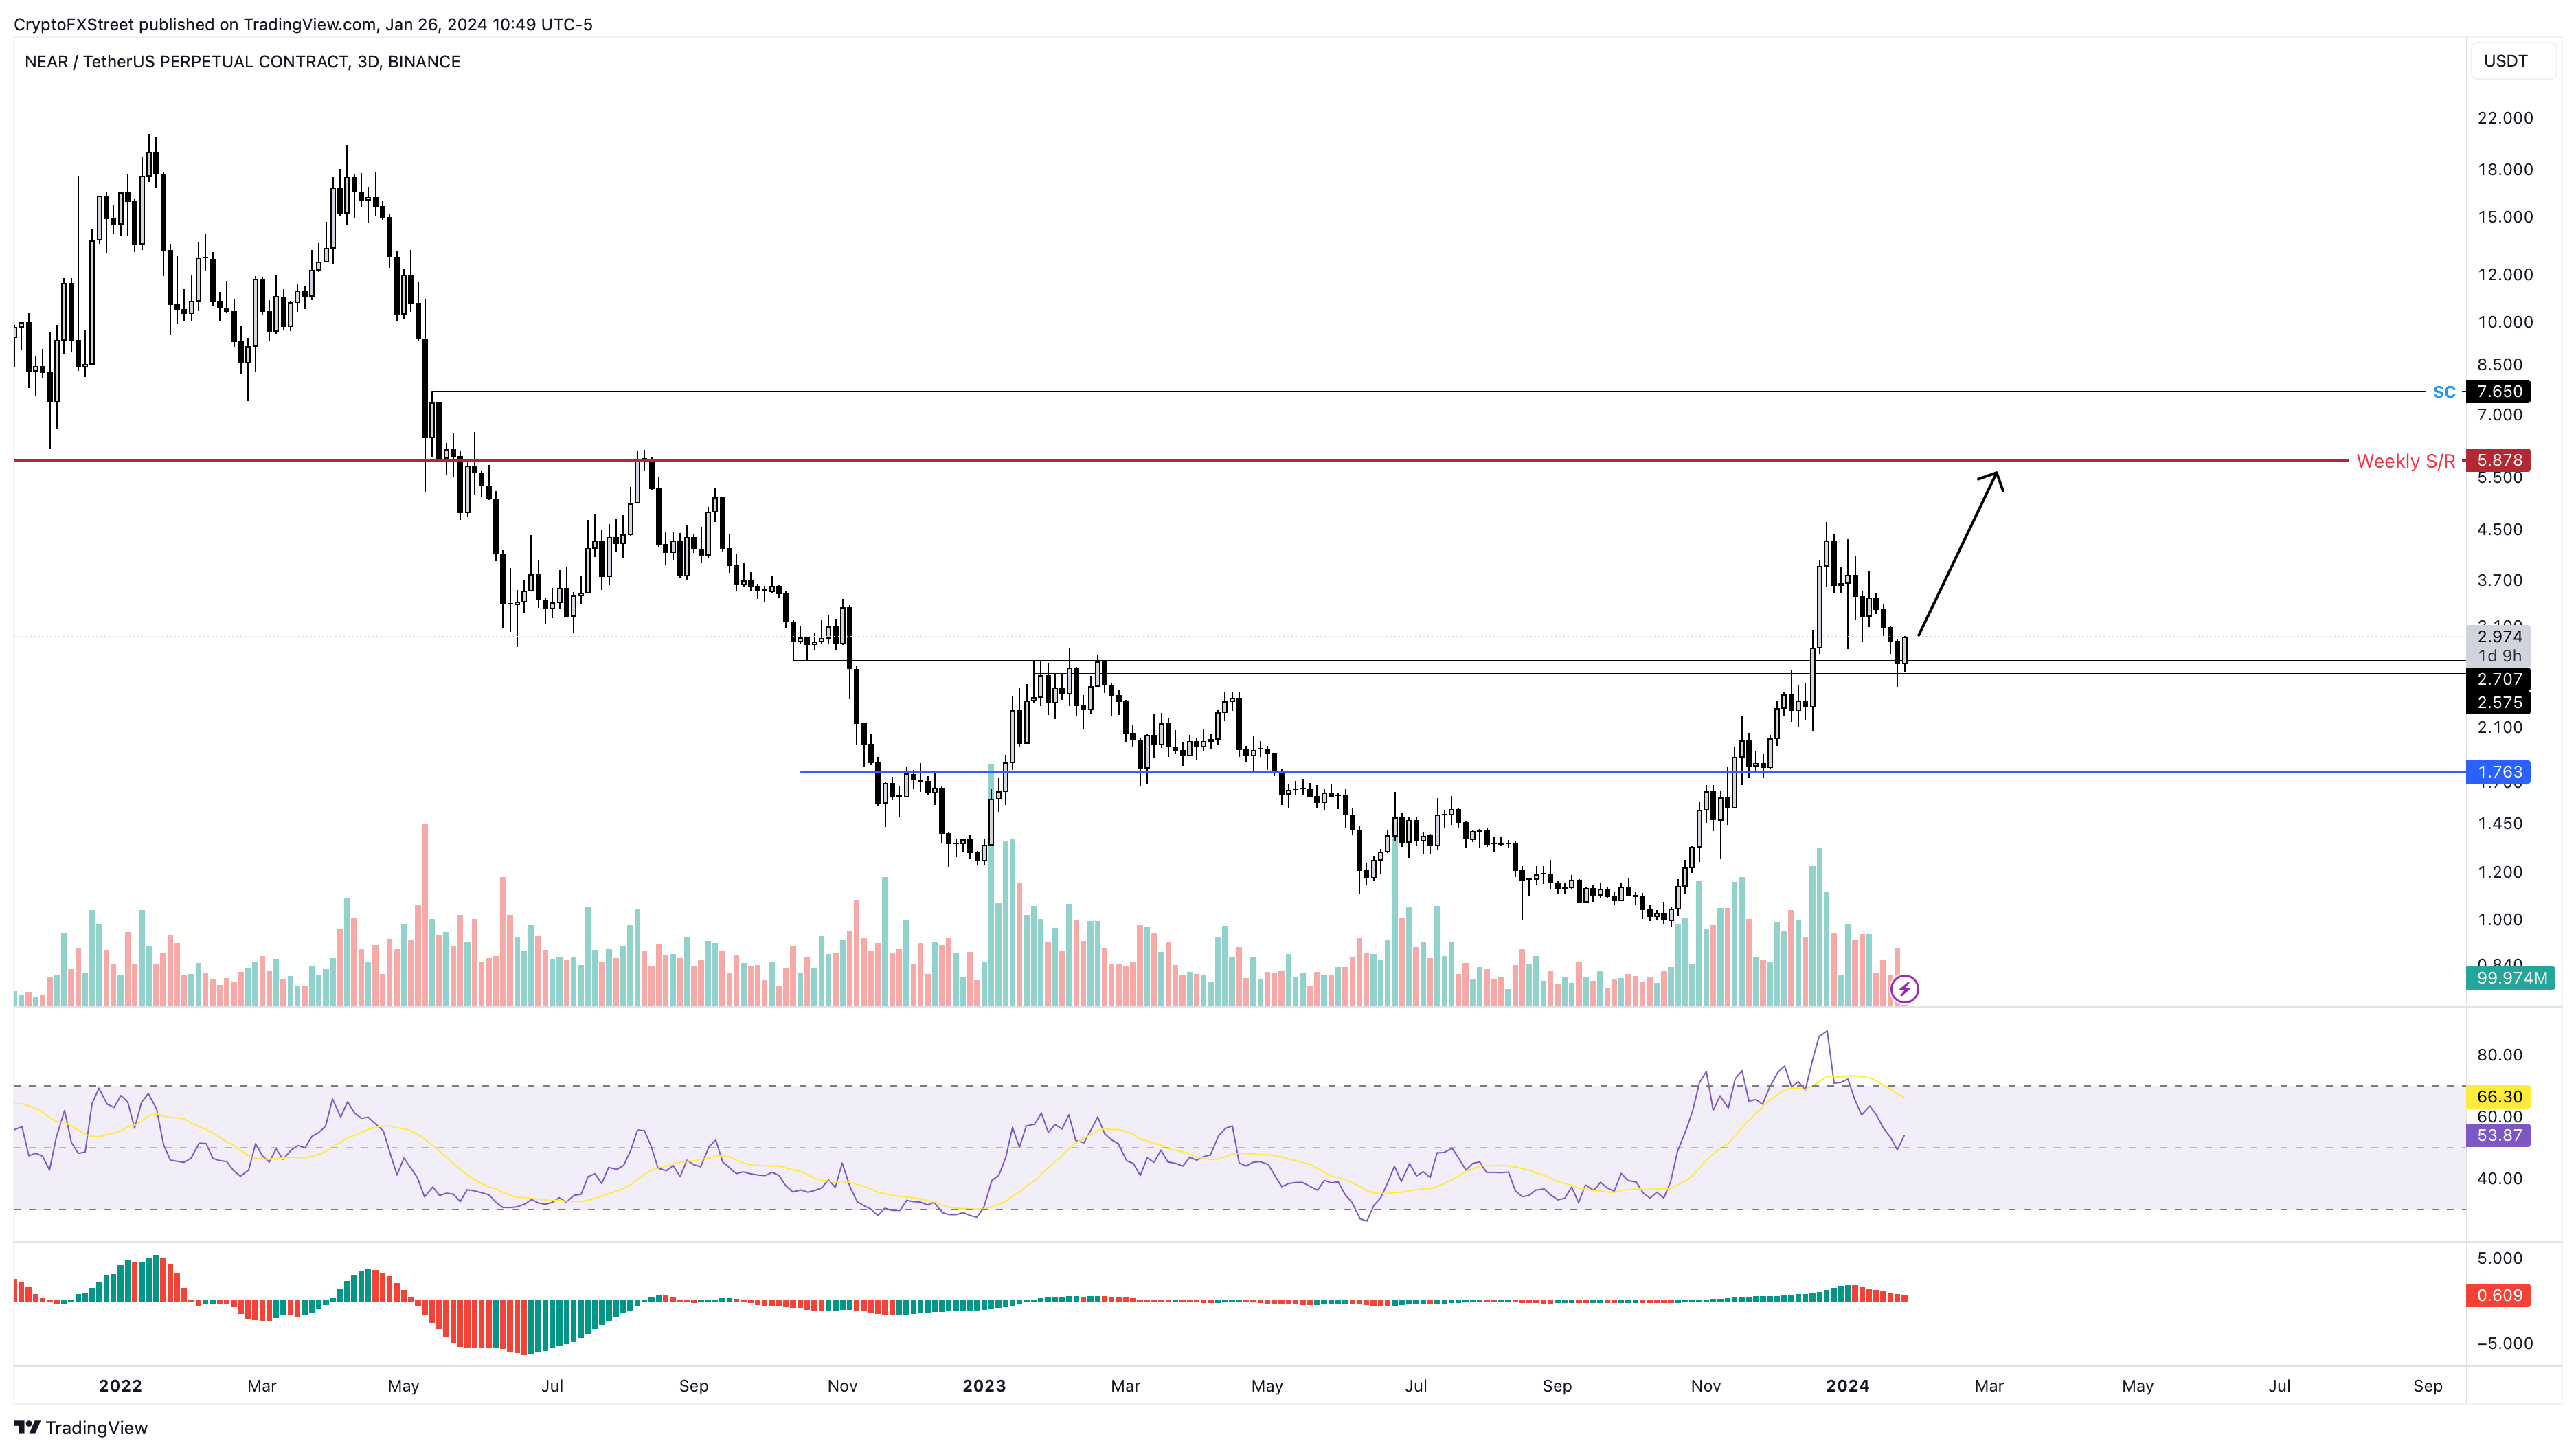
NEAR/USDT 3-day chart
On the other hand, if the Near Protocol price fails to hold above the $2.57 to $2.70 support level, it would denote a weakness in buying pressure. This outlook could occur due to another sell–off in Bitcoin price, which could collectively cause massive liquidations in altcoins.
In such a case, NEAR could slide 31% to retest the next critical support level at $1.76.
Recommended Articles


