

Bitcoin’s Momentum Builds, But Reclaiming $60,000 is Crucial, Says Analyst

Source Newsbtc

Bitcoin continues to show volatility in the market, with bulls slowly gaining momentum, but key resistance levels remain a challenge.

$90,000 Is In Play, But This First

Renowned crypto analyst Captain Faibik recently shared his bullish outlook for Bitcoin, forecasting that the asset could touch $68,000 by the end of this month if it successfully reclaims the critical $60,000 level.

Faibik emphasized that a daily candle close above $60,000 would be crucial for pushing Bitcoin toward new highs by December.

Faibik also highlighted the potential for a Broadening Wedge pattern breakout, which could push Bitcoin’s price to between $88,000 and $90,000 by the end of Q4.
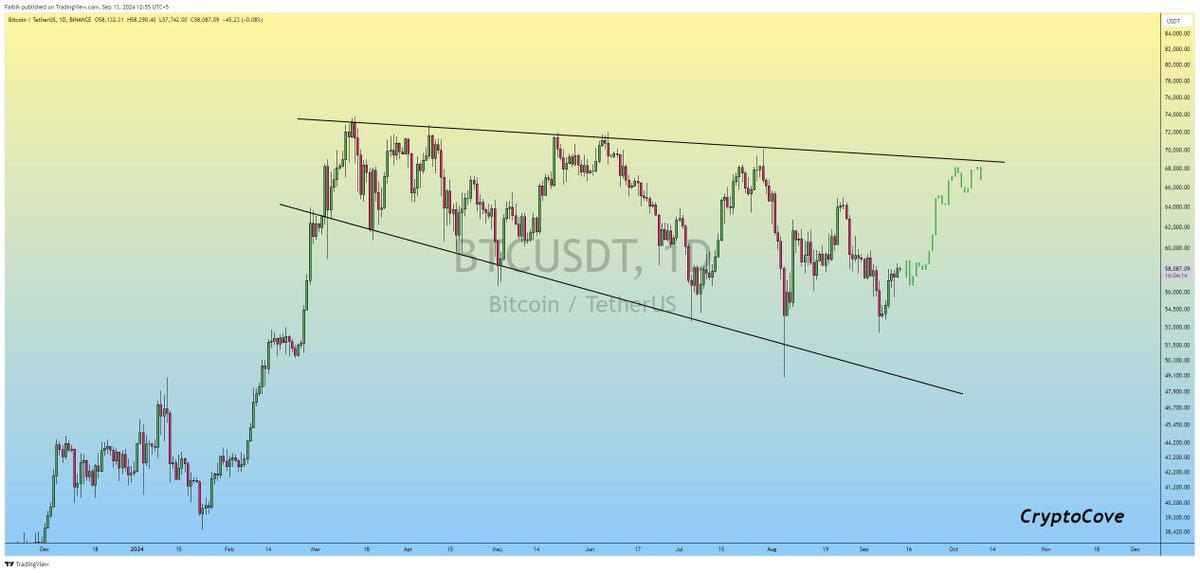
Bitcoin price chart.

For context, a Broadening Wedge pattern typically signals increasing volatility and can indicate a possible reversal or continuation depending on market momentum. If Bitcoin breaks out of this pattern to the upside, as Faibik predicts, it could mark the next significant bullish run for the cryptocurrency.

Short To Macro Term Outlook On Bitcoin

Another renowned crypto analyst, Willy Woo, provided his take on the current market, sharing his short, medium and macro term outlook on Bitcoin’s bullish potential.

Woo suggests that while Bitcoin is not technically in a bear market, the digital asset is in a “re-accumulation” phase, a period of consolidation that could signal a potential move toward new all-time highs.

Woo emphasizes that, in the short term, a bullish swing could occur within the next 1-3 weeks, but more time is needed for Bitcoin to break above previous all-time highs.

As for the medium term, Woo pointed out that since the halving event in April, Bitcoin’s demand and supply signals have been bearish, though recent weeks have shown signs of a potential reversal. However, these signals are still “unconfirmed,” it could take more time for Bitcoin to push toward a new all-time high.

Bitcoin (BTC) price chart on TradingView

Moreover, macroeconomic conditions could significantly influence Bitcoin’s price movement. Woo referenced the dropping bond rates as a potential risk signal for traditional financial markets.

In past examples, such as the 2020 COVID-19 crash and the 2008 financial crisis, falling bond rates preceded crashes that were followed by liquidity-fueled rallies across all asset classes, including Bitcoin.

Should a similar pattern emerge, BTC could benefit from a broader liquidity rally, though the risk of short-term declines remains.

Featured image created with DALL-E, Chart from TradingView

Disclaimer: For information purposes only. Past performance is not indicative of future results.
placeholder
WTI (USOIL) Is down 2.03% on Sep 25: Here Is WhyWTI (USOIL) is down 2.03% at Sep 24 22:20(UTC+0), now at $92.517, with a 7-day down of 3.63%.What is driving WTI (USOIL)’s stock price down today?The drop in WTI crude oil prices was primarily driven by
Author  TradingKey
12 hours ago
WTI (USOIL) is down 2.03% at Sep 24 22:20(UTC+0), now at $92.517, with a 7-day down of 3.63%.What is driving WTI (USOIL)’s stock price down today?The drop in WTI crude oil prices was primarily driven by
placeholder
Silver Price Forecast: XAG/USD remains steady near $64.00 as oil prices easeSilver price (XAG/USD) inches higher after two days of losses, trading around $63.90 per troy ounce during Asian hours on Friday. Non-yielding Silver is finding underlying support as inflation concerns ease following a pullback in crude oil prices.
Author  FXStreet
13 hours ago
Silver price (XAG/USD) inches higher after two days of losses, trading around $63.90 per troy ounce during Asian hours on Friday. Non-yielding Silver is finding underlying support as inflation concerns ease following a pullback in crude oil prices.
placeholder
Gold Price Forecast: Gold Drops Below $4,300, Will It Continue to Fall? As of the European session on September 24, gold prices (XAUUSD) extended their correction, dipping below $4,300 intraday to hit a low of $4,262.45. After previously rebounding close to $
Author  TradingKey
Yesterday 09: 57
As of the European session on September 24, gold prices (XAUUSD) extended their correction, dipping below $4,300 intraday to hit a low of $4,262.45. After previously rebounding close to $
placeholder
Yen touches 158.37 as Tokyo reopens, then slips back — ¥15.4 trillion of intervention and the 200-day line stand between here and 160USD/JPY reached 158.37 overnight, its highest since early September, then eased to 157.88 as Japanese markets reopened after a three-day holiday. The Ministry of Finance has spent ¥15.4 trillion defending the yen since late July and the BOJ ran a rate check on September 18. The 200-day average sits at 158.43.
Author  Irene Q.
Yesterday 06: 59
USD/JPY reached 158.37 overnight, its highest since early September, then eased to 157.88 as Japanese markets reopened after a three-day holiday. The Ministry of Finance has spent ¥15.4 trillion defending the yen since late July and the BOJ ran a rate check on September 18. The 200-day average sits at 158.43.
placeholder
US input costs rose at the fastest pace in four years — the September flash PMI beat is an inflation story, not a growth storyUS September flash PMIs came in far above expectations, with the composite at 58.4, a five-year high. But the detail that moved markets was input cost inflation at its fastest since October 2022, driven by fuel, transport and supply shortages. Brent is back above $100 and the 10-year Treasury yield has hit its highest since 2007.
Author  Suzie
Yesterday 06: 46
US September flash PMIs came in far above expectations, with the composite at 58.4, a five-year high. But the detail that moved markets was input cost inflation at its fastest since October 2022, driven by fuel, transport and supply shortages. Brent is back above $100 and the 10-year Treasury yield has hit its highest since 2007.
goTop
quote