Ethereum transaction volume surges to four month peak as ETH price risks decline to $2,000

Source Fxstreet
  • Ethereum noted a massive surge in transaction volume on Thursday, at a four-month peak of 4.37 million.
  • Ethereum whales are engaged in profit-taking and Ether is at risk of correcting lower.
  • ETH price could nosedive to its psychologically important level of $2,000, in the event of a sell-off. 

Ethereum transaction volume noted a surge on January 25, according to Santiment data. This increase in transactions indicates that there was a large volume exchange of Ether between market participants on exchange platforms. Typically this can be a bullish or bearish indicator depending on whether traders are realizing profits or losses, and the asset’s price trend. 

At the time of writing, Ethereum price is $2,217. 

Also read: Ethereum traders realize nearly $33 million in losses as overheated futures market cools

Ethereum on-chain metrics signal risk of price decline

Ethereum’s on-chain metric, Transaction Volume, has hit a four-month peak on January 25. Santiment data reveals that there was a surge in transactions as market participants witnessed large volume transfers by institutions like bankrupt crypto lender Celsius. 

ETH

Ethereum Transaction Volume. Source: Santiment 

Large wallet addresses in the Ethereum network have engaged in profit-taking, as seen in the chart below. When the Whale Transaction Count, valued at $100,000 and higher, is combined with Network Realized Profit/Loss, the data reveals that whales are realizing profits. 

Santiment data therefore supports the likelihood of a correction in ETH price.

ETH

Whale Transaction Count and Network Realized Profit/ Loss. Source: Santiment 

Ethereum price at risk of decline

Ethereum price is in a downward trend that started on January 12. Since then, the altcoin has formed lower highs and lower lows, and broken below a key trendline. Ethereum price is currently below two key Exponential Moving Averages (EMAs), the 10-day and 50-day, at $2,325, and $2,308. 

If Ethereum price continues correcting, it is likely to find support at $2,165, a level that has acted as support for the altcoin since December 3. If ETH price fails to hold above this level, the altcoin could nosedive to its psychologically important level of $2,000, as seen in the chart below.

ETH

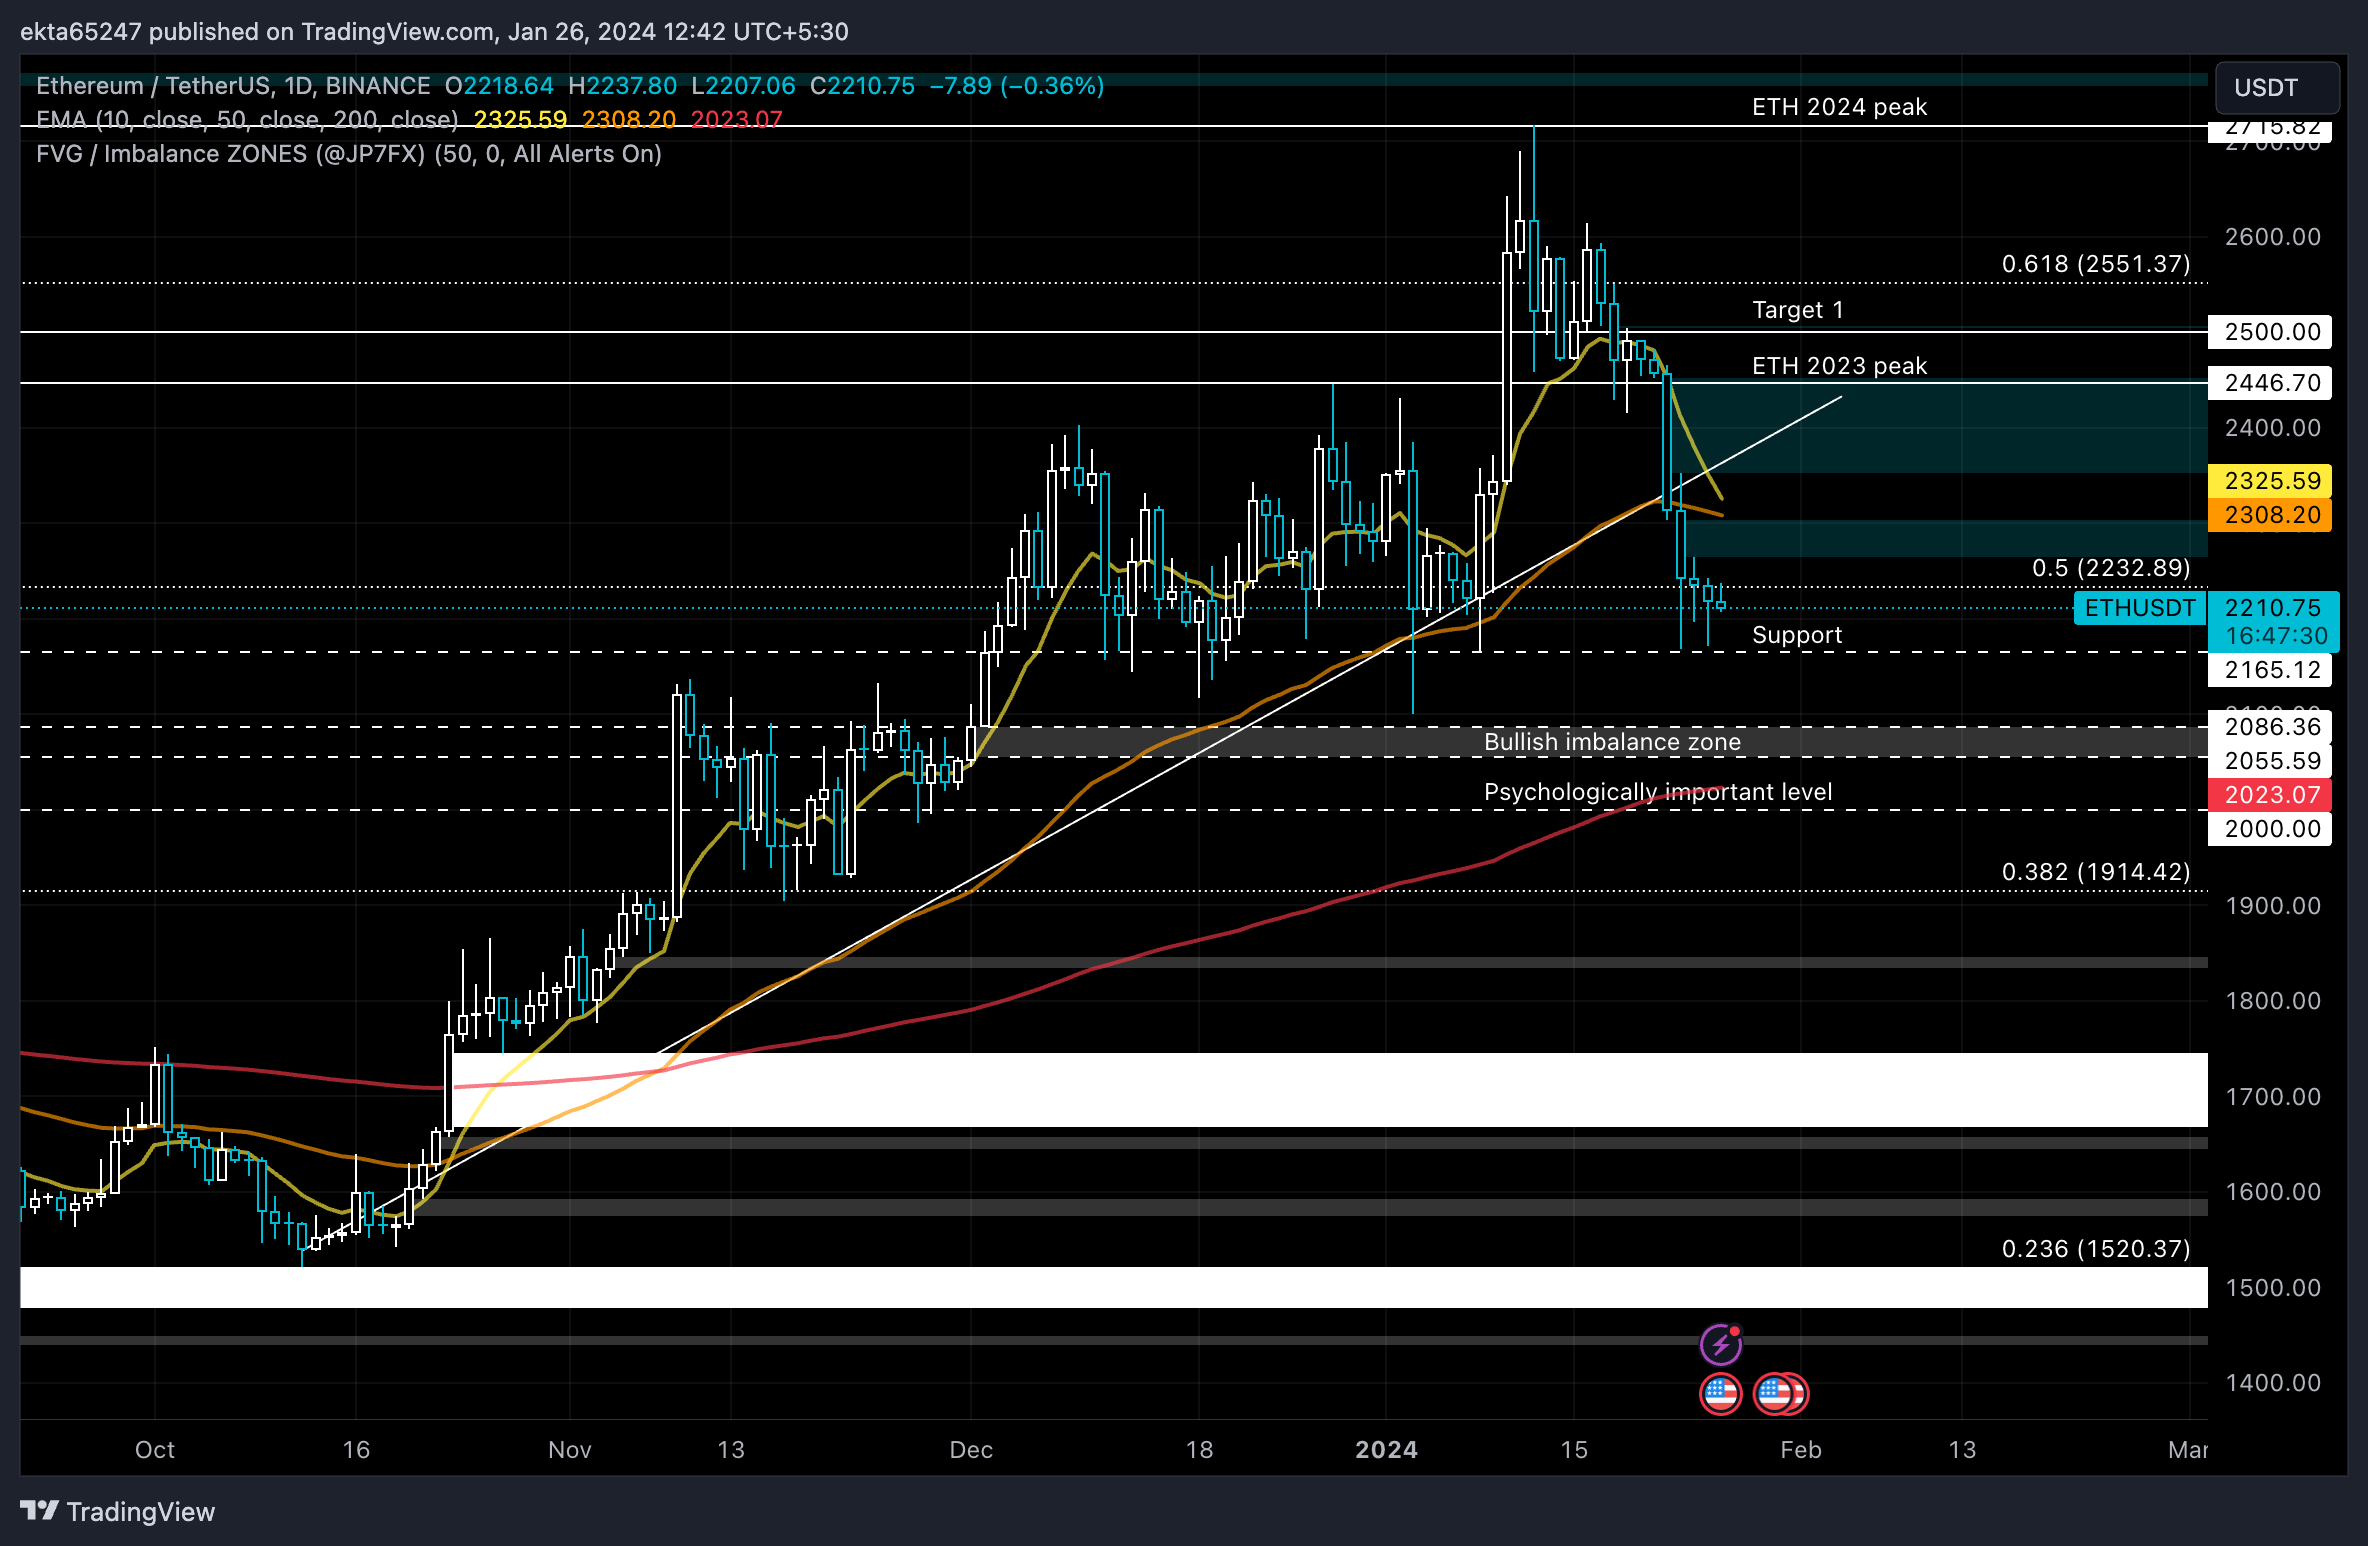
ETH/USDT 1-day chart 

A daily candlestick close above the $2,232 level could invalidate the bearish thesis for Ethereum price. 

Disclaimer: For information purposes only. Past performance is not indicative of future results.
placeholder
Markets in 2026: Will gold, Bitcoin, and the U.S. dollar make history again? — These are how leading institutions thinkAfter a turbulent 2025, what lies ahead for commodities, forex, and cryptocurrency markets in 2026?
Author  Insights
Dec 25, 2025
After a turbulent 2025, what lies ahead for commodities, forex, and cryptocurrency markets in 2026?
placeholder
ECB Policy Outlook for 2026: What It Could Mean for the Euro’s Next MoveWith the ECB likely holding rates steady at 2.15% and the Fed potentially extending cuts into 2026, EUR/USD may test 1.20 if Eurozone growth proves resilient, but weaker growth and an ECB pivot could pull the pair back toward 1.13 and potentially 1.10.
Author  Mitrade
Dec 26, 2025
With the ECB likely holding rates steady at 2.15% and the Fed potentially extending cuts into 2026, EUR/USD may test 1.20 if Eurozone growth proves resilient, but weaker growth and an ECB pivot could pull the pair back toward 1.13 and potentially 1.10.
placeholder
My Top 5 Stock Market Predictions for 2026Five 2026 market predictions written in a native, news-style voice: AI’s winners and losers, broader sector leadership, dividend demand, valuation cooling as the Shiller CAPE sits at 39 (Dec. 31, 2025), and quantum-computing bursts—while keeping all original facts and numbers unchanged.
Author  Mitrade
Jan 06, Tue
Five 2026 market predictions written in a native, news-style voice: AI’s winners and losers, broader sector leadership, dividend demand, valuation cooling as the Shiller CAPE sits at 39 (Dec. 31, 2025), and quantum-computing bursts—while keeping all original facts and numbers unchanged.
placeholder
Financial Markets 2026: Volatility Catalysts in Gold, Silver, Oil, and Blue-Chip Stocks—A CFD Trader's OutlookGet a comprehensive financial market 2026 outlook exploring key economic drivers, volatility catalysts in gold, oil and stocks, and what the evolving economic outlook means for cfd trading strategies and risk management on global markets.
Author  Rachel Weiss
May 15, Fri
Get a comprehensive financial market 2026 outlook exploring key economic drivers, volatility catalysts in gold, oil and stocks, and what the evolving economic outlook means for cfd trading strategies and risk management on global markets.
placeholder
Euro softens to near 1.1600 on US–Iran tensions The EUR/USD pair trades in negative territory around 1.1615 during the early Asian session on Monday. The Euro (EUR) extends the decline as the prolonged US-Iran conflict weighs on the riskier assets.
Author  FXStreet
8 hours ago
The EUR/USD pair trades in negative territory around 1.1615 during the early Asian session on Monday. The Euro (EUR) extends the decline as the prolonged US-Iran conflict weighs on the riskier assets.
Related Instrument
goTop
quote