

Bitcoin On-Chain Health Remains ‘Net Positive’: ARK Invest Report

Source Newsbtc

Although Bitcoin (BTC) on-chain health remains net positive, from a price perspective two crucial support levels must be maintained for a continued bullish uptrend, notes ARK Invest in its latest monthly report.

Bitcoin’s Healthy On-Chain Metrics, What Does It Mean?

In its report, ARK Invest posits that Bitcoin requires some upside if its market structure is to be maintained. The report notes that in August 2024, BTC’s price slid by 8.7% to $58,972. The leading digital asset was also unable to overcome its 200-day moving average, making two key support areas at $52,000 and $46,000 critical for its bullish momentum.

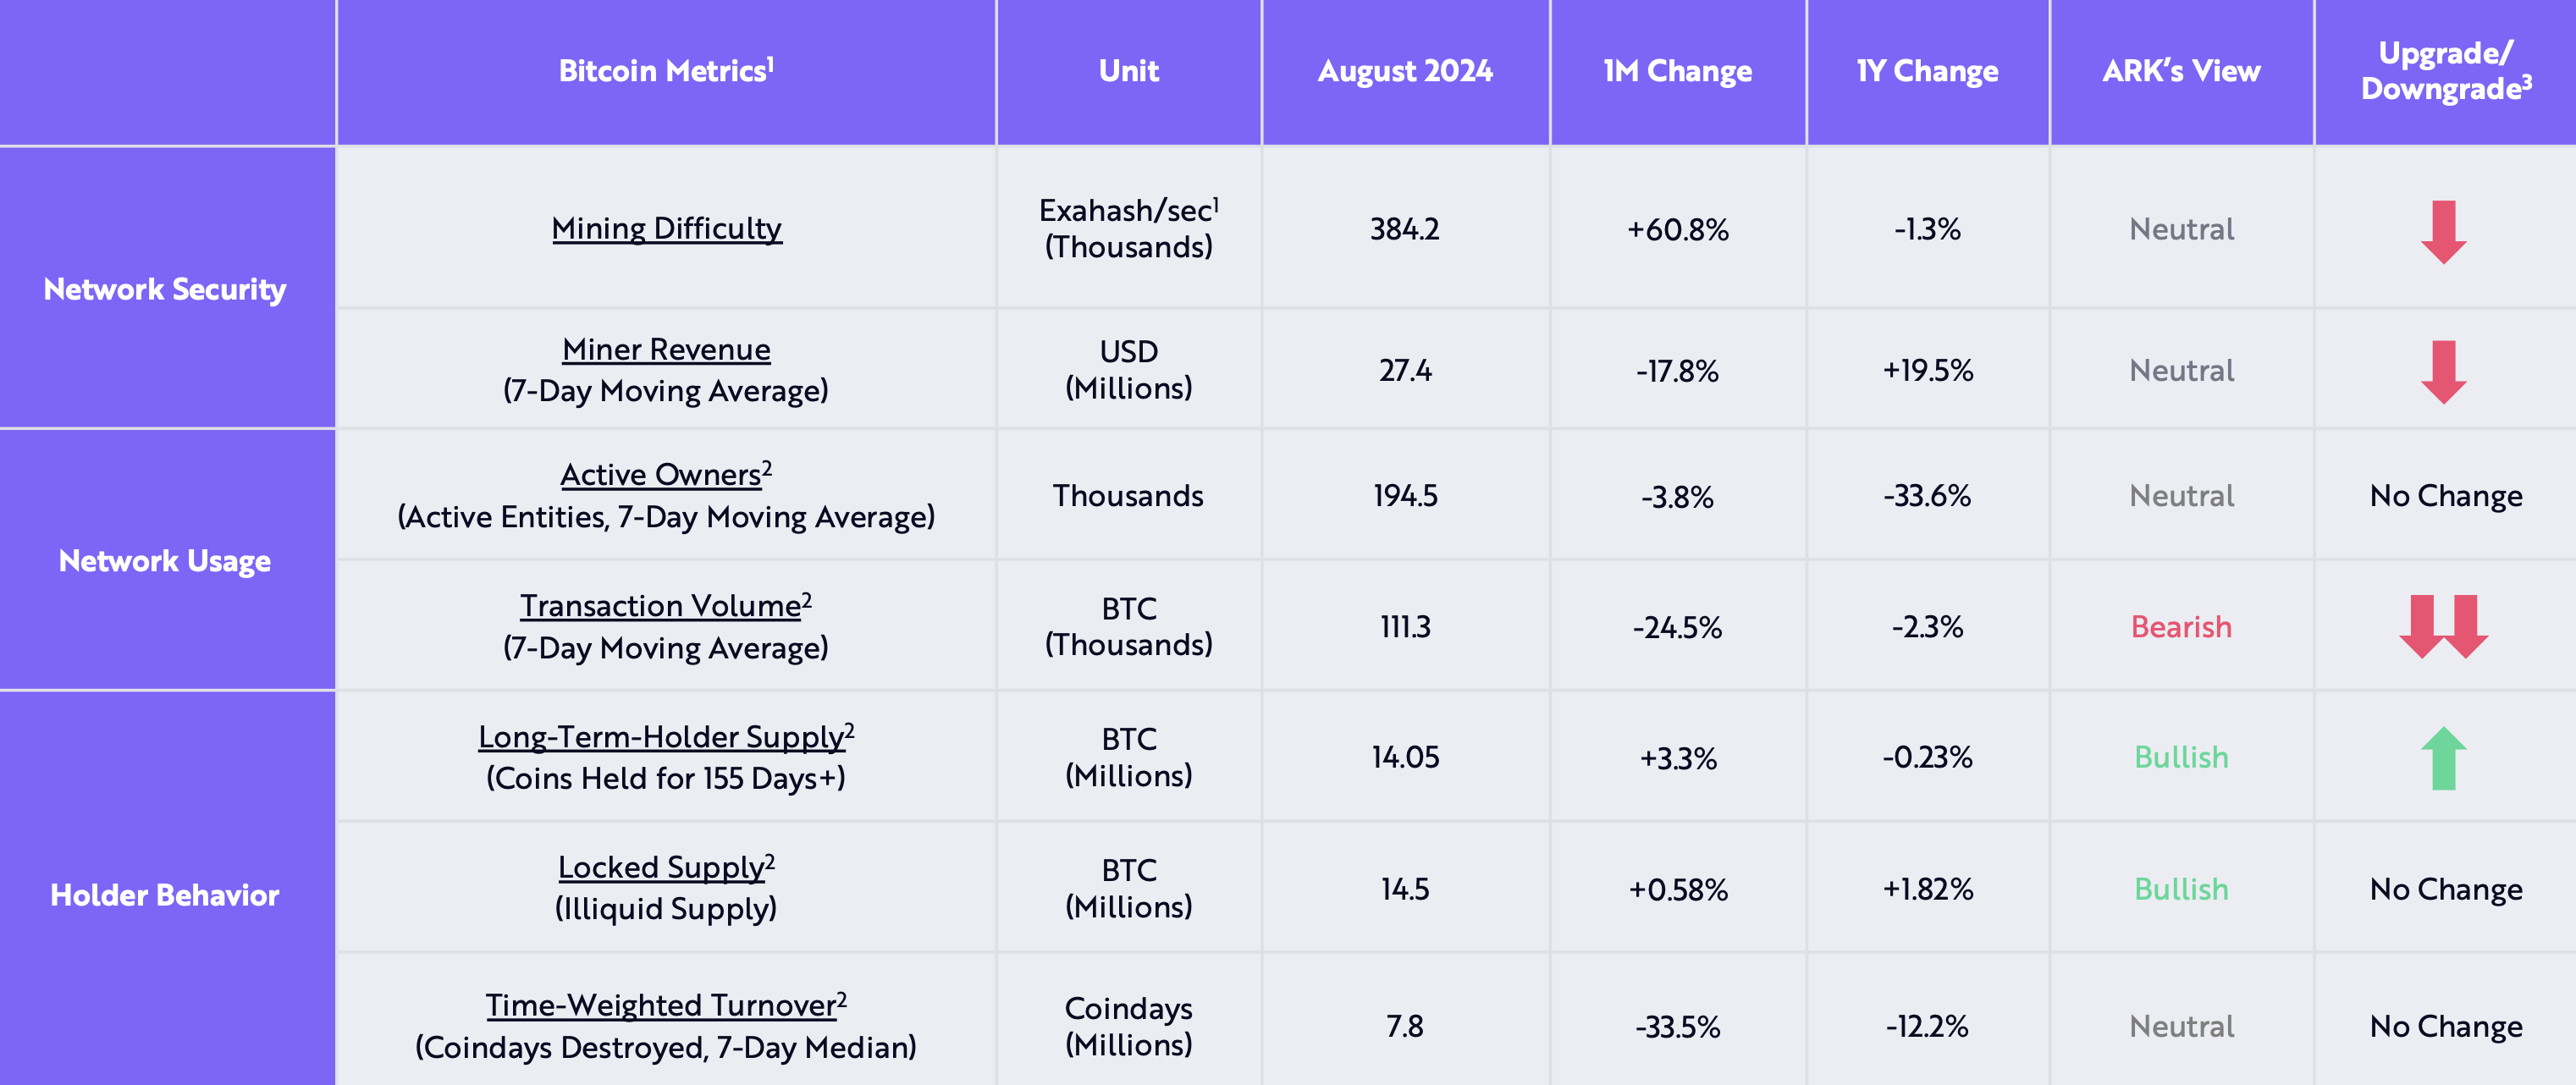
The report states that despite the temporary headwinds faced by Bitcoin, its on-chain health remains ‘net positive.’ Essentially, the Bitcoin network is net bullish across different on-chain metrics such as network security, network usage, and holder behavior.

Bitcoin’s long-term holder supply, or BTC held for more than 155 days by holders, is up 3.3% month-over-month (MoM) and down a marginal 0.23% year-over-year (YoY). In addition, Bitcoin’s locked supply has increased in both MoM and YoY terms by 0.58% and 1.82%, respectively. 
bitcoin on-chain health

Bitcoin’s transaction volume has tumbled by 24.5% MoM and 2.3% YoY, a bearish on-chain indicator. However, Bitcoin’s bullish on-chain metrics overshadow the one bearish indicator, allowing its on-chain health to remain net positive.

Another key performance indicator strengthening ARK Invest’s bullish stance on Bitcoin is its short-to-long liquidation dominance. Essentially, this metric measures short-term liquidations relative to long-term liquidations over the last 90 days, and found that it’s at its lowest since Q2 2023.  

Bitcoin ETF Investors Underwater At Large

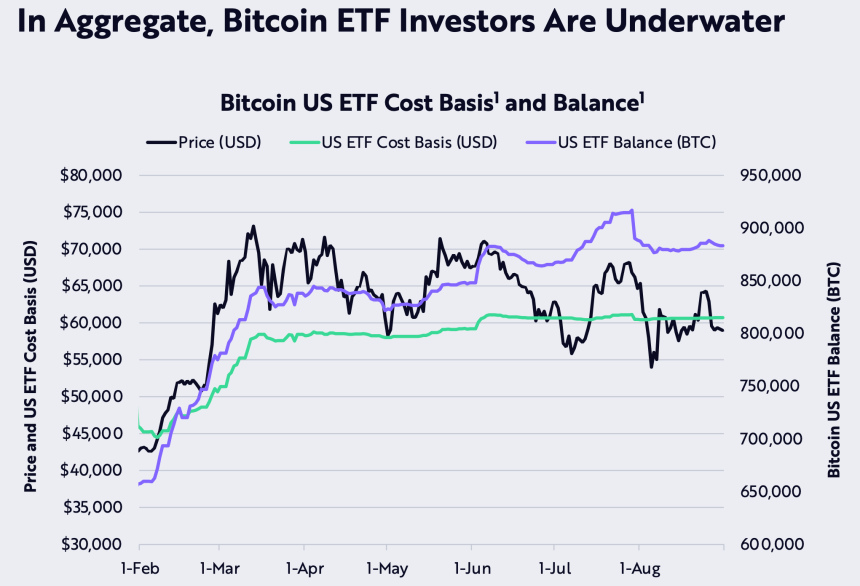
The report highlights that at the end of August 2024, the estimated cost basis of US spot exchange-traded-fund (ETF) participants was higher than BTC’s price, hinting that the average ETF investor may be at a loss. The higher estimated cost basis of US spot ETF participants compared to its price can be confirmed from the chart below.
The US Securities and Exchange Commission (SEC) approved spot Bitcoin ETF earlier this year, which made it easier for institutional and retail investors to gain exposure to the world’s largest cryptocurrency through a compliant investment product. 

Bitcoin ETFs are witnessing unprecedented interest from institutional investors. Specifically, Wall Street titans such as Goldman Sachs and Morgan Stanley have poured millions of dollars into Bitcoin ETFs. Conversely, Ethereum ETFs haven’t yet piqued institutional interest at comparable levels.

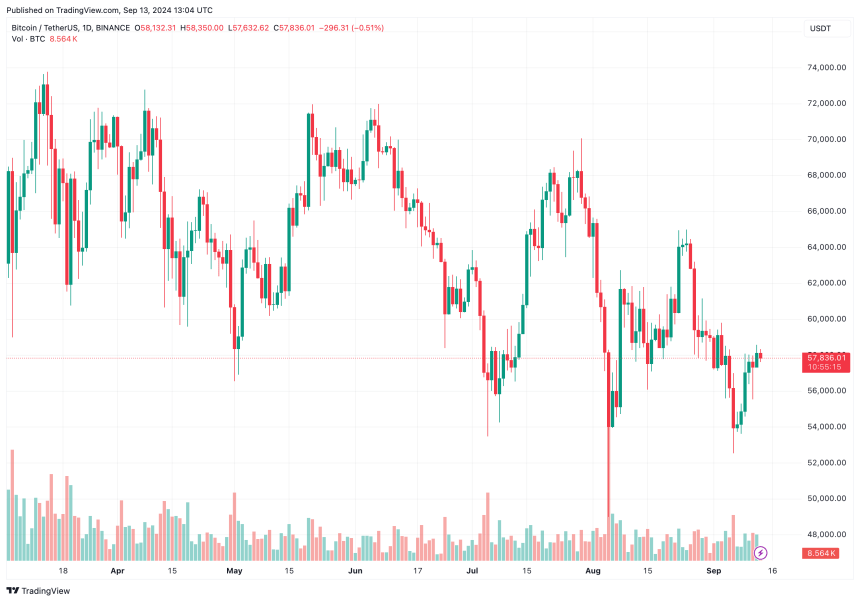
At press time, Bitcoin trades at $57,836, up a minimal 0.2% in the past 24 hours. BTC’s total market cap stands at $1.14 trillion.
bitcoin
Disclaimer: For information purposes only. Past performance is not indicative of future results.
placeholder
Strong profits, falling shares: bank earnings day one meets a memory-chip rout — with CPI and ASML aheadGoldman Sachs blew past estimates (EPS $17.01 vs $13.09 expected, profit +33%) while JPMorgan missed ($5.75 vs $5.93) and Wells Fargo fell 3% — yet the S&P 500 finished flat at 7,805.45, pinned below its record close as a memory-chip rout (SOX −2.67%, Micron under $1,000) kept the pressure on. Tonight brings the week's decider: US September CPI at 8:30 ET, then Bank of America, Morgan Stanley, BlackRock and ASML before the open. Here are the levels, both cases, and the watch list.
Author  Irene Q.
Oct 14, Wed
Goldman Sachs blew past estimates (EPS $17.01 vs $13.09 expected, profit +33%) while JPMorgan missed ($5.75 vs $5.93) and Wells Fargo fell 3% — yet the S&P 500 finished flat at 7,805.45, pinned below its record close as a memory-chip rout (SOX −2.67%, Micron under $1,000) kept the pressure on. Tonight brings the week's decider: US September CPI at 8:30 ET, then Bank of America, Morgan Stanley, BlackRock and ASML before the open. Here are the levels, both cases, and the watch list.
placeholder
US September CPI recap: inflation hits 3.7% as core runs hot — is an October Fed hike back on the table?September CPI landed hot: headline 3.7% y/y, core 2.6% y/y and 0.3% m/m. October hike odds jumped from ~22% to ~37% — yet the dollar faded to 101.74, gold closed higher and the S&P 500 fell 1.11%. Here is the full repricing, the levels and what to watch next.
Author  Irene Q.
Oct 15, Thu
September CPI landed hot: headline 3.7% y/y, core 2.6% y/y and 0.3% m/m. October hike odds jumped from ~22% to ~37% — yet the dollar faded to 101.74, gold closed higher and the S&P 500 fell 1.11%. Here is the full repricing, the levels and what to watch next.
placeholder
Gold Price Analysis Today | Forex Gold Analysis | XAU/USD Analysis - October 15, 2026Get the latest gold price analysis, forex gold insights, and XAU/USD analysis for October 15, 2026. Read on for the details.
Author  Mitrade
20 hours ago
Get the latest gold price analysis, forex gold insights, and XAU/USD analysis for October 15, 2026. Read on for the details.
placeholder
Today’s Market Recap: U.S. Stocks Rebound, Dow Jumps Over 1%, Micron Gains 1.87%, CoreWeave Rallies Nearly 6%Tracking the Market TrendTradingKey - On October 15, Eastern Time, U.S. September PPI data posted its largest monthly and annual gains since 2022, prompting investors to shift from AI tech stocks to d
Author  TradingKey
Yesterday 01: 20
Tracking the Market TrendTradingKey - On October 15, Eastern Time, U.S. September PPI data posted its largest monthly and annual gains since 2022, prompting investors to shift from AI tech stocks to d
placeholder
Gold Price Analysis Today | Forex Gold Analysis | XAU/USD Analysis - October 16, 2026Get the latest gold price analysis, forex gold insights, and XAU/USD analysis for October 16, 2026. Read on for the details.
Author  Mitrade
20 hours ago
Get the latest gold price analysis, forex gold insights, and XAU/USD analysis for October 16, 2026. Read on for the details.
goTop
quote