

XRP gains as Ripple CLO calls out SEC for stance on crypto asset securities,regulator apologizes for confusion
- Ripple Chief Legal Officer Stuart Alderoty comments on SEC’s definition of crypto asset securities.
- SEC faces criticism for referring to crypto tokens as securities and apologizes for confusion in footnotes of Binance lawsuit.
- Alderoty points out inconsistencies in the SEC’s regulatory approach towards the crypto industry in 2017 and 2024, influencing the Ripple lawsuit.
- XRP gains over 1% on Friday, trades at $0.5695 at the time of writing.
XRP posts gains for a second consecutive day on Friday, extending Thursday’s surge, as Ripple Chief Legal Officer (CLO) Stuart Alderoty and Coinbase’s CLO Paul Grewal slammed the US Securities & Exchange Commission (SEC) stance over the usage of the term “crypto asset securities.”
The regulator clarified its use of the term “crypto asset securities” (that has no legal basis per Alderoty) and apologized for the confusion caused through an amendment to footnotes in the SEC vs. Binance lawsuit.
Daily digest market movers: Ripple, Coinbase CLO slam regulator for wrongly referring to crypto tokens as securities
- Crypto legal experts and CLOs of several exchanges and firms such as Ripple and Coinbase critiqued the SEC’s use of the term “crypto asset securities” in its lawsuits.
"The SEC regrets any confusion it may have invited" by falsely and repeatedly stating that tokens themselves are securities. This is the remarkable representation in Footnote 6 of @SECGov's Amended Complaint against Binance. I hope @s_alderoty is getting some good sleep tonight.… pic.twitter.com/PpbprvkGxh
— paulgrewal.eth (@iampaulgrewal) September 13, 2024
- Crypto market participants watch the SEC’s next steps closely as Ripple CLO previously stated that the regulator’s use of the term likely misleads judges in crypto lawsuits and “has no legal basis.” The term “crypto asset securities” implies that crypto tokens are inherently securities.
The term 'crypto asset security' is nowhere to be found in any statute—it's a fabricated term with no legal basis. The SEC needs to stop trying to deceive judges by using it. pic.twitter.com/CyNbUbeoYM
— Stuart Alderoty (@s_alderoty) September 2, 2024
- The SEC clarified its usage of the term and said it “regrets any confusion” caused by its use by amending footnotes in its lawsuit against Binance.
- The SEC’s statements in 2017 and 2024, seven years apart, are contradictory, per Stuart Alderoty. Ripple’s CLO points out in a tweet that the SEC admits that the term “crypto asset security” is not real. Alderoty believes that the regulator likely used the term to prove that “crypto asset security” is an investment contract and the SEC needed evidence of "contracts, expectations, and understandings.”
So the SEC finally admits that 1/ "crypto asset security" is a made up term and 2/ to prove a "crypto asset security" is an investment contract, the SEC needs evidence of a bundle of "contracts, expectations, and understandings"?
— Stuart Alderoty (@s_alderoty) September 13, 2024
Think it's time for @SECgov to admit it has… https://t.co/iJIYTnNvxs pic.twitter.com/E58Pft7irc
- The SEC’s definition of securities and how it applies to crypto is important to traders since it is considered when determining whether a crypto token is a “security.” XRP gained legal clarity as a non-security when Judge Torres ruled that the altcoin is not an investment contract when traded on secondary markets or exchanges.
- Another market maker likely influencing XRP price is Grayscale’s announcement on Thursday of an investment trust for the asset. Institutional capital inflow could boost the adoption and demand for XRP Ledger’s native asset, likely driving gains.
Technical analysis: XRP could rally 9% and target $0.6217
Ripple has been in a downward trend since its July 2023 top of $0.9380. Since then, the altcoin reached a low of $0.3823 in July 2024. XRP recovered somewhat afterwards, but in the last few months it has traded broadly sideways within a range between $0.6586 and $0.4319.
XRP trades at $0.5695 on Friday and could gain 9% if it reaches $0.6217, which aligns with the upper boundary of the Fair Value Gap (FVG) in the XRP/USDT daily chart.
The Moving Average Convergence Divergence (MACD) indicator shows green histogram bars above the neutral line, suggesting underlying positive momentum in XRP.
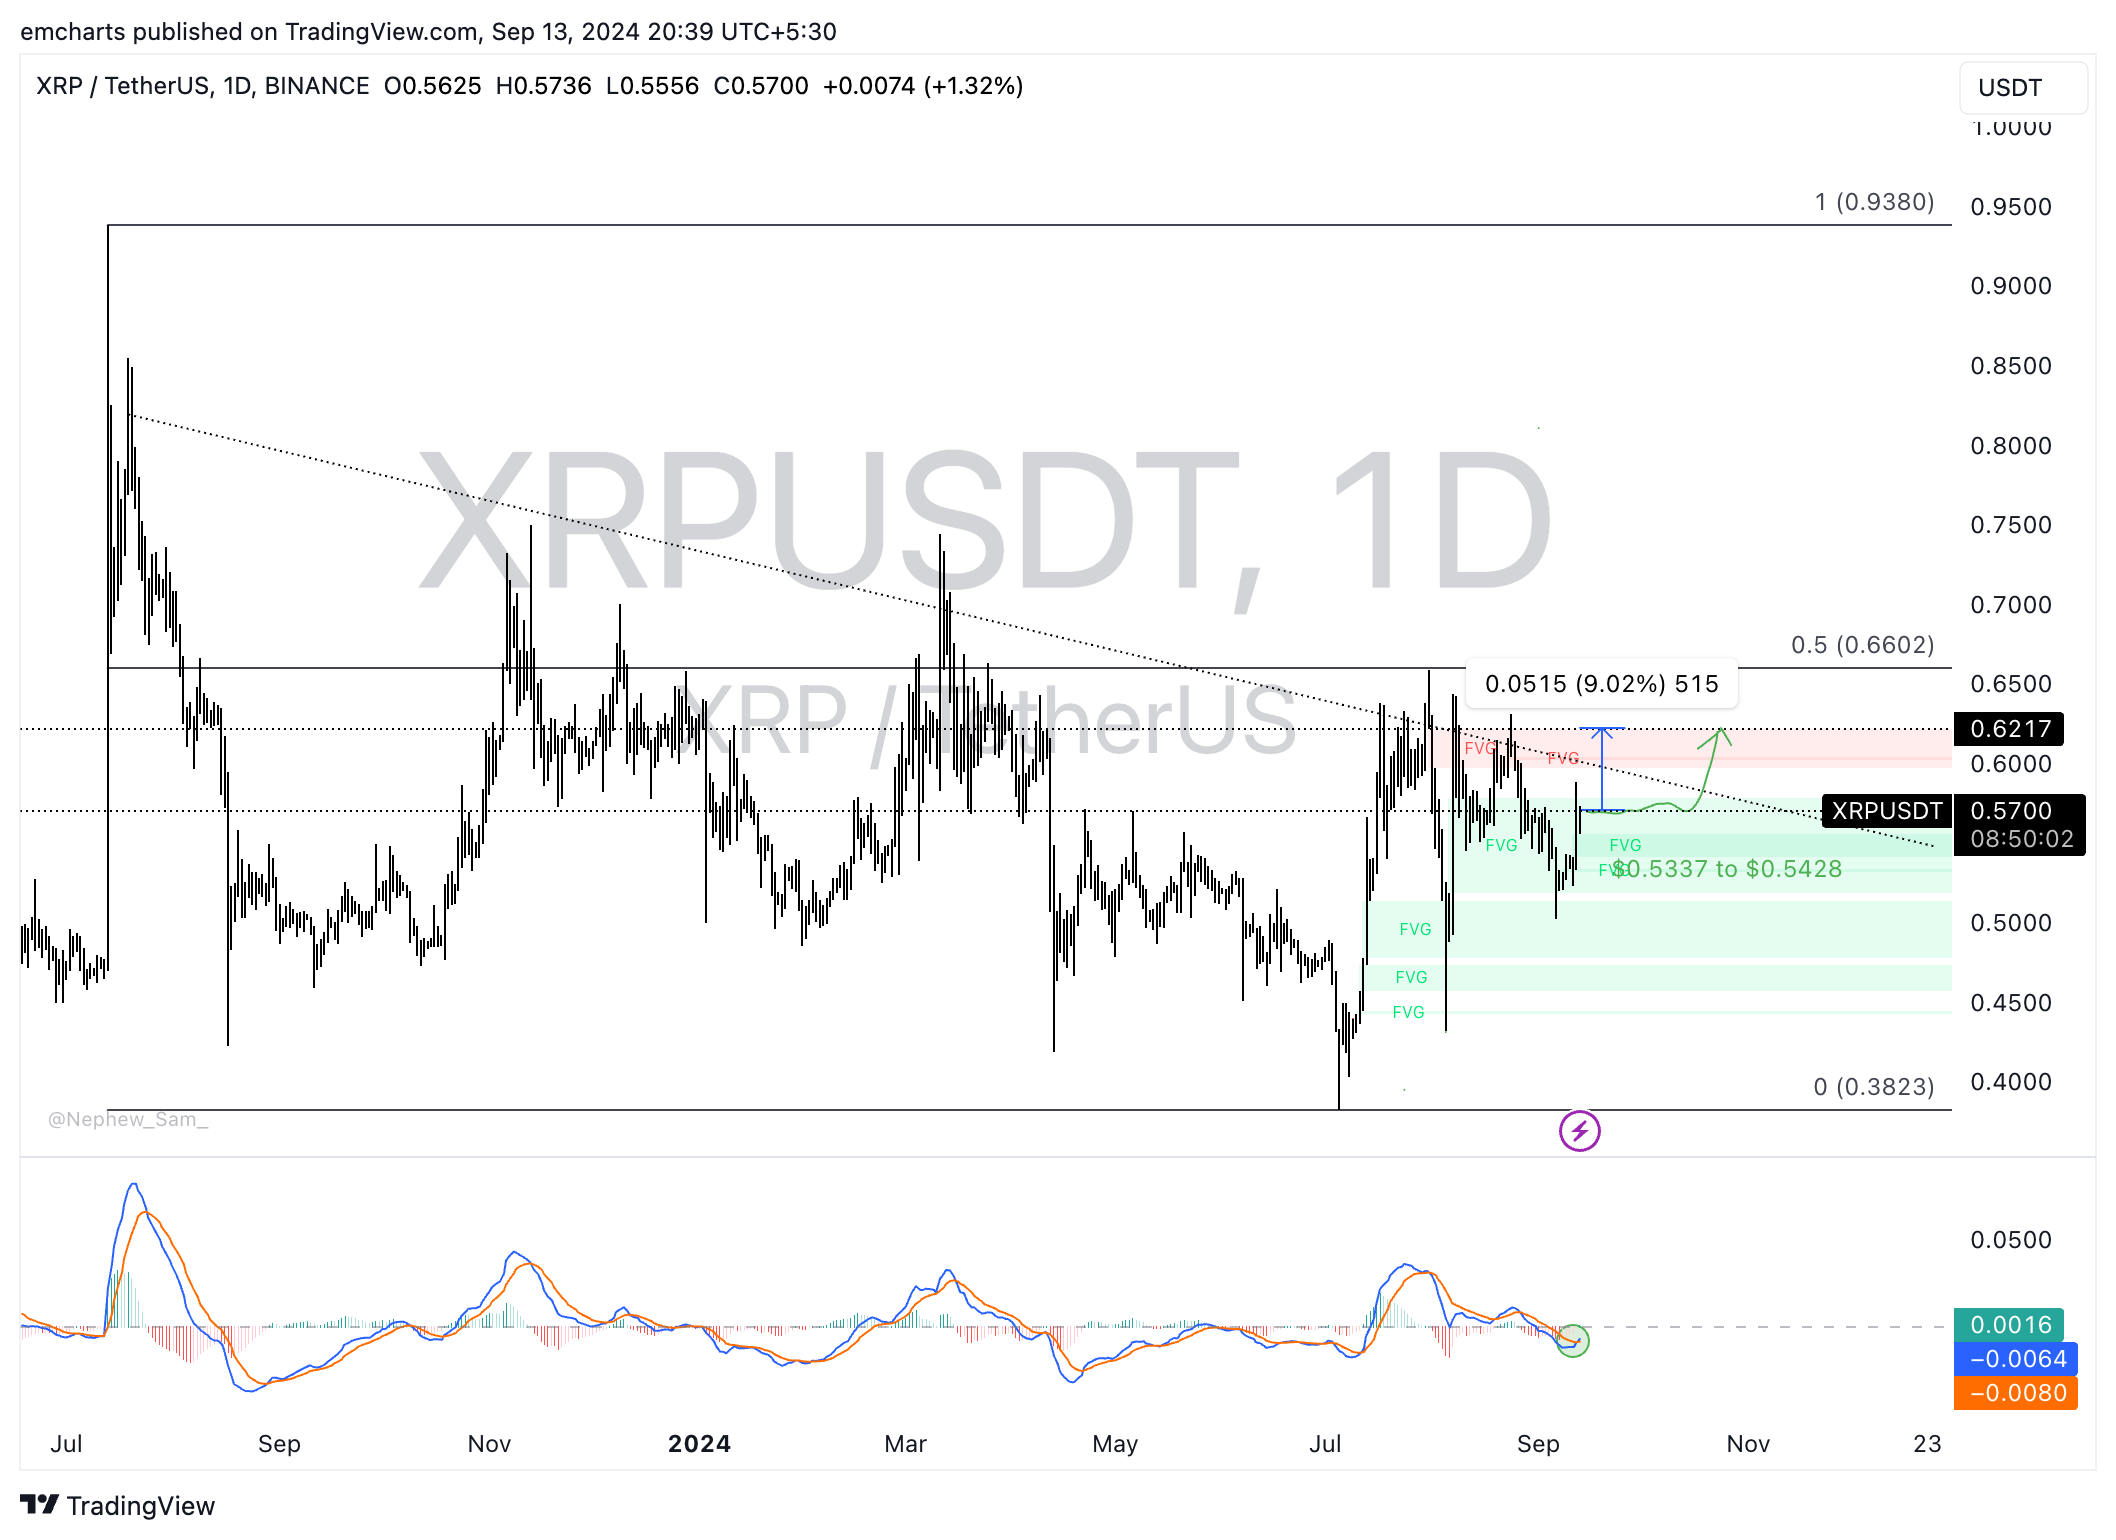
XRP/USDT daily chart
If the altcoin’s price declines, it could find support in the FVG between $0.5337 ad $0.5428. These levels have acted as support throughout August and September.
Cryptocurrency metrics FAQs
The developer or creator of each cryptocurrency decides on the total number of tokens that can be minted or issued. Only a certain number of these assets can be minted by mining, staking or other mechanisms. This is defined by the algorithm of the underlying blockchain technology. Since its inception, a total of 19,445,656 BTCs have been mined, which is the circulating supply of Bitcoin. On the other hand, circulating supply can also be decreased via actions such as burning tokens, or mistakenly sending assets to addresses of other incompatible blockchains.
Market capitalization is the result of multiplying the circulating supply of a certain asset by the asset’s current market value. For Bitcoin, the market capitalization at the beginning of August 2023 is above $570 billion, which is the result of the more than 19 million BTC in circulation multiplied by the Bitcoin price around $29,600.
Trading volume refers to the total number of tokens for a specific asset that has been transacted or exchanged between buyers and sellers within set trading hours, for example, 24 hours. It is used to gauge market sentiment, this metric combines all volumes on centralized exchanges and decentralized exchanges. Increasing trading volume often denotes the demand for a certain asset as more people are buying and selling the cryptocurrency.
Funding rates are a concept designed to encourage traders to take positions and ensure perpetual contract prices match spot markets. It defines a mechanism by exchanges to ensure that future prices and index prices periodic payments regularly converge. When the funding rate is positive, the price of the perpetual contract is higher than the mark price. This means traders who are bullish and have opened long positions pay traders who are in short positions. On the other hand, a negative funding rate means perpetual prices are below the mark price, and hence traders with short positions pay traders who have opened long positions.
Recommended Articles


