

Ethereum ETF and exchange investors step up buying pressure following spike in key metrics
- Ethereum ETF recorded $11.4 million in inflows after five days of consecutive outflows.
- Ethereum exchange net flows indicate high buying pressure after 177K ETH outflows in past two days.
- Ethereum's sideways move and historical Q3 market lull could prove to be the "calm before the storm."
Ethereum (ETH) was down 1% on Wednesday as investors stepped up their buying pressure via exchange-traded funds (ETF) and exchanges. This could be due to ETH's potential to rally after the end of its historical Q3 market lull.
Daily digest market movers: ETH ETF flips to inflows, exchange flows indicate buying pressure
Ethereum ETFs posted $11.4 million in inflows on Tuesday, ending their five-day outflow streak. The flows came from BlackRock's ETHA and Fidelity's FETH, with inflows of $4.3 million and $7.1 million, respectively. Other issuers saw zero flows. A potential reason for the inflows is due to Grayscale's ETHE seeing zero flows, underscoring its factor in the net flow performance of ETH ETFs.
Ethereum exchange net flows also indicate a similar bullish sentiment after recording net outflows of over 177K ETH worth about $416 million in the past two days, per CryptoQuant's data.
 - All Exchanges (4)-638616812219093792.png)
ETH Exchange Net Flow
Exchange net flows are the cumulative difference between coins flowing in/out of an exchange. Unlike ETF flows, outflows indicate high buying pressure and vice versa for inflows.
As a result, the 177K ETH exchange net outflows indicate investors are returning to the market with high buying pressure. Additionally, the ETH exchange net flow 30-day Simple Moving Average (SMA) has also been indicating growing outflows since August. This suggests that ETH buying pressure has outweighed selling pressure in the past month.
However, ETH whale transactions (>$1M) have been down considerably in the past few weeks.
 [19.59.03, 11 Sep, 2024]-638616812799325375.png)
ETH Whale Transaction Count (>$1M)
According to Santiment analysts, these large whales could be waiting for lower prices to scoop up large quantities during heightened FUD or higher prices to distribute holdings during increased FOMO. Hence, ETH has more upside potential as it's unlikely whales will capitulate at current prices.
ETH technical analysis: Ethereum's consolidation could prove to be "calm before the storm"
Ethereum is trading around $2,340 on Wednesday, down 1% on the day. In the past 24 hours, ETH has seen over $42 million in liquidations, with long and short liquidations accounting for $34.66 million and $7.72 million, respectively, per Coinglass data. Notably, a long position was liquidated for $11.82 million following a brief decline to $2,278.
On the daily chart, ETH is trading below a descending trendline within a symmetry triangle that suggests its price could decline toward the $2,100 to $2,200 range in September before staging a rally.
ETH posted similar declines from August to November 2022 and July to October 2023 before eventually seeing a rally. The move also aligns with ETH's historical Q3 market lull. If history repeats itself, ETH's current consolidation could prove to be the "calm before the storm."
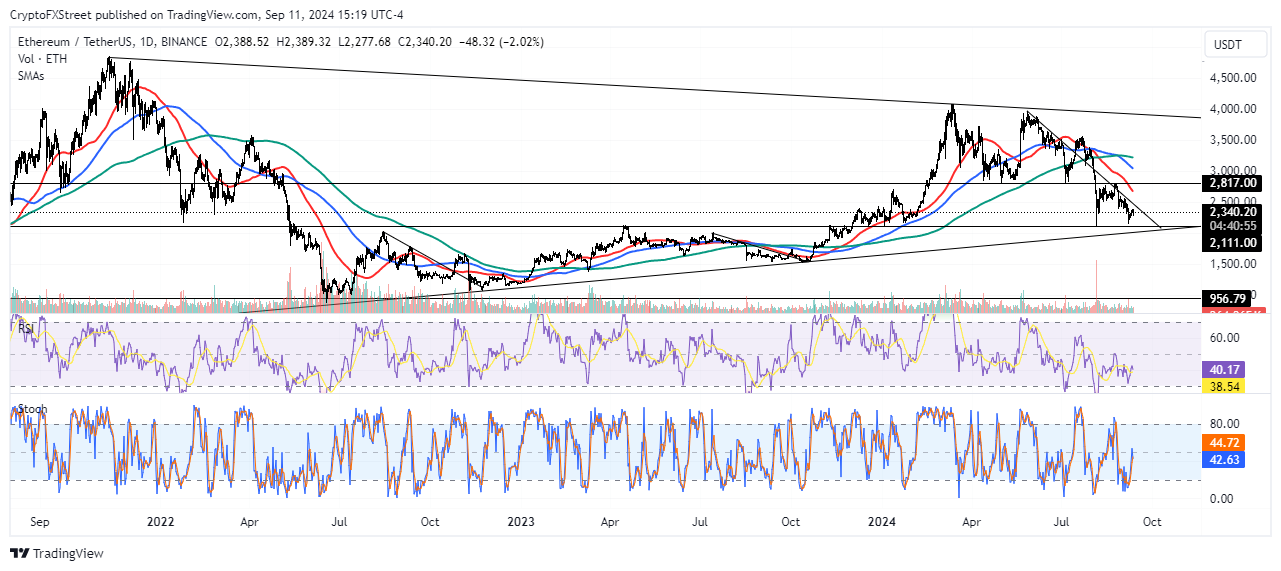
ETH/USDT Daily chart
On the upside, ETH faces a key resistance around the $2,817 level, which is the upper horizontal line of a key rectangle channel that prices have remained within since August. The descending 50-day Simple Moving Average (SMA) could also strengthen this resistance.
The Relative Strength Index (RSI) and Stochastic Oscillator (Stoch) momentum indicators are just below their neutral levels, indicating weakened bullish pressure.
A daily candlestick close below $2,000 would invalidate the thesis.
In the short term, ETH could decline to $2,271 to liquidate positions worth $35.44 million.
Ethereum FAQs
Ethereum is a decentralized open-source blockchain with smart contracts functionality. Serving as the basal network for the Ether (ETH) cryptocurrency, it is the second largest crypto and largest altcoin by market capitalization. The Ethereum network is tailored for scalability, programmability, security, and decentralization, attributes that make it popular among developers.
Ethereum uses decentralized blockchain technology, where developers can build and deploy applications that are independent of the central authority. To make this easier, the network has a programming language in place, which helps users create self-executing smart contracts. A smart contract is basically a code that can be verified and allows inter-user transactions.
Staking is a process where investors grow their portfolios by locking their assets for a specified duration instead of selling them. It is used by most blockchains, especially the ones that employ Proof-of-Stake (PoS) mechanism, with users earning rewards as an incentive for committing their tokens. For most long-term cryptocurrency holders, staking is a strategy to make passive income from your assets, putting them to work in exchange for reward generation.
Ethereum transitioned from a Proof-of-Work (PoW) to a Proof-of-Stake (PoS) mechanism in an event christened “The Merge.” The transformation came as the network wanted to achieve more security, cut down on energy consumption by 99.95%, and execute new scaling solutions with a possible threshold of 100,000 transactions per second. With PoS, there are less entry barriers for miners considering the reduced energy demands.
Recommended Articles


